
TANF Spending in Federal Fiscal Year 2001
by Zoë Neuberger
Table of Contents • Overview |
| PDF of this report |
| If you cannot access the files through the links, right-click on the underlined text, click "Save Link As," download to your directory, and open the document in Adobe Acrobat Reader. |
The 1996 welfare legislation, which created the Temporary Assistance for Needy Families (TANF) block grant, established a fixed level of federal welfare funding while giving states new flexibility to design their own welfare programs. How states have chosen to spend these federal funds, as well as the state funds they must spend to receive their TANF block grant, illustrates the varying welfare reform approaches that states have adopted.
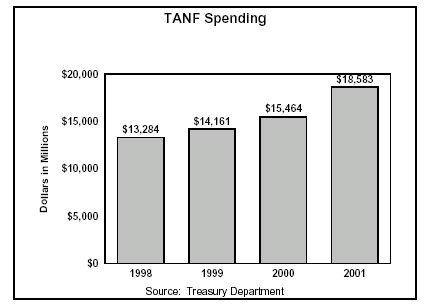
Since the implementation of TANF in 1997, states have spent more federal TANF funds each year. Based on Treasury Department data, states spent a total of $18.6 billion in federal TANF funds in fiscal year 2001; this was the first year states spent more than they received in new TANF grants. (Individual states in which spending exceeded their grant made up the difference with TANF funds remaining from prior years.) When these federal funds are combined with state welfare funds, states spent a total of $29.7 billion. An increasing portion of these funds have been spent on services and supports for families rather than on cash assistance.
There are two federal sources of TANF spending data — both are accurate, but they measure spending differently.(1) The Treasury Department provides the most accurate data on total TANF spending in a given fiscal year, but does not report data by state, nor any information about how funds were spent. The Department of Health and Human Services collects state spending data that includes detailed information on how funds were used, but does not provide the best measure of overall spending because states report the total amount of funds they transferred to the Child Care and Development Fund or Social Services Block Grant in that fiscal year without distinguishing whether the funds have actually been spent. The state-by-state analyses in this paper and analyses of how funds were spent rely on the data that states reported to HHS because that is the only detailed data available.
Treasury Department data show that states spent a total of $18.6 billion in fiscal year 2001. Data reported to HHS show that states directly spent $14.9 billion in federal TANF funds in TANF-funded programs in fiscal year 2001, which means that they spent $3.7 billion out of funds transferred to CCDF or SSBG. Fiscal year 2001 data reported to HHS show that the states transferred only $2.7 billion to CCDF and SSBG, which means that they drew on prior-year transfers to spend in excess of current-year transfers by $1 billion.
Initially, many states left a significant portion of their federal TANF funds unspent. As the chart above shows, however, since fiscal year 1998 state spending of federal TANF funds has increased by an average of 12 percent annually. State spending of federal and state welfare funds combined has increased by an average of seven percent annually.
States' slow start in using their full federal TANF block grants occurred in part because it took time for them to adjust to TANF's block grant funding structure and less restrictive spending rules. The Department of Health and Human Services did not issue final regulations clarifying the extent of state flexibility under TANF until 1999. Even when states understood that they could create innovative programs to help families find and retain jobs, it took time to design and implement such programs.
Another reason for the slow start in state use of TANF funds was that during the late 1990s cash assistance caseloads fell faster than states had anticipated. Spending on cash assistance, which made up 61 percent of federal and state welfare funds used in fiscal year 1998, fell to 38 percent by fiscal year 2001.
The drop in cash assistance caseloads freed up funds that states could devote to low-income working families, as well as families with employment barriers that remained on the cash assistance rolls. States have begun offering a broad range of supports to low-income working families to help them make ends meet and remain in the workforce. For example, some states bolster earnings through wage subsidies, earned income tax credits, or matches for individual savings accounts. In addition, many states provide work supports like child care or transportation subsidies to help working families retain jobs, or education and training to help families progress in the workforce.
Of the various work supports that states provide, child care has received the most significant influx of TANF funds. Between fiscal year 1998 and fiscal year 2001, the share of federal and state TANF funds used that were devoted specifically to child care rose from eight percent to 18 percent. In fiscal year 2001 the states devoted $3.4 billion in federal TANF funds to child care; when state welfare funds are included child care received a total of $5.1 billion through TANF.
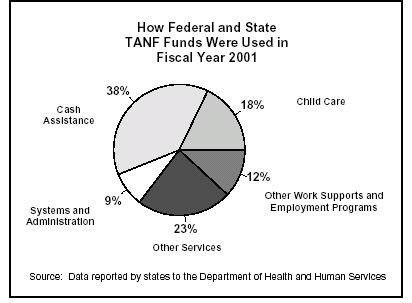
The following chart shows how states allocated the federal and state welfare funds they used in fiscal year 2001. In addition to spending on cash assistance, child care, and other work supports discussed above, states devoted 22 percent of the funds they used to a range of other services. These services include child welfare services, social services provided through funds transferred to the Social Services Block Grant, teen pregnancy prevention programs, and family formation activities. Nine percent of spending was devoted to personnel and administrative costs.
This paper analyzes how much states spent in federal and state welfare funds in federal fiscal year 2001 and how they spent it. After a brief overview of overall spending levels and how much funding was available to states, the paper provides a more detailed analysis of how funds were used, followed by a discussion of funds that remained unspent.
The most noteworthy aspects of state welfare spending in fiscal year 2001 include:
- For the first time, states spent more federal TANF funds than they received that year. States spent $18.6 billion in federal funds according to Treasury data — $1.8 billion more than the $16.8 billion they received in annual TANF grants.(2)
- Some 27 states and the District of Columbia drew on unspent federal TANF funds from prior years to support their TANF programs. As a result, reserves of unspent federal TANF funds diminished for the first time since the 1996 law was enacted.
- The portion of combined federal and state welfare funds that was devoted to cash assistance fell to 38 percent.
- States continued to devote substantial resources to child care, both through direct spending in the TANF program and through the transfer of TANF funds to the Child Care and Development Fund. Child care accounted for 18 percent of total state and federal welfare funds used.
- States devoted 12 percent of the federal and state welfare funds used to providing other work supports and employment programs such as job training, wage subsidies, and refundable earned income tax credits.
Under TANF, states are permitted to use block grant funds for a range of activities that extend far beyond providing cash assistance to families. In fact, states may spend TANF funds on any activity that is reasonably calculated to accomplish one of the four purposes identified in the TANF statute — assisting needy families so children may be cared for at home, ending dependence of needy families on government benefits by promoting work and marriage, reducing out-of-wedlock pregnancies, and encouraging two-parent family formation and maintenance.
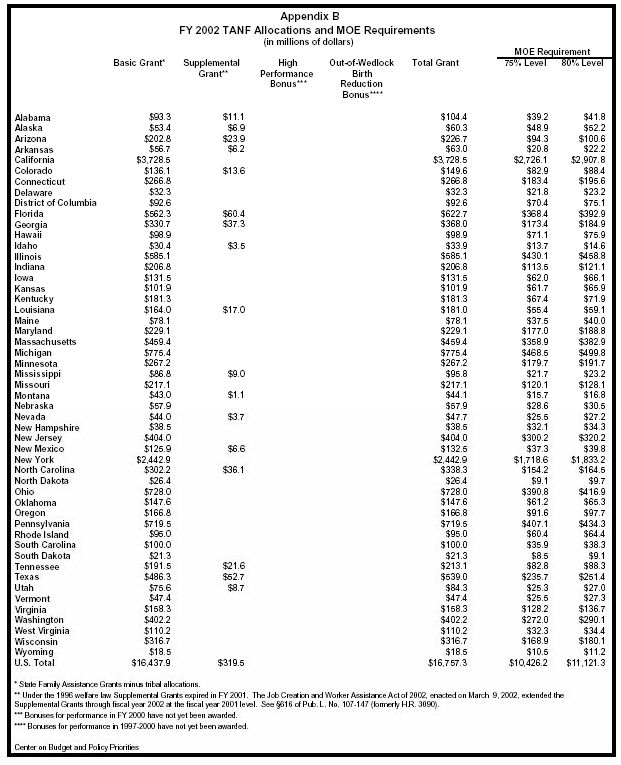
In fiscal year 2001, a total of $17.1 billion in federal funds was made available to states. The main portion of federal TANF funds, amounting to $16.5 billion annually, was distributed in State Family Assistance Grants.(3) Each state's grant was based on federal spending on that state's Aid to Families with Dependent Children program in 1992 through 1995. In federal fiscal year 2001, seventeen states also received Supplemental Grants because they had historically low AFDC spending levels or relatively high population growth. These grants amounted to a total of $319 million in fiscal year 2001.(4) In addition, $300 million in bonuses were distributed in fiscal year 2001.(5)
Under TANF, states must meet a maintenance of effort (MOE) requirement by spending a specified amount of their own funds on activities that serve needy families and meet one of the purposes of the welfare law. Each state must spend an amount equal to at least 75 percent of the amount it spent on AFDC programs in federal fiscal year 1994. If states were to spend exactly 75 percent of the fiscal year 1994 baseline, they would spend $10.4 billion. States face fiscal penalties for not meeting the MOE requirement and also must make up for any MOE shortfall through additional expenditures in the following year. Each state has met its MOE requirement in every year.(6)
Appendices A and B show for fiscal years 2001 and 2002 the federal TANF funds each state received as well as the amount of state funds each state needed to spend to meet its MOE requirement.
As the number of families with children receiving basic cash assistance fell, states increasingly devoted state and federal TANF funds to supports for low-income working families, such as child care and transportation subsidies; to more intensive employment efforts to help families that have not yet made the transition to work; and to efforts to meet the law's family formation goals, such as programs to reduce teen pregnancy. It took time for states to adjust to the expanded purposes of TANF, the reduction in cash assistance caseloads, and the funding flexibility inherent in the TANF block grant structure. Thus the amount of federal TANF funds used by states has increased each year as they have come to understand the potential uses for the funds.
Taking into account state MOE funds as well as federal TANF funds, states reported spending a total of $29.7 billion in TANF funds in federal fiscal year 2001, as compared to $26.6 in fiscal year 2000. That total includes spending of federal funds transferred to CCDF or SSBG, federal and state funds spent directly in the state's TANF program, and state funds spent in separate state programs.
In federal fiscal year 2001, states for the first time used more federal TANF funds than the $16.8 billion they received in annual federal TANF grants. The states spent or transferred a total of $17.6 billion in federal funds, which represents nearly $800 million more than their annual grants.
For the purposes of this paper, TANF funds are considered "used" when they have either been spent on one of the many allowable TANF activities or transferred to CCDF or to SSBG. (See text box on next page.) In the context of federal reporting, TANF funds are not considered spent until they have actually been expended directly on services or through a contract. If funds have been obligated, through a contract for example, but not yet spent, the state may report the funds as unliquidated obligations. Such funds, however, would not be counted as "used" at the federal level because they have not yet been expended. Thus there are funds that do not appear to have been used that nonetheless have been obligated by the state for a specific purpose.
Funds "Used" vs. "Spent" Monitoring state-by-state TANF spending is complicated by one data reporting issue. As explained on page 12, transferred funds may be spent over the course of three years in CCDF and two years in SSBG. When states report to HHS on their TANF expenditures, funds that have been transferred to CCDF or SSBG are reported simply as transferred regardless of whether they have been spent. States do not report to HHS when transferred funds are spent. Thus, funds that have been transferred are not reported as unspent even if they have not yet been spent through CCDF or SSBG. In this paper, funds that have been spent in TANF-funded programs or transferred are referred to as having been "used." The Treasury Department also tracks and publishes national data on TANF spending. The Treasury Department, however, does not report transferred funds as spent until they have actually been spent through CCDF or SSBG. As a result, the amount of funds used in a given year as reported by states to HHS may be different than the amount of funds the Treasury Department reports as having been spent. Funds used could be higher or lower depending on how transferred amounts in the current year compare to amounts spent from current- or prior-year transferred funds. For example, if in a given fiscal year the states transferred $2 billion to CCDF and SSBG, but drew on prior-year transfers to spend $2.2 billion in transferred funds, spending as reported by the Treasury Department would be $200 million higher than funds used as reported to HHS. In fiscal year 2001, the Treasury Department reported TANF spending of $18.6 billion in federal funds, an increase of more than $3 billion over fiscal year 2000.(7) Based on the data reported to HHS, states used $17.6 billion in TANF funds in fiscal year 2001, an increase of $1.7 billion over fiscal year 2000. The Treasury Department data give a more accurate indication of overall TANF spending nationwide. This paper also relies on HHS data, however, because they offer state-by-state information on how funds were spent. Based on HHS data, states spent a total of $14.9 billion in federal funds in their TANF programs and transferred $2.7 billion. This means that of the $18.6 billion reported as spent by the Treasury Department, $14.9 was spent directly in TANF programs and $3.7 was spent out of transferred funds. Since states transferred only $2.7 billion in fiscal year 2001, spending of transferred funds exceeded transfers in fiscal year 2001 by $1 billion. This means that states augmented CCDF and SSBG spending by drawing on funds that had been transferred in prior years but had not yet been spent. States now are both using more than their current annual TANF grant by drawing on reserves and spending more in CCDF and SSBG than they are currently transferring by spending funds transferred in prior years. Thus, 2001 program levels, which relied on prior-year resources, will not be sustainable under current funding arrangements. |
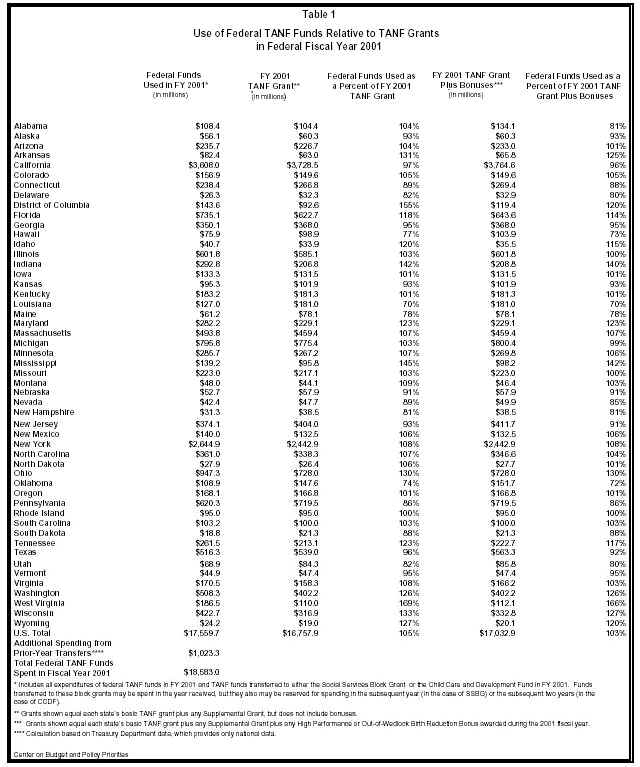
One way to measure the level of federal TANF funds used is to compare it to the amount of federal funds made available to the state for the year. Table 1 compares, for each state, the use of federal TANF funds in fiscal year 2001 with the state's fiscal year 2001 TANF grant. The table presents each state's use of TANF funds in FY 2001 as a percent of its fiscal year 2001 award with and without performance bonuses.
Because states cannot anticipate receiving performance bonuses — and because there is no guarantee of future receipt of bonuses — excluding these bonuses when comparing the use of TANF funds with the annual TANF grant provides a useful indication of the extent to which states are using TANF funds they can expect to receive each year. Thirty states and the District of Columbia used more than their annual TANF grant in fiscal year 2001. Together the states used 105 percent of the federal TANF funds they could expect to receive in fiscal year 2001.
In order to see whether states that exceeded their annual TANF grant drew on funds from prior years, use of federal TANF funds must be compared to all federal TANF funds received, including performance bonuses. Including bonuses, the states used 103 percent of the federal funds they received in fiscal year 2001. This means that on average states used more than they received in new federal funds, drew upon unspent federal funds from prior years, and now have smaller reserves of TANF funds. Not every state used more than it received, but twenty-seven states and the District of Columbia drew on unspent funds from prior years to support their current level of TANF programming.
Example: In federal fiscal year 2001, TANF expenditures and transfers in Montana totaled $48.0 million. The state's TANF grant for the year equaled $44.1 million. The TANF funds used equaled 109 percent of its annual TANF grant. Montana also received performance bonuses, which brought the total amount of federal TANF funds it received in fiscal year 2001 to $46.4 million. Montana spent 103 percent of the total federal funds it received, which means the state drew on unspent funds from prior years.
The states that used more than they received in federal funds in fiscal year 2001 will need to continue to draw on unspent funds from prior years in order to maintain their current welfare reform efforts. These unspent TANF resources are limited, however. In 17 of the states now spending above their annual funding level, unobligated TANF funds from prior years are insufficient to allow them to maintain their fiscal year 2001 spending level in 2002, the current fiscal year. An additional six states have insufficient reserves of unobligated TANF funds to maintain the fiscal year 2001 program level through fiscal year 2003.
Under TANF, each state must spend an amount equal to at least 75 percent of what the state spent on AFDC programs in federal fiscal year 1994 in order to meet a maintenance of effort requirement. MOE spending generally must be on activities that serve needy families and meet one of the purposes of the welfare law. MOE funds may be spent in a state's TANF program or in separate state programs. MOE funds that are spent in separate state programs (that receive no federal TANF funds), are not subject to federal work participation rates, time limit restrictions, or child support reporting requirements, though states can impose their own requirements on participants in separate state programs.
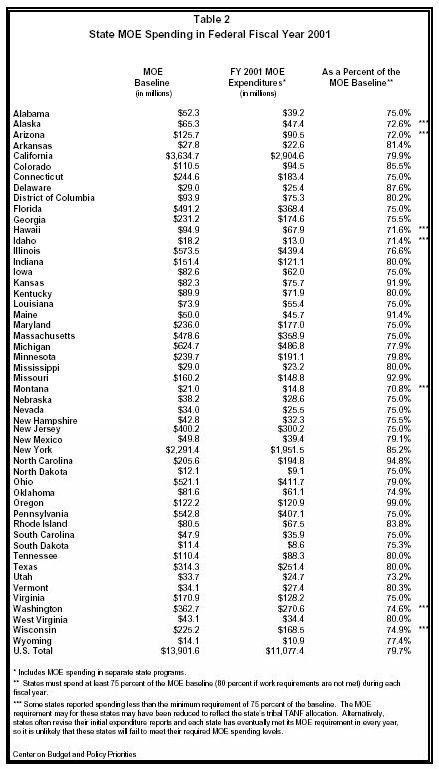
In fiscal year 2001 the states collectively reported $11.1 billion in MOE spending, which is equal to about 80 percent of the total amount the states spent on AFDC programs in federal fiscal year 1994. Table 2 shows MOE spending in federal fiscal year 2001 as reported by each state. The first column shows fiscal year 1994 spending by each state on AFDC programs, which constitutes its MOE baseline. The second column shows the MOE amount each state reported spending in fiscal year 2001 in the state's TANF program and in separate state programs. The last column shows the reported spending amount as a percentage of the baseline. Thus, a state would need to be at least 75 percent in the last column in order to meet its MOE requirement, unless the MOE requirement were reduced to reflect the state's tribal allocation. Some states have reported a lower MOE amount, but it is unlikely that any state has failed to meet its MOE requirement. States are permitted to revise their reports if they identify additional allowable MOE spending that was not originally reported. In past years many states have made such revisions.
Example: New Mexico reported $39.4 million in MOE spending in federal fiscal year 2001, which is equal to 79.1 percent of its MOE baseline.
The overall level of federal TANF funds used provides a snapshot of federal resources devoted to welfare reform efforts, but does not illustrate how states are directing the funds they spend. Under TANF states have broad flexibility with regard to policy and programming. As a result, TANF programs vary considerably across the states and this variation is reflected in the ways that states direct their TANF and MOE funds. Since 1996, states have generally broadened the mission of their welfare programs from providing a cash assistance safety net to offering a broad range of supports for low-income families, including assistance in obtaining work and supports for working families that nonetheless continue to have low-incomes. Such transformations have been reflected in the nature of state spending. For example, during the period from federal fiscal year 1998 to 2001 spending on cash assistance declined from 61 percent to 38 percent of total TANF and MOE funds used while spending on child care increased from eight percent to 18 percent.
This section begins with an analysis of transfers of federal funds. It goes on to examine how states are directing the federal TANF funds and state MOE funds spent in their TANF programs, beginning with a comparison of spending on basic assistance to spending on other programs followed by more detailed analyses of spending on cash assistance, child care, and work-related supports. The section concludes with a discussion of the variation in spending choices among states.
States have the authority to transfer a portion of their current-year federal TANF funds to the Child Care and Development Fund and the Social Services Block Grant. The amount that may be transferred to SSBG has been limited to 10 percent of the federal funds the state received, and the combined CCDF/SSBG transfer limit is 30 percent of the federal funds.(8)
When TANF funds are transferred to CCDF or SSBG, the rules of those block grants, not TANF rules, govern the use of the funds. As a result, transferred funds may be spent over the course of three years in CCDF and two years in SSBG.(9) In the federal TANF spending reports upon which this analysis is based, funds are reported as transferred whether or not they have been spent. Thus, TANF funds reported as unspent do not include funds that have been transferred but remain unspent in CCDF or SSBG.(10)
The states transferred $1.8 billion to CCDF in fiscal year 2001. CCDF is the main federal mechanism for providing child care subsidies to low-income families. While states can spend TANF funds directly on child care, transferring these funds to CCDF allows states to maintain a unified child care system serving working families who receive TANF as well as those low-income families who do not receive TANF cash assistance. In addition, TANF funds spent directly on child care for non-working families would have time limit and work requirement implications while use of CCDF funds transferred from TANF would not affect TANF time limits or work requirements for these families. Thus, it may be advantageous to use TANF funds transferred to CCDF to provide child care to some families, particularly families that are neither employed nor receiving a welfare check — for example, those in post-secondary education or training. Under CCDF rules subsidies may be provided to any low-income family in which a parent is working or attending a job training or educational program.
The states transferred $938.7 million to SSBG in fiscal year 2001. SSBG funds a wide array of social services for families with children as well as single individuals and childless couples, especially the elderly. TANF funds transferred to SSBG can be used for any allowable SSBG service, but only for families with children that have incomes below 200 percent of the federal poverty threshold. Low-income families receiving services funded through SSBG do not face TANF time limits or work requirements.
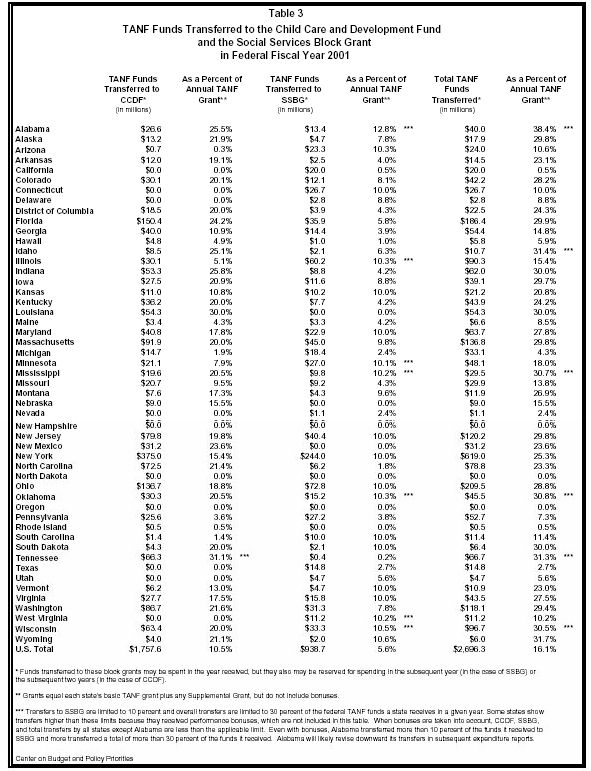
Table 3 identifies the amount of TANF funds transferred by each state to CCDF and SSBG in federal fiscal year 2001, and it presents those amounts as a share of the state's fiscal year 2001 annual TANF grant.
Example: In federal fiscal year 2001, Georgia transferred $40.0 million of TANF funds — 10.9 percent of its fiscal year 2001 annual TANF grant — to the Child Care and Development Fund. The state also transferred $14.4 million of TANF funds — 3.9 percent of its fiscal year 2001 TANF grant — to the Social Services Block Grant.
Although transfer amounts varied considerably among the states, with some states transferring the maximum amount allowable and others no funds at all, taken together the states transferred 10.5 percent of their fiscal year 2001 federal TANF funds to CCDF and 5.6 percent to SSBG. The portions and amounts transferred have decreased slightly since fiscal year 2000, when states transferred 12 percent of their federal TANF funds to CCDF and seven percent to SSBG.
States report TANF and MOE spending in two broad categories — assistance and non-assistance. Examining the portion of spending devoted to each category is one way to assess the extent to which a state has transformed its welfare program from focusing on monthly cash benefits to providing a broader range of services and benefits that are considered "non-assistance."
Assistance is defined by regulation to include cash or other benefits designed to meet a family's ongoing basic needs, such as food, clothing, or shelter.(11) When a family is receiving assistance, requirements regarding time limits, work, child support assignment, and state reporting apply. Assistance generally includes the kinds of expenditures to which states devoted most of their AFDC funds prior to 1996. The vast majority of spending on assistance — 85 percent in fiscal year 2001 — is in the form of cash benefits, but transportation or child care subsidies for unemployed families count as assistance as well as certain other activities on which small amounts are spent.
Spending on programs or services that are not designed to meet ongoing basic needs like food, clothing, or shelter are known as "non-assistance." Non-assistance includes work-related activities, such as job training or wage subsidies; benefits for employed families, such as child care subsidies or earned income tax credits; and family formation activities, such as pregnancy prevention for unmarried couples or marriage counseling. Non-assistance also includes the systems and administrative costs associated with providing the full range of benefits and services, including assistance. Funds transferred to CCDF or SSBG are not reported as either assistance or non-assistance.
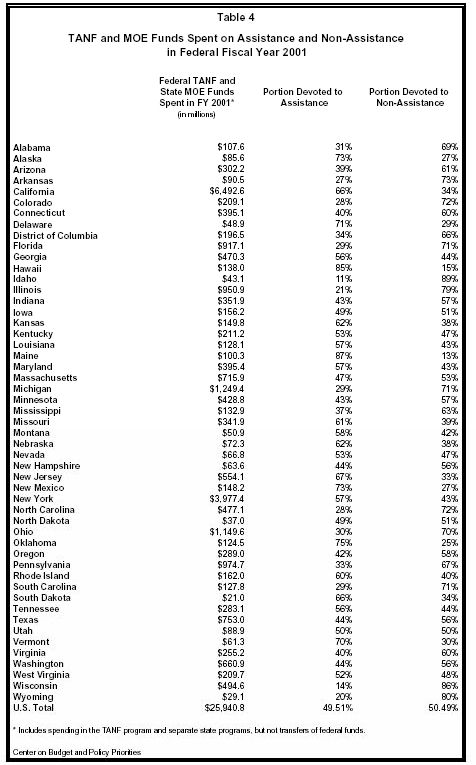
Table 4 shows the amount of state and federal funds each state spent in federal fiscal year 2001 in its TANF-funded programs. (Transfers are excluded and separate state programs supported by MOE funds are included.) It also shows the percentage of spending devoted to assistance and non-assistance. Taken together, the states spent $14.9 billion in federal TANF funds directly in their TANF programs. They spent an additional $11.1 billion in MOE funds in their TANF programs or separate state programs.
Of total federal and state spending in the TANF program and separate state programs, $12.8 billion was devoted to assistance while $13.1 billion was devoted to non-assistance. In other words, states spent about half their funds on assistance and half on non-assistance. Spending on assistance includes funds spent on child care or transportation subsidies for unemployed families as well as cash assistance. Over time, states have been devoting more resources to non-assistance, which illustrates the extent to which state TANF-funded programs now provide a range of services to a variety of low-income families, many of whom are working.
Example: In federal fiscal year 2001, Texas spent $753.0 million of federal TANF funds and state MOE funds in its TANF-funded programs and separate state programs, 44 percent of which was devoted to assistance and 56 percent of which was devoted to non-assistance.
In some instances the distinction between assistance and non-assistance does not illuminate the type of benefit provided. For example, child care and transportation subsidies count as assistance if the family is unemployed but as non-assistance if the family is working. Thus it is helpful to consider spending in more narrowly defined categories to get a more complete picture of state TANF programs. The next sections examine spending on cash assistance, child care, and other work supports and employment programs in more detail.
The portion of TANF and MOE funds that was devoted to cash assistance continued to fall in fiscal year 2001. Of all TANF and MOE funds that the states used, they devoted 38 percent to cash assistance, as compared to 42 percent in fiscal year 2000. The downward spending trend continued even though thirty-three states reported cash assistance caseload increases in the latter half of the fiscal year.(12) In spite of these caseload rises states spent $546 million less on cash assistance in fiscal year 2001 than they had in fiscal year 2000. This decline is far smaller, however, than the decline in recent years. The main reason that cash assistance spending declined in fiscal year 2001 as a portion of overall funds used is that use of funds in other areas increased by $2.2 billion over fiscal year 2000.
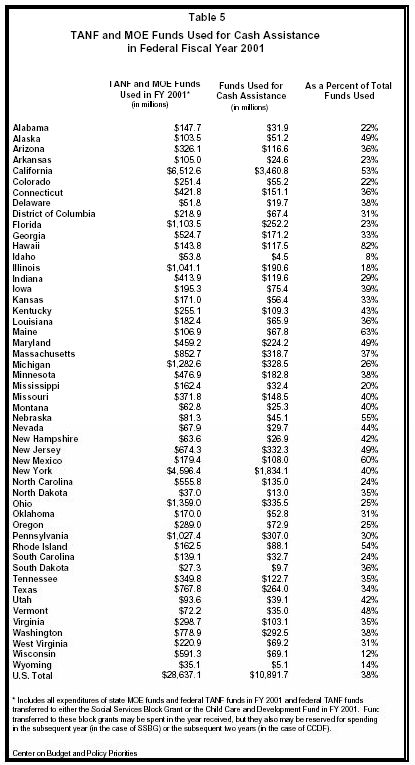
Table 5 shows, for each state, the amount of TANF and MOE funds that were spent on cash assistance, the total TANF and MOE funds used, and the funds spent on cash assistance as a portion of the total funds used. The portion of TANF and MOE funds devoted to cash assistance varies considerably among the states. Eleven states devote less than 25 percent of the TANF and MOE funds used to cash assistance, while ten states devote more than 45 percent of funds used to cash assistance.
Example: Washington used a total of $778.9 million in TANF and MOE funds in fiscal year 2001. Of that total, $292.5 million, or 38 percent, was devoted to cash assistance.
Care must be taken in interpreting the distinction between cash assistance and other categories. For example, many states choose to bolster the earnings of employed families that remain low-income. A state may do so by allowing the family to keep more of its income before eliminating its cash assistance benefits, which is known as an earnings disregard. The continuing cash assistance would be reported as a cash assistance expenditure. Alternatively, the state could provide a wage subsidy of the same amount, which would be paid to the employer to pass along to the worker, or an earned income tax credit. The wage subsidy or tax credit would be reported as forms of non-assistance. Thus, while it is helpful to consider spending in these more narrow categories, they do not provide a complete picture of a state's TANF program.
States have devoted a substantial portion of the funds freed up by cash assistance caseload reductions to child care. In fiscal year 2001 states devoted 18 percent of total TANF and MOE funds used to child care — including both direct spending in the state's TANF program and transfers to the state's CCDF program. In fiscal year 2000 states devoted 20 percent of total TANF and MOE funds used to child care and 17 percent the year before. That states continued to devote such a substantial portion of TANF funds to child care in fiscal year 2001 suggests that child care subsidies are considered a critical component of helping low-income parents obtain and retain jobs and that TANF funds have become an integral part of state child care funding structures.
Although, as a portion of total funds used, the percentage decreased from 20 percent in fiscal year 2000 — $333 million less in TANF funds were devoted to child care — the emphasis on child care within TANF remains striking. The states devoted a total of $5.1 billion in federal TANF and state MOE funds to child care. Of that total, $1.8 billion in federal funds were transferred to CCDF and $1.7 billion in federal funds were spent directly on child care, which means that $3.5 billion in federal funds were devoted to child care. In addition, $1.7 billion in state MOE funds were devoted to child care.(13) It is important to keep in mind, however, that states are permitted to count toward meeting their TANF MOE requirement state funds spent on child care that are also used to meet their CCDF MOE requirement. In the 2001 fiscal year $853 million were double-counted in this way. Such double-counted state MOE expenditures are included in this analysis of funds devoted to child care, but do not represent child care resources in addition to what would be available through CCDF.
While direct spending on child care increased by $230 million, transfers to CCDF decreased by $563 million.(14) The decrease in transfers may reflect two factors. First, states dramatically increased transfers to CCDF in fiscal year 1999 when the final TANF rules clarified that in future years only current year funds would be transferrable. Those funds had to be spent by the end of fiscal year 2001. Thus, in order to fund the same program level as the year before, states could draw on these prior-year transfers and did not need to transfer so much in new funds. The decrease in transfers is not reflected in a decrease in actual spending of TANF funds transferred to CCDF, nor does it suggest a decrease in demand for child care subsidies. In addition, there was an independent increase in CCDF funding of over $1 billion between fiscal year 2000 and fiscal year 2001. That states continued to devote close to the same amount of TANF funds to child care in spite of the availability of prior-year transfers and new federal child care resources suggests that many states considered there to be additional unmet need for child care subsidies.
As in other areas, the portion of funds used that states devoted to child care varies considerably. Eight states devoted less than 10 percent of funds used to child care while eight states devoted more than 30 percent of funds used to child care, including transfers and direct spending.
Table 6 shows, for each state, the amount of TANF and MOE funds that were spent on child care directly through the TANF program or that were transferred to CCDF, the total TANF and MOE funds used, and the funds used for child care as a portion of the total funds used.
Example: Minnesota used a total of $476.9 million in TANF and MOE funds in fiscal year 2001. Of that total, $86.7 million, or 18 percent, was devoted to child care.
TANF
and MOE Funds |
Funds
Used for |
As
a Percent of Total |
|
| Alabama | $147.7 | $32.7 | 22% |
| Alaska | $103.5 | $22.5 | 22% |
| Arizona | $326.1 | $48.4 | 15% |
| Arkansas | $105.0 | $18.8 | 18% |
| California | $6,512.6 | $795.7 | 12% |
| Colorado | $251.4 | $34.4 | 14% |
| Connecticut | $421.8 | $95.7 | 23% |
| Delaware | $51.8 | $17.3 | 33% |
| District of Columbia | $218.9 | $68.9 | 31% |
| Florida | $1,103.5 | $379.9 | 34% |
| Georgia | $524.7 | $68.9 | 13% |
| Hawaii | $143.8 | $4.8 | 3% |
| Idaho | $53.8 | $11.0 | 21% |
| Illinois | $1,041.1 | $346.0 | 33% |
| Indiana | $413.9 | $117.6 | 28% |
| Iowa | $195.3 | $32.7 | 17% |
| Kansas | $171.0 | $17.7 | 10% |
| Kentucky | $255.1 | $53.1 | 21% |
| Louisiana | $182.4 | $66.4 | 36% |
| Maine | $106.9 | $13.2 | 12% |
| Maryland | $459.2 | $34.6 | 8% |
| Massachusetts | $852.7 | $297.7 | 35% |
| Michigan | $1,282.6 | $342.8 | 27% |
| Minnesota | $476.9 | $86.7 | 18% |
| Mississippi | $162.4 | $40.2 | 25% |
| Missouri | $371.8 | $83.8 | 23% |
| Montana | $62.8 | $8.9 | 14% |
| Nebraska | $81.3 | $15.5 | 19% |
| Nevada | $67.9 | $1.6 | 2% |
| New Hampshire | $63.6 | $4.6 | 7% |
| New Jersey | $674.3 | $111.7 | 17% |
| New Mexico | $179.4 | $34.1 | 19% |
| New York | $4,596.4 | $477.0 | 10% |
| North Carolina | $555.8 | $186.1 | 33% |
| North Dakota | $37.0 | $3.6 | 10% |
| Ohio | $1,359.0 | $261.4 | 19% |
| Oklahoma | $170.0 | $41.0 | 24% |
| Oregon | $289.0 | $22.9 | 8% |
| Pennsylvania | $1,027.4 | $127.2 | 12% |
| Rhode Island | $162.5 | $30.7 | 19% |
| South Carolina | $139.1 | $5.4 | 4% |
| South Dakota | $27.3 | $4.9 | 18% |
| Tennessee | $349.8 | $102.9 | 29% |
| Texas | $767.8 | $27.7 | 4% |
| Utah | $93.6 | $4.5 | 5% |
| Vermont | $72.2 | $13.0 | 18% |
| Virginia | $298.7 | $49.2 | 16% |
| Washington | $778.9 | $211.6 | 27% |
| West Virginia | $220.9 | $30.2 | 14% |
| Wisconsin | $591.3 | $230.9 | 39% |
| Wyoming | $35.1 | $5.6 | 16% |
| U.S. Total | $28,637.1 | $5,144.0 | 18% |
* Includes all expenditures of state MOE funds and federal TANF funds in FY 2001 and federal TANF funds transferred to either the Social Services Block Grant or the Child Care and Development Fund in FY 2001. Funds transferred to these block grants may be spent in the year received, but they also may be reserved for spending in the subsequent year (in the case of SSBG) or the subsequent two years (in the case of CCDF). States are permitted to count toward meeting their TANF MOE requirement state funds spent on child care that are also used to meet their CCDF MOE requirement. For the 2001 fiscal year $853 million double-counted in this way are included in this analysis. |
|||
Other Work Supports and Employment Programs
In addition to child care, states have invested TANF and MOE funds in a wide range of work-related services and benefits designed to help families find and retain work and to make it feasible for low-income working parents to make ends meet. Nearly every state reports some spending on such work-related activities, but states vary in the emphasis of their programs and the portion of TANF and MOE funds used that are devoted to such activities. For example, seven states reported spending on refundable earned income tax credits, 37 states reported spending on transportation aid for working families, and 42 states reported spending on education or training.
In total, states devoted 12 percent of the TANF and MOE funds they used in fiscal year 2001 to other work supports and employment programs. Again, the portion they devoted to such activities varied, with 11 states devoting five percent or less to such activities and 14 states devoting 15 percent or more.
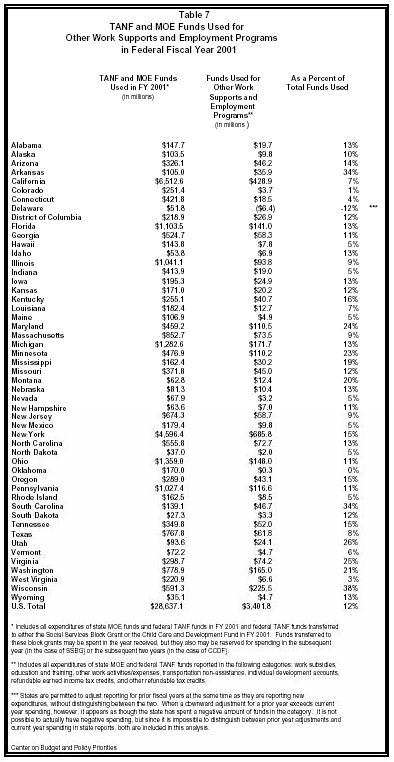
Table 7 shows, for each state, the amount of TANF and MOE funds that were spent on other work supports and employment programs, the total TANF and MOE funds used, and the funds spent on other work supports and employment programs as a portion of the total funds used. Spending on other work supports and employment programs includes any spending reported in the following categories: work subsidies, education and training, other work activities/expenses, transportation non-assistance, individual development accounts, refundable earned income tax credits, and other refundable tax credits.
Example: The District of Columbia used a total of $218.9 million in TANF and MOE funds in fiscal year 2001. Of that total, $26.9 million, or 12 percent, was devoted to other work supports and employment programs.
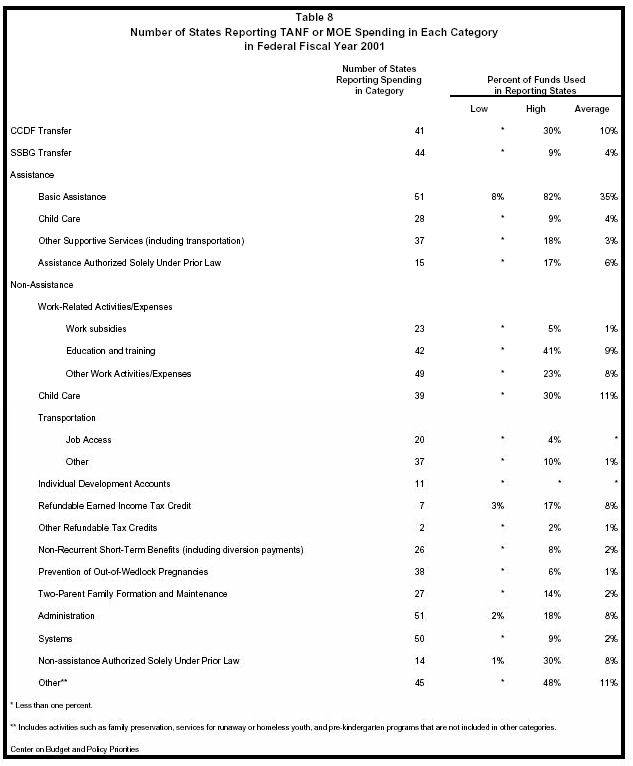
As mentioned above, while examining collective state spending in these three broad categories is a useful way to understand trends in the TANF program, it masks the tremendous variation in state policies and their associated spending patterns. To provide a better sense of the full range of activities that states are supporting with TANF or MOE funds, Table 8 shows all the required federal reporting categories and the number of states reporting any TANF or MOE spending in each. To illustrate the variety among states in how they allocate TANF and MOE funds to different types of benefits or services, Table 8 also shows the range in the portion of funds within a state devoted to a particular category and the average portion reported by those states with spending in the category.
Example: Seven states report spending some TANF or MOE funds on refundable earned income tax credits. Of the total TANF and MOE funds that were used, the portion that was devoted to the refundable earned income tax credit ranges from a low of three percent in states that report spending on such credits to as much as 17 percent of funds used. The average portion of TANF and MOE funds used in states with a TANF-funded refundable earned income tax was eight percent.
Unobligated and Unliquidated Funds
One of the tenets of the 1996 welfare legislation was to devolve many welfare policy and spending decisions to states. In combination with greater state flexibility and authority, annual federal funds were capped so that states bear more of the risk of unanticipated increases in program costs. Under the Aid to Families with Dependent Children program, the federal government shared with states some of the increased costs of providing cash assistance during recessions, when poverty rises and more families qualify for cash assistance. Under TANF, however, annual grants do not increase in the event of a recession. Unlike many other programs in which federal funds must be spent within a given time period, federal TANF funds remain available to states until they are spent. Thus, one of the more difficult spending decisions facing a state is whether to set aside — to cover potential future cost increases in a recession — federal TANF funds that could otherwise be used to serve families with immediate needs.
In the first few years of TANF implementation, as states adjusted to rapid cash assistance caseload declines and enhanced flexibility regarding how TANF funds could be used, states accumulated reserves of unspent TANF funds. Each year, as states have spent increasing proportions of their TANF grants, smaller amounts have been added to those reserves. In federal fiscal year 2001, reserves of unspent TANF funds diminished for the first time as states drew on those reserves to support their TANF programs.
The point of examining funds that remain unspent is not to suggest that all funds should have been spent, but rather to illustrate the variety of spending decisions that have been made by states. There is a range of reasonable policy options a state may choose in allocating resources between meeting current needs and reserving them for potential future needs. Of concern, however, is the substantial state variation in the level of reserves. Many states would not be able to absorb even modest increases in costs associated with a recession, while the very large balances of a few states suggest that these states could have devoted substantial additional resources to welfare reform efforts and still have adequate funds to address increased costs associated with a recession.
Unspent funds are reported to the federal government in two categories — unobligated balances and unliquidated obligations. To get a full picture of TANF spending it is helpful to consider both unobligated balances and unliquidated obligations. Unspent TANF funds in both categories are held in the federal treasury, and are not considered spent until they have actually been expended. As a result, unspent funds include funds that have been appropriated by state legislators, funds that have been set-aside in rainy day funds, and funds that have been committed to service contracts, as well as funds for which no plans have been made.
Unobligated funds may have been appropriated or designated for a specific purpose, but they have not been obligated through a contract. Funds that have been set aside in a rainy day fund would be reported in this category. Under federal cash management policies, TANF block grant funds are transferred to states only as reimbursement for actual expenditures on TANF programs. Because establishment of a rainy day fund does not entail an expenditure on benefits and services, such funds remain in the federal treasury and are classified as unobligated TANF funds until the state taps into the reserve fund.
Unobligated balances of TANF funds from prior years may only be spent on "assistance" or on the related administrative costs of providing assistance.(15) Assistance means services or benefits designed to meet a family's ongoing basic needs — like food, clothing, or shelter — the receipt of which assistance triggers time limits and other TANF requirements; other spending is considered "non-assistance."(16) States can retain flexibility by using unobligated funds from prior years to provide cash assistance while using their current-year TANF allocation for non-assistance services and benefits.
Table 9 identifies the level of unobligated federal TANF funds in each state as of September 30, 2001, the end of federal fiscal year 2001. The first column identifies amounts that remain unobligated from each state's TANF allocations for fiscal years 1997 through 2001.
Example: As of September 30, 2001, Alaska had $4.4 million in unobligated TANF funds. This amount reflects TANF funds from any TANF grant Alaska received that remain unobligated at the end of fiscal year 2001.
Although states have made a wide range of policy choices regarding the amount of TANF funds to save for an economic downturn versus how much to spend to address current needs, in general reserves are not excessive. The $2.56 billion in reserves across the states is comparable to less than two months of federal spending on TANF programs at the 2001 spending level. Thirteen states have obligated all the federal funds they have received. Half the states have reserves comparable to one to six months of spending at the fiscal year 2001 level; only two states have reserves exceeding a year's worth of current spending.

Unliquidated obligations are funds that have been obligated to be spent in a specific way at a later time, usually through a contract.(17) For example, this category would include funds a state has contracted to pay a private service provider, such as a child care agency, but has not yet paid out because the service has not yet been provided or payment has not yet been processed. This category should not include funds that have been transferred from the TANF state agency to another state agency, if those funds have not yet been obligated by the recipient agency. In contrast, a state may count funds that it has distributed in grants to counties as unliquidated obligations even if the county has not yet obligated the funds. As a result, in some states funds remain unobligated at the local level and policy makers may have the opportunity to re-direct some of those funds to help low-income families.
If a state obligates funds for use on non-assistance, the state has until the end of the following fiscal year to spend those obligated funds on non-assistance. For example, a state that obligated $1 million for transportation subsidies for working families in the 2001 fiscal year could spend those funds on such non-assistance transportation subsidies either in fiscal year 2001 or 2002. If the state had not obligated those funds, the same $1 million could not be spent on such non-assistance transportation subsidies in fiscal year 2002. This spending rule may create an incentive for states to obligate current-year TANF funds for non-assistance uses in order to facilitate such spending in the following year. If the state does not spend the obligated funds by the end of the following fiscal year, the funds (like any other unobligated prior-year funds) could be spent only on assistance, and there is no further penalty on the state.
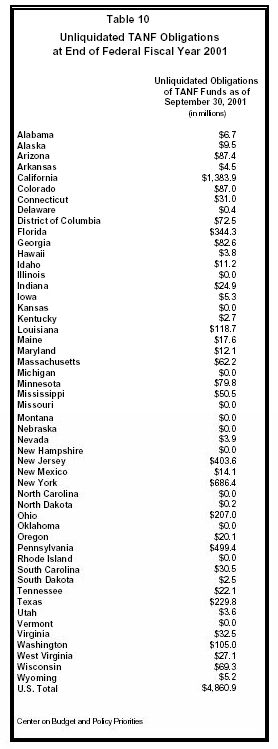
Table 9 identifies the unliquidated TANF obligations in each state as of September 30, 2001.
Example: At the end of federal fiscal year 2001, South Carolina reported $30.5 million in federal TANF funds as unliquidated obligations. This amount reflects funds that are available to the state from any TANF grant and that had been obligated, but not liquidated, by the end of fiscal year 2001.
Again, a wide range of policy choices is reflected in state levels of unliquidated obligations. In only seven states do unliquidated obligations exceed ten percent of the federal funds they have received since TANF began. In 31 states unliquidated obligations are less than five percent of the federal funds they have received since TANF began.
Each state is required to report quarterly to the U.S. Department of Health and Human Services on its expenditures of TANF funds, using the "ACF-196" federal reporting form. The reports show the extent to which states transferred TANF funds to CCDF and SSBG, expenditures states made from their own MOE funds, and the amount of TANF funds that remain unobligated or unliquidated. These reports also identify expenditures of TANF and MOE funds by major category — assistance and non-assistance — and also by more specific uses of the funds, such as education and training, child care, or transportation.
The ACF-196 reports for the fiscal year ending on September 30, 2001 were collected between November 2001 and March 2002 by the Center on Budget and Policy Priorities from the state agencies responsible for preparing the ACF-196 reports — typically the budget, accounting, or federal reporting division of the state's welfare agency. These data have not been verified by the U.S. Department of Health and Human Services and thus should be considered preliminary. In addition, some states may have revised their ACF-196 reports since the time they were obtained for this analysis. Analyses involving spending for fiscal years 1997 through 1999 are based on data that HHS has made available.(18) Grant amounts for all fiscal years are based on HHS data. All other data is based on ACF-196 reports collected and analyzed by the Center on Budget and Policy Priorities.(19) The tables in this paper use rounding, and therefore rows and columns do not always appear to add to the total amount shown.
TANF expenditure data for fiscal year 2001 illustrates that the spending trends that have developed since TANF was implemented in 1997 continued during the last year — states used more federal funds than in any prior year, the portion of spending devoted to cash assistance decreased, and resources devoted to child care and other supports for working families increased. For the first time, states used more federal funds than they received, drawing on unspent funds from prior years to support their TANF programs. Taken together these trends suggest that in fiscal year 2001 states continued to make use of the flexibility provided in the TANF block grant funding structure to not only serve families with barriers to employment but also to provide a range of benefits and services to low-income working families.

End Notes:
1. See text box on page seven for a more detailed comparison of these two types of TANF spending data.
2. In this paper the term "annual TANF grant" is used to mean a state's State Family Assistance Grant, minus any tribal allocation, plus any Supplemental Grant it received, but does not include performance bonuses.
3. Some tribes also receive funds for tribal-administered TANF programs, which are deducted from their states' State Family Assistance Grants and reduce the state's maintenance of effort requirement.
4. The 1996 welfare law only authorized Supplemental Grants through fiscal year 2001. The Job Creation and Worker Assistance Act of 2002, enacted on March 9, 2002, extended the Supplemental Grants through fiscal year 2002 at the fiscal year 2001 level of $319 million. See §616 of Pub. L. No. 107-147 (formerly H.R. 3090).
5. These bonus awards generally are not included in the annual TANF grants used for calculations in this paper because states cannot anticipate receiving them and therefore cannot plan in advance for their use.
6. This year, as in previous years, some states initially reported MOE spending levels that are insufficient to meet their requirement. States, however, are permitted to revise their spending reports and are likely to identify additional allowable MOE spending that was not originally reported.
7. See Zoë Neuberger, TANF Expenditures Increased in the Last Fiscal Year, Center on Budget and Policy Priorities, November 1, 2001, https://www.cbpp.org/11-1-01wel.pdf.
8. Federal law enacted in 1999 would have limited transfers to SSBG to 4.25 percent of a state's TANF allocation starting in fiscal year 2000, but federal appropriations legislation for fiscal years 2000, 2001, and 2002 allowed the SSBG transfer limit to remain at 10 percent of the TANF grant.
9. If funds transferred to CCDF are not obligated within two years, they may be returned to TANF as unobligated funds from the original grant year. If funds are neither obligated nor returned within two years, or are not expended within three years, they revert to the U.S. Treasury. If funds transferred to SSBG are not expended by the end of the year subsequent to the fiscal year in which they were transferred, they may be returned to TANF as unobligated funds from the original grant year. If funds are neither expended nor returned within two years they revert to the U.S. Treasury.
10. For a more detailed discussion of the implications of this issue, see the text box on page seven.
11. See 45 C.F.R. §260.31.
12. See Mark Greenberg, Elise Richer, and Vani Sankarapandian, Welfare Caseloads Are Up In Most States, Center for Law and Social Policy, December 2001, http://www.clasp.org/pubs/TANF/ FY01%20Caseload%20discussion.htm.
13. For a more detailed discussion of issues related to TANF MOE spending on child care see Rachel Schumacher, Mark Greenberg, and Janellen Duffy, The Impact of TANF Funding on State Child Care Subsidy Programs, Center for Law and Social Policy, September 2001, pages 33-34, http://www.clasp.org/pubs/childcare/ TANFChildCareFullReport.pdf.
14. States are permitted to adjust reporting for prior fiscal years in subsequent TANF spending reports. These data on transfers to CCDF in fiscal year 2000 are based on TANF spending reports as of September 30, 2001. Different data sources were relied upon for other recently published analyses of fiscal year 2000 TANF transfers to CCDF, such as Rachel Schumacher, Mark Greenberg, and Janellen Duffy, The Impact of TANF Funding on State Child Care Subsidy Programs, Center for Law and Social Policy, September 2001, http://www.clasp.org/pubs/ childcare/TANFChildCareFullReport.pdf and Melinda Gish, Child Care: Funding and Spending Under Federal Block Grants, Congressional Research Service, February 11, 2002.
15. See 64 Fed. Reg. 17840-41 (April 12, 1999).
16. See discussion of assistance and non-assistance on page 15.
17. HHS regulations, which are referenced in the instructions for completing the unliquidated obligations line of the ACF-196, define obligations as "the amounts of orders placed, contracts and subgrants awarded, goods and services received, and similar transactions during a given period that will require payment by the grantee during the same or a future period." 45 C.F.R. § 92.3.
18. See http://www.acf.dhhs.gov/programs/ofs/data/index.html.
19. Although HHS has made available data for fiscal year 2000, it is inconsistent with prior year data and with data collected by the Center on Budget and Policy Priorities. HHS is in the process of revising this data and aims to publish more accurate data in April 2002. Therefore this paper relies on data for fiscal year 2000 collected and analyzed by the Center on Budget and Policy Priorities.