
ARE TAXES TOO CONCENTRATED AT THE TOP?
Rapidly Rising Incomes at the Top Lie
Behind
Increase in Share of Taxes Paid By High-Income Taxpayers
by
Joel Friedman and
Isaac Shapiro
| PDF of this report |
| If you cannot access the files through the links, right-click on the underlined text, click "Save Link As," download to your directory, and open the document in Adobe Acrobat Reader. |
A recent editorial in the Wall Street Journal and Administration comments reported in the Washington Post suggest that those with the highest incomes are now bearing a larger share of the tax burden, and that as a consequence it would make sense to cut the taxes of this group and shift more of the tax burden onto those with lower incomes.[1] Yet these statements ignore the fundamental reason behind the larger share of taxes paid by those with the highest incomes. This has resulted primarily because there has been a sharp increase in the concentration of the nation’s income among this high-income group, with this concentration of income reaching historically high levels.
- Newly released data from the Internal Revenue Service show that 21 percent of the nation’s before-tax income flowed to the top one percent of the income spectrum in 2000, up from 14 percent a decade ago, and that 35 percent flowed to the top five percent, up from 28 percent.[2] In 2000, the IRS stated that the average income of the top one percent exceeded $1 million.
- A recent study by the National Bureau of Economic Research (NBER) found that in 1998, the latest data available at the time of the study, the top one percent received a larger share of the nation’s before-tax income than at any time since 1936.[3]
- Analyses by the Congressional Budget Office and Citizens for Tax Justice show that the share of all federal taxes paid by the top one percent is only moderately higher — about seven percentage points higher — than their share of the national income.
- Despite the fact that those at the top of the income spectrum pay a larger share of federal taxes than in the past, their after-tax incomes have grown more rapidly than any other group. According to CBO, the average after-tax income of the top one percent grew by 157 percent, or $414,000, between 1979 and 1997, after adjusting for inflation. By contrast, average after-tax income rose just 10 percent for households in the middle of the income spectrum.
- Finally, all of the aforementioned studies take account only of federal taxes. Yet taxes are also levied by state and local governments, and many of those taxes — such as sales and excise taxes — place a greater burden on low- and middle-income families than on upper-income families. When all taxes — including state and local taxes — are taken into account, the overall tax system becomes less progressive.
Before-Tax Incomes Rise Rapidly for Top of the Income Spectrum
The new IRS data show that the incomes of those at the top of the income spectrum grew much more rapidly than the incomes of any other income group over the past decade.
- Between 1989 and 2000, the average before-tax income of the top one percent grew by 78 percent after adjusting for inflation — with their average income exceeding $1 million in 2000. The income of the next highest four percent grew by 29 percent.[4]
- The average income of the remaining 95 percent of tax filers, on the other hand, grew only nine percent over the period.
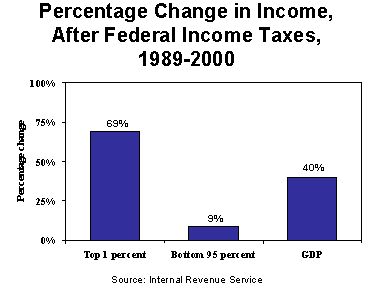
- By comparison, the economy as a whole grew by 40 percent over this period.
Given the growth in the income received by those at the top of the income spectrum, it is not surprising that this group is paying a larger share of federal taxes. Since they receive a larger percentage of the national income than in the past, they pay a larger percentage of taxes.
After-Tax Incomes Also Rise
More for Those at the Top
The after-tax incomes of those at the top of the income spectrum also have grown much more rapidly than the after-tax incomes of other segments of the population.
- IRS data show that the average income, after federal income taxes are subtracted, of the top one percent of tax filers grew by 69 percent between 1989 and 2000, after adjustment for inflation. After-tax income grew 26 percent among the next highest four percent of tax filers.
- The after-tax incomes of the remaining 95 percent of tax filers grew an average of nine percent over the same period.
- Even when looking at income after income taxes, those at the top of the income spectrum have outdistanced everyone else in recent years. They receive a larger share of the income that remains after federal income taxes are paid than they did in the past.
|
Share of Income vs. Share of Taxes The statements in the
Wall Street Journal and the Washington Post suggest that those
with the highest incomes pay a grossly disproportionate share of taxes.
Yet an examination of Congressional Budget Office data on incomes and
federal taxes — which are considered the most comprehensive data available
— yields a different conclusion. In 1997, the latest year for which data
were available for the CBO study, the top one percent received nearly 16
percent of the nation’s income and paid 23 percent of all federal taxes
(including income taxes, payroll taxes, corporate taxes, and excise taxes)
— a difference of 7 percentage points. This implies that the overall
system of federal taxes is progressive, but only moderately so. A new
analysis by the Citizens for Tax Justice similarly found that the
difference between the top one percent’s income and its share of all
federal taxes amounted to about seven percentage points in 2001.
Furthermore, the CTJ analysis estimates that by 2010, when all of the tax
cuts enacted last year are scheduled to be in effect, this gap will narrow
to about five percentage points.* Finally, these data cover only federal
taxes. When state and local taxes are taken into account, the gap narrows
further. |
These trends also are confirmed when all federal taxes — rather than just federal income taxes — are taken into account. Last year, the Congressional Budget Office published an exhaustive analysis of federal tax and income trends, with data through 1997.[5] The CBO analysis found that the top one percent of the population experienced extraordinary after-tax income gains that vastly exceed the gains in after-tax income that the rest of the population secured. The CBO data demonstrate that the increase in the percentage of federal taxes that high-income households pay has not squeezed these households.
- From 1979 to 1997, the average after-tax income of the richest one percent of households climbed a remarkable 157 percent, or $414,000, after adjusting for inflation.
- By comparison, among the middle fifth of households, average after-tax income rose a far more modest 10 percent, or $3,400.
- Among the bottom fifth of household, after-tax income was stagnant.
The CBO data also show that the share of the after-tax national income the top one percent of households received in the late 1990s was at the highest level on record. (These CBO data go back to 1979.) When these CBO data are combined with data from the NBER study, it appears that the top one percent of the population is now receiving a larger share of the national after-tax income than at any time since at least 1941.
Taxes As a Share of Income Not at Peak
CBO also found that the percentage of income that the highest-income households pay in federal taxes is not at a recent peak and is lower than in a number of previous years. At the time that CBO issued its report on tax rates and tax burdens, the data that CBO uses on household incomes were not yet available for years after 1997. CBO did have information, however, on federal tax law in 2000, and applied 2000 tax law to 1997 income levels.
- CBO estimated that, on average, the top one percent of households paid 32.7 percent of their income in federal taxes overall, including income, payroll, excise and other taxes.
- This percentage is lower than the percentage of income that CBO found the top one percent of households paid throughout most of the rest of the 1990s as well as in the late 1970s. For example, the top one percent of households paid 37.3 percent of income in federal taxes in 1979, the first year for which these CBO data are available, and 36.4 percent of income in federal taxes in 1995. In short, the percentage of income that very high-income households pay in federal taxes has not jumped sharply in the past few years. (The top one percent did pay a lower percentage of income in federal income taxes in the 1980s, following enactment of large tax cuts in 1981. The years after 1981 were marked by large federal deficits and sharp increases in the national debt.)
Need to Look At All Taxes To Understand Full Tax Burden
Some have tried to argue that the federal tax burden on those with the highest incomes is overly burdensome by pointing to the share of federal income taxes paid by this group. Based on the aforementioned IRS data, the top one percent paid 37.4 percent of federal income taxes in 2000 and the top five percent paid 56.5 percent of the income taxes. Examining only the percentage of income taxes that the top one percent (or the top five percent) of the population pays, however, overstates the degree to which these individuals are shouldering the overall federal tax load. CBO found that the top one percent of households paid 23.0 percent of all federal taxes in 1997, including payroll, excise and other federal taxes; the top five percent paid 39.1 percent of total federal taxes. This is substantially lower than the percentage of federal income taxes that these groups pay; the differences reflect, in large part, the impact of the payroll tax, which falls more heavily on lower- and middle-income households than income taxes do. The top one percent of the population, for instance, pays only 4.2 percent of the payroll taxes.
The Washington Post story also reported that some Administration officials are suggesting that payroll taxes be excluded from tax burden calculations. To exclude these taxes from a distributional analysis would reflect a dramatic departure from accepted practice. Although payroll taxes are dedicated to particular programs, such as Social Security, Medicare, and unemployment insurance, all of the official institutions that measure tax burdens — the Treasury Department, the Congressional Budget Office, and the Joint Committee on Taxation — have always included these taxes as part of their estimates of federal tax burdens. Ignoring certain taxes because of their link to spending would significantly distort any tax analysis. As conservative economist William Beach of the Heritage Foundation noted in the Post story, "Do I allow defense spending to offset my income taxes since I like to be defended? Do I allow road taxes to offset my profits taxes because I use the roads? If you start down that road, it’s hard to see anything as taxes."[6]
Finally, all of these analyses take into account only the federal tax burden. Taxes are paid to all levels of government — federal, state, and local. State and local governments rely much more on regressive taxes, such as sales taxes and excises taxes (on cigarettes and alcohol, for instance). The burden of these taxes falls more heavily on those with lower incomes; that is, these taxes represent a larger share of the incomes of those with low and moderate incomes than of those with high incomes. Including the impact of state and local taxes in an overall assessment of the tax burdens on different income groups would more accurately reflect the relative tax burdens that different income groups face. As the nationally renowned tax expert Joseph Pechman showed nearly two decades ago, when state and local taxes are included, the gap between the percentage of the national income that high income individuals receive and the percentage of the taxes that they pay narrows further.
End Notes:
[1] See for instance, "The Non-Taxpaying Class," The Wall Street Journal, November 20, 2002, and Jonathan Weisman, "New Tax Plan May Bring Shift in Burden, Poor Could Pay A Bigger Share," The Washington Post, December 16, 2002.
[2] The IRS 2002 data are available at <http://www.house.gov/jec/press/2002/10-24-02.htm>.
[3] Thomas Piketty and Emmanuel Saez, "Income Inequality in the United States, 1918-1998," NBER Working Paer 8467, September 2001, Tables A1 and A3.
[4] The incomes of the top five percent — the top one percent plus the next highest four percent — grew by 54 percent between 1989 and 2000.
[5] Congressional Budget Office, "Effective Federal Tax Rates, 1979-1997," October 2001.
[6] Jonathan Weisman, "New Tax Plan May Bring Shift in Burden, Poor Could Pay A Bigger Share," The Washington Post, December 16, 2002.