Unkept Promises: State Cuts to Higher Education Threaten Access and Equity
A decade since the Great Recession hit, state spending on public colleges and universities remains well below historical levels. Overall state funding for public two- and four-year colleges in the school year ending in 2018 was more than $7 billion below its 2008 level, after adjusting for inflation. (See Figure 1.) In the most difficult years after the recession, colleges responded to significant funding cuts by increasing tuition, reducing faculty, limiting course offerings, and in some cases closing campuses. Overall state funding for public two- and four-year colleges in the school year ending in 2018 was more than $7 billion below its 2008 level.Funding has rebounded slightly since then, but costs remain high and services in some places have not returned.
The promise to past generations of students in America has been that if you work hard and strive, public colleges and universities will serve as an avenue to greater economic opportunity and upward mobility. For today’s students — a cohort more racially and economically diverse than any before it — that promise is fading.
Rising tuition threatens affordability and access leaving students and their families –– including those whose annual wages have stagnated or fallen over recent decades — either saddled with onerous debt or unable to afford college altogether. This is especially true for students of color (who have historically faced large barriers to attending college), low-income students, and students from non-traditional backgrounds. Higher costs jeopardize not only the prospects of those individual students but also the outlook for whole communities and states, which are increasingly reliant on highly educated workforces to grow and thrive.
To build a prosperous economy — one in which the benefits of higher education are broadly shared and felt by every community regardless of race or class — lawmakers will need to invest in high-quality, affordable, and accessible public higher education by increasing funding for public two- and four-year colleges and by pursuing policies that allow more students to pursue affordable postsecondary education. By doing so, they can help build a stronger middle class and develop the entrepreneurs and skilled workers a strong state economy needs.
Of the 49 states (all except Illinois)[1] analyzed over the full 2008-2018 period, after adjusting for inflation:[2]
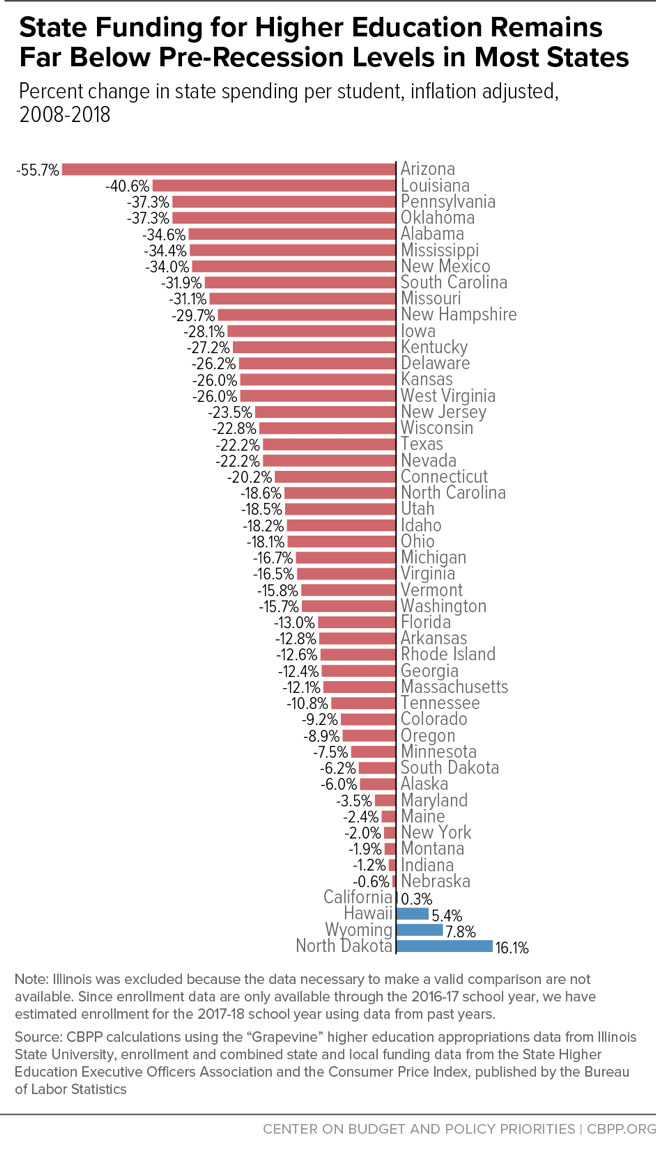
- 45 spent less per student in the 2018 school year than in 2008. The only states spending more than in 2008 were California, Hawaii, North Dakota, and Wyoming.
- States cut funding deeply after the recession hit. The average state spent $1,502, or 16 percent, less per student in 2018 than in 2008.
- Per-student funding in nine states — Alabama, Arizona, Louisiana, Mississippi, Missouri, New Mexico, Oklahoma, Pennsylvania, and South Carolina — fell by more than 30 percent over this period.
- In 31 states, per-student funding fell between the 2017 and 2018 school years. In 15 of these states, funding also fell the previous year.
- In 18 states, per-student funding rose between the 2017 and 2018 school years.
- Overall, per-student funding essentially remained flat between 2017 and 2018.[3]
Deep state funding cuts have had major consequences for public colleges and universities. States (and, to a lesser extent, localities) provide just over half of the costs of teaching and instruction at these schools.[4] Over the last decade, higher education institutions have:
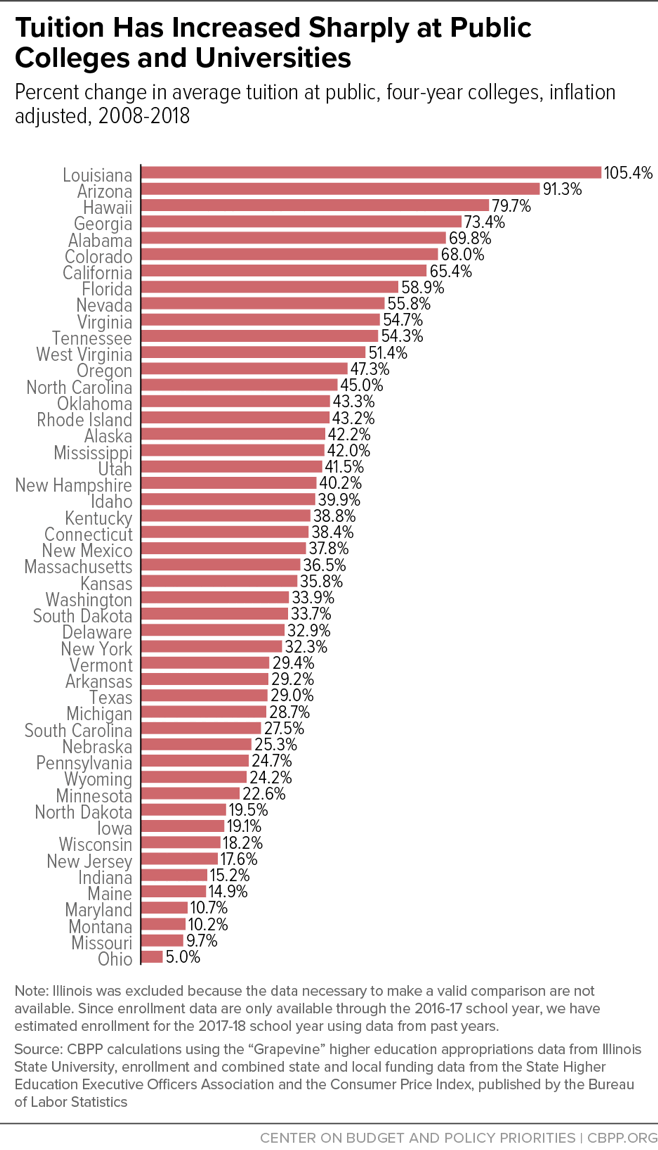
- Raised tuition. Annual published tuition at four-year public colleges has risen by $2,651, or 36 percent, since the 2008 school year.[5] In Louisiana, published tuition at four-year schools has doubled, while in six other states — Alabama, Arizona, California, Colorado, Georgia, and Hawaii — published tuition is up more than 60 percent.
These sharp tuition increases have accelerated longer-term trends of college becoming less affordable and costs shifting from states to students. Over the last 20 years, the price of attending a four-year public college or university has grown significantly faster than the median income. Although federal student aid has risen, on average it has fallen short of covering the increases in tuition and other college expenses.
- Reduced academic opportunities and student services. Tuition increases have compensated for only part of the revenue loss resulting from state funding cuts. Over the past several years, public colleges and universities have cut faculty positions, eliminated course offerings, closed campuses, and reduced student services, among other cuts.
A large and growing share of future jobs will require college-educated workers.[6] Sufficient public investment in higher education to keep quality high and tuition affordable, and to provide financial aid to students who need it most, would help states develop the skilled and diverse workforce they will need to compete for these jobs.
Sufficient public investment can only occur, however, if policymakers make sound tax and budget decisions. To make college more affordable and increase access to higher education, many states need to consider new revenue to fully make up for years of cuts.
States Have Only Partially Reversed Funding Cuts
State and local tax revenue is a major source of support for public colleges and universities. Unlike private institutions, which rely more heavily on charitable donations and large endowments to help fund instruction, public two- and four-year colleges typically rely heavily on state and local appropriations. In 2017, state and local dollars constituted 54 percent of the funds these institutions used directly for teaching and instruction.[7]
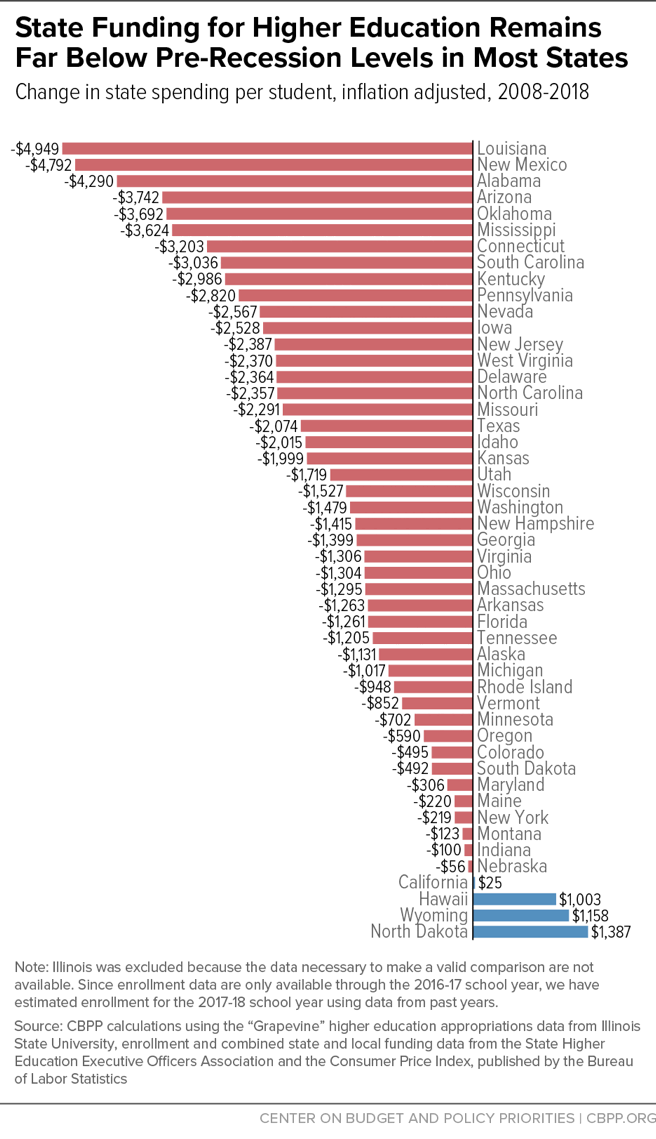
While states have been reinvesting in higher education for the past few years, resources remain well below 2008 levels — 16 percent lower per student — even as state revenues have returned to pre-recession levels. (See Figures 1 and 2.) Between the 2008 school year (when the recession took hold) and the 2018 school year, adjusted for inflation:
- State spending on higher education at two- and four-year public colleges nationwide fell $1,409 per student, or 16 percent, after adjusting for inflation.
- Per-student funding rose in only four states: California, Hawaii, North Dakota, and Wyoming.
- Twenty states cut funding per student by more than 20 percent, and in nine of those states the cut exceeded 30 percent.
- Arizona cut per-student funding by more than half.[8]
Nationally, between the 2017 and 2018 school years, per-student funding remained virtually unchanged in the 49 states where reliable data were available. However, in 18 states per-student funding increased, by 3.4 percent or almost $270 per student, on average.
- The funding increases varied from $5 per student in Michigan to $970 in Hawaii.
- Four states raised per-student funding by more than 5 percent.
In 31 states, per-student funding fell between 2017 and 2018, by 2.6 percent or roughly $200 per student, on average. And among the 18 states where funding rose, eight states’ funding increases between 2017 and 2018 were lower than their average increase over the previous three years.
- The funding cuts varied from $16 per student in New York to $1,939 in North Dakota.
- Four states — Alaska, Mississippi, North Dakota, and Wyoming — cut funding by more than $500 per student.
- Fifteen states cut per-student funding in both 2017 and 2018.
State Cuts Have Helped Drive Up Tuition
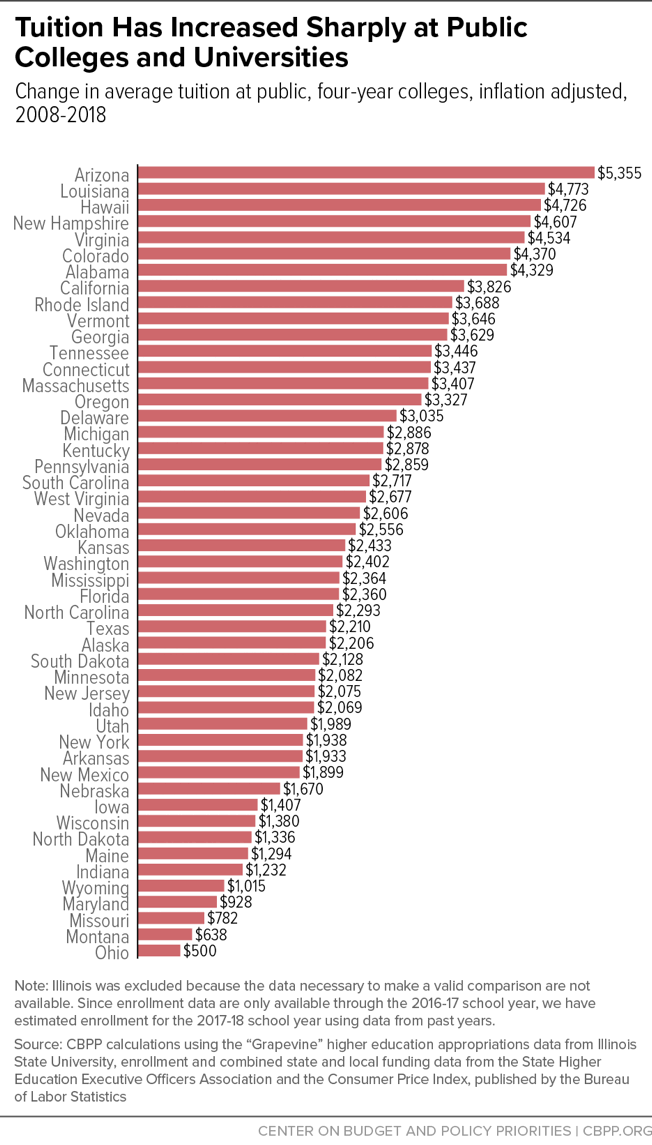
Tuition remains much higher than before the recession in most states. Since the 2008 school year, average annual published tuition has risen by $2,651 nationally, or 36 percent.[9] (See Figures 3 and 4.) Steep increases have been widespread; average tuition at public four-year institutions has increased by:
- more than 60 percent in seven states;
- more than 40 percent in 20 states; and
- more than 20 percent in 40 states.
In Louisiana, the state with the largest percentage increase since the recession hit, tuition has doubled, rising $4,773 per student since 2008. Average tuition at a four-year Louisiana public university is now $9,302 a year.[10]
In Arizona, the state with the largest dollar increase since the recession hit, tuition has risen $5,355 per student, or 91.3 percent. Average tuition at a four-year Arizona public university is now $11,218 a year.[11]
In recent years, as states have modestly increased investment in two- and four-year colleges from their recession lows, tuition hikes have been much smaller than in the worst years after the recession.[12] Published tuition — the “sticker price” — at public four-year institutions rose by less than 1 percent nationally between the 2017 and 2018 school years:
- Average tuition nationally increased $94, or almost 1 percent, adjusted for inflation.[13]
- Montana increased average tuition across its four-year institutions more than any other state, by more than 5 percent, or roughly $339. Mississippi, Oregon, and Rhode Island raised average tuition by more than 4 percent.
- Rhode Island increased average tuition across its four-year institutions on a dollar basis more than any other state, by $559, or roughly 4.8 percent. Connecticut, Iowa, Mississippi, Montana, and Oregon raised average tuition by more than $300.
- Hawaii cut tuition more than any other state, by 2 percent, or $220.[14]
Reduced Investment Comes as Public Colleges Enrolling More Students of Color
Many states closed revenue shortfalls after the recession and its subsequent sluggish recovery through sizeable budget cuts, as opposed to pursuing a more balanced mix of responsible and targeted cuts and revenue increases. In fact, between fiscal years 2008 and 2012, for every $1 state lawmakers raised in new revenue they cut $3 from existing spending. This led to exceedingly deep cuts to higher education — which contributed to higher-than-typical tuition increases, described above — that might have been avoided if lawmakers had pursued a more balanced approach.
For high school graduates who chose college over dim employment prospects and older workers who returned to retool and gain new skills, these cuts and tuition increases came at an especially bad time.[15] Enrollment peaked in the 2011 school year with nearly 11.7 million full-time-equivalent students even as states slashed higher education budgets.
The state funding cuts and rising tuition that followed the last recession fit into a longer-term trend in place since the 1980s. Over time, students and their families have assumed much greater responsibility for paying for public higher education. That’s because during and immediately following recessions, state and local funding for higher education tends to fall, while tuition tends to grow more quickly. During periods of economic growth, funding tends to recover somewhat, while tuition stabilizes at a higher share of total higher educational funding.[16] (See Figure 5.)
In 1988, students — through tuition — provided about a quarter of public colleges and universities’ revenue, while state and local governments provided the remaining three-quarters. Today, that split is almost 50-50.
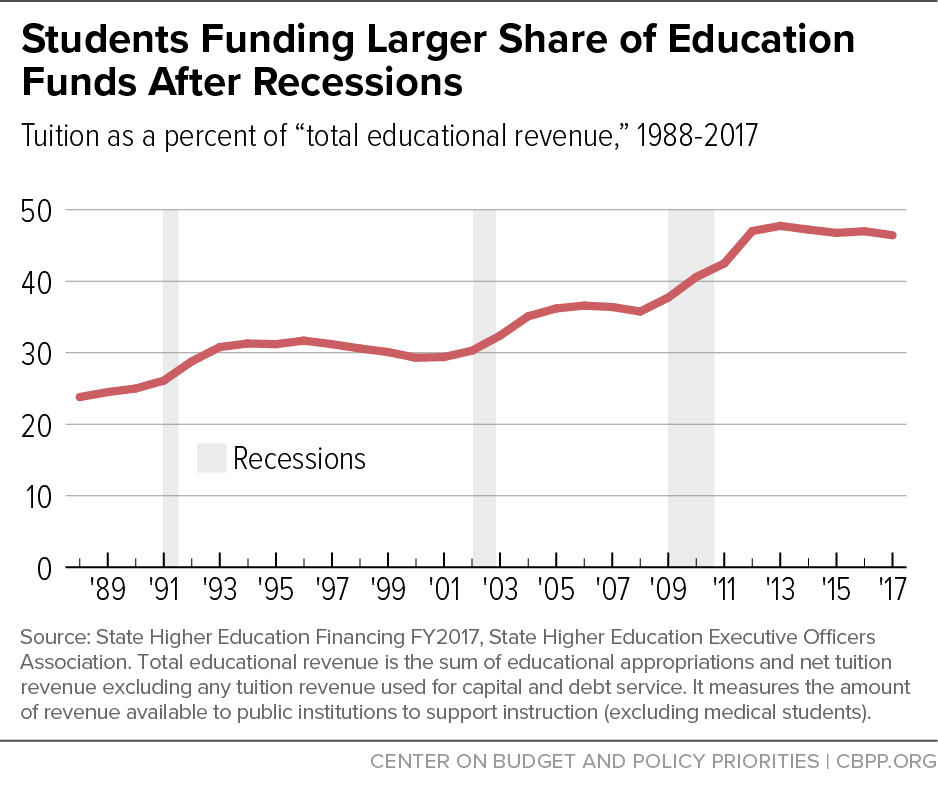
Nearly every state has shifted costs to students over the last 25 years, with the most drastic shift occurring since the onset of the Great Recession. In 1988, average tuition exceeded per-student state expenditures in only two states: New Hampshire and Vermont. By 2008, that number had grown to ten states. In 2017 (the latest year for which there are data), tuition revenue exceeded state and local funding for higher education in 28 states. And in 15 states, tuition revenue constituted at least 60 percent of higher education revenue used for instructional purposes.[17]
At the same time, this growing burden on students and families coincided with a multi-decade increase in the number of students from communities of color attending college. In 1980, students of color — that is black, Hispanic/Latino, Asian, Pacific Islander, and American Indian students — made up roughly 17 percent of students at public colleges. By 2010, that number had more than doubled to over 36 percent, and today over 40 percent of students attending public two- and four- year colleges are students of color.[18]
This long-term decline in state funding and growing expectation that students and families shoulder a greater load for college education has created a more costly and fraught path to completing college — a path that a more diverse group of students is now navigating.
Families Have Been Hard-Pressed to Absorb Rising Tuition Costs
The cost shift from states to students has happened over a period when many families have had trouble absorbing additional expenses due to stagnant or declining incomes. In the 1970s and early to mid-1980s, tuition and incomes both grew modestly faster than inflation; by the late 1980s, tuition began to rise much faster than incomes. The sharp tuition increases since the recession have exacerbated the longer-term trend. Tuition jumped 36 percent between the 2008 and 2018 school years, while real median income grew just over 2.1 percent.
In 2008, when the recession took hold, average in-state tuition and fees at a public four-year institution accounted for 14 percent of a family’s median household income. By 2017 they accounted for 16.5 percent, and in eight states, average annual tuition and fees at a public four-year university accounted for over 20 percent of a household’s median pay. The burden of college costs is particularly heavy for households of color, whose members often face additional barriers to employment and difficulty accessing better-paying jobs. The average cost of in-state tuition and fees comprised 20 percent or more of the median household income in 2017 for Hispanic and black households in 22 states and 33 states, respectively.
| TABLE 1 | |||||
|---|---|---|---|---|---|
| Average Tuition and Fees at a Public Four-Year University as a Share of Median Household Income, by Race, 2017 | |||||
| State | Overall | White, Non-Hispanic | Black | Hispanic | Asian |
| Alabama | 21.0% | 18.0% | 32.2%* | 26.8%* | 14.1%* |
| Alaska | 9.7% | 8.7% | 11.1%* | 10.4%* | |
| Arizona | 19.3% | 17.5% | 24.4%* | 23.3%* | 14.4%* |
| Arkansas | 18.0% | 16.5% | 27.0%* | 20.1%* | |
| California | 13.0% | 11.1% | 19.2%* | 16.6%* | 10.2%* |
| Colorado | 14.9% | 13.7% | 20.0%* | 20.0%* | 12.9% |
| Connecticut | 15.9% | 13.8% | 25.3%* | 25.4%* | 13.6% |
| Delaware | 19.0% | 17.2% | 26.5%* | 12.1%* | |
| Florida | 12.1% | 10.9% | 15.8%* | 13.4%* | 9.1%* |
| Georgia | 15.0% | 12.9% | 19.7%* | 18.2%* | 10.9%* |
| Hawaii | 13.7% | 13.7% | 14.6% | 12.8%* | |
| Idaho | 13.4% | 13.1% | 15.5%* | ||
| Illinois | 21.3% | 19.0% | 36.6%* | 25.3%* | 15.9%* |
| Indiana | 17.1% | 16.1% | 27.7%* | 19.8%* | 13.7%* |
| Iowa | 14.1% | 13.7% | 26.8%* | 17.8%* | 12.4%* |
| Kansas | 15.8% | 14.8% | 24.7%* | 19.6%* | 12.7%* |
| Kentucky | 20.6% | 19.9% | 27.7%* | 23.7%* | 16.9%* |
| Louisiana | 19.4% | 15.6% | 31.7%* | 22.6%* | 14.1% |
| Maine | 17.2% | 17.0% | |||
| Maryland | 11.6% | 10.3% | 14.6%* | 13.1%* | 9.4%* |
| Massachusetts | 15.9% | 14.5% | 26.2%* | 29.3%* | 13.5%* |
| Michigan | 22.7% | 21.0% | 35.9%* | 27.0%* | 15.4%* |
| Minnesota | 16.1% | 15.3% | 28.9%* | 21.7%* | 14.7% |
| Mississippi | 17.2% | 13.6% | 25.6%* | 17.5%* | |
| Missouri | 16.1% | 15.1% | 24.8%* | 17.8%* | 13.5% |
| Montana | 12.0% | 11.8% | 13.0% | ||
| Nebraska | 13.2% | 12.5% | 22.1%* | 16.9%* | |
| Nevada | 11.9% | 11.0% | 17.3%* | 13.3%* | 10.8% |
| New Hampshire | 21.4% | 21.1% | 25.7%* | ||
| New Jersey | 16.9% | 14.8% | 26.9%* | 24.9%* | 11.4%* |
| New Mexico | 14.2% | 12.0% | 19.6%* | 16.5%* | |
| New York | 11.9% | 10.2% | 17.2%* | 16.5%* | 10.9%* |
| North Carolina | 13.6% | 11.9% | 18.8%* | 17.8%* | 9.0%* |
| North Dakota | 12.8% | 12.2% | 14.1%* | ||
| Ohio | 19.1% | 17.5% | 32.0%* | 25.2%* | 14.4%* |
| Oklahoma | 16.0% | 15.1% | 24.0%* | 18.4%* | 13.6% |
| Oregon | 16.2% | 15.8% | 26.3%* | 19.4%* | 12.6%* |
| Pennsylvania | 23.6% | 22.2% | 37.1%* | 34.9%* | 18.8%* |
| Rhode Island | 17.9% | 16.0% | 27.8%* | 16.3% | |
| South Carolina | 24.1% | 20.6% | 37.9%* | 30.0%* | 19.9% |
| South Dakota | 14.4% | 13.6% | 19.7%* | ||
| Tennessee | 18.6% | 17.4% | 25.0%* | 23.0%* | 13.7%* |
| Texas | 16.1% | 13.2% | 21.1%* | 20.4%* | 11.3%* |
| Utah | 9.6% | 9.1% | 13.8%* | 9.4% | |
| Vermont | 27.1% | 26.8% | |||
| Virginia | 17.3% | 15.9% | 24.9%* | 18.9%* | 12.2%* |
| Washington | 13.1% | 12.6% | 18.8%* | 17.8%* | 10.4%* |
| West Virginia | 17.2% | 16.8% | 24.9%* | ||
| Wisconsin | 15.1% | 14.3% | 30.4%* | 20.8%* | 12.9%* |
| Wyoming | 8.4% | 8.2% | 9.8%* | ||
Expanding Immigrant Students’ Access and Affordability
States can expand access and affordability for more students by improving immigrants’ access to higher education. Even as federal immigration policy is in turmoil, states can take an inclusive approach to in-state tuition and financial aid that will benefit all residents regardless of immigration status.
In Maryland and New Jersey, where eligible students who are undocumented could already pay in-state tuition rates at state colleges and universities, lawmakers in 2018 voted to let them apply for need-based state financial aid as well. Connecticut opened access to institutional financial aid to all students who are eligible to pay in-state tuition, including those who are undocumented, and lawmakers in Oregon and Washington strengthened existing laws enabling students to receive state financial aid or scholarships regardless of status. Meanwhile, Colorado this spring allowed refugees as well as Afghans and Iraqis who received special immigrant visas to qualify for in-state tuition rates immediately.
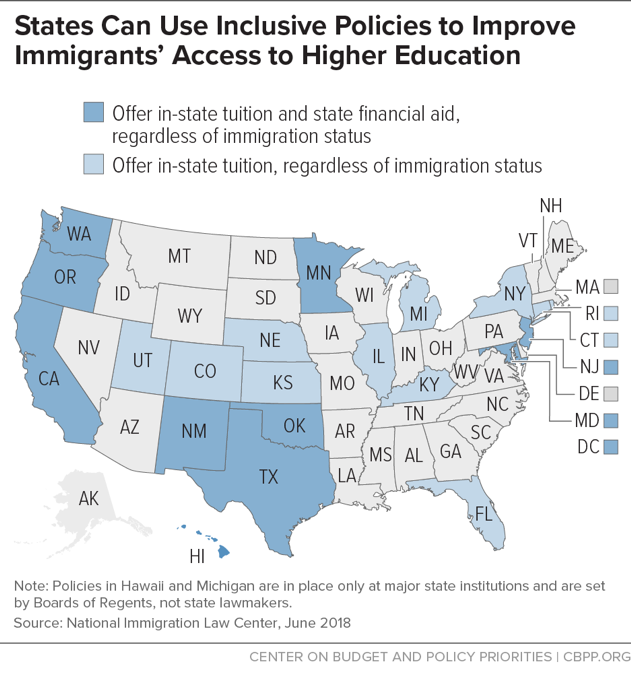
All told, undocumented students are now eligible for in-state tuition rates in 21 states plus the District of Columbia and have access to state financial aid in 11 states. (These counts include Hawaii and Michigan, where access to in-state rates and aid — extended by Boards of Regents rather than state lawmakers — is limited to major state universities.)
Undocumented families have lower average incomes than other families, and a college education — even at in-state tuition rates — is out of reach for many without financial assistance. Students who are undocumented don’t have access to Pell Grants and other federal aid — by far the largest pool of need-based financial aid available to other students.
States already guarantee all children, no matter their immigration status, a place in K-12 schools to help them reach their potential and develop the educated workers of tomorrow. Giving a state’s high school graduates access to higher education at in-state tuition rates, with access to financial aid, builds on this investment.
Cost Shift Harms Students and Families, Especially Those With Low Incomes
Higher tuition combined with weakly rising or stagnant incomes has damaging consequences for families, students, and communities.
- Tuition costs deter some students from enrolling in college. While the recession encouraged many students to enroll in higher education, the large tuition increases of the past few years may have prevented further enrollment gains. College price increases result in declining enrollment, research consistently finds.[19] While many universities and the federal government provide financial aid to students, research suggests that a high sticker price can dissuade students from enrolling even if the net price, including aid, doesn’t rise.
- Rising tuition may harm students of color and reduce campus diversity. While more students of color are enrolling in college, rising tuition and fees is a headwind to this trend as students of color are less likely to enroll as the cost of tuition goes up. In a recently published study, researchers found that tuition increases reduced campus diversity, particularly at non-selective institutions. For full-time freshmen enrolled at non-selective schools, a $1,000 increase in tuition costs was associated with a 4.5 percent drop in class diversity.[20] Another study that examined tuition policy changes in Texas in the early 2000s concluded that rising tuition limited enrollment gains for Hispanic students in the state.[21]
- Tuition increases likely deter low-income students, in particular, from enrolling. College cost increases have the biggest impact on students from low-income families, research shows. For example, a 1995 study by Harvard University researcher Thomas Kane concluded that states with the largest tuition increases during the 1980s and early 1990s “saw the greatest widening of the gaps in enrollment between high- and low-income youth.”[22] Low-income families’ relative lack of knowledge about the admissions and financial aid processes may exacerbate the problem. Students from families that struggle to get by — including those who live in communities with lower shares of college-educated adults and attend high schools that have higher student-to-counselor ratios — tend to overestimate the true cost of higher education more than students from wealthier households, in part because they are less aware of the financial aid for which they are eligible.[23]
These effects are particularly concerning because gaps in college enrollment between higher- and lower-income youth are already pronounced. In 2015, 63 percent of recent high school graduates from families with income in the lowest 20 percent enrolled in some form of postsecondary education, compared to over 83 percent of students from the top 20 percent.[24] Significant enrollment gaps based on income exist even among prospective students with similar academic records and test scores.[25] Rising costs at public colleges and universities may widen these gaps further.
- Tuition increases may push lower-income students toward less-selective public institutions, reducing their future earnings. Perhaps just as important as a student’s decision to enroll in higher education is the choice of which college to attend. A large share of high-achieving students from struggling families fail to apply to any selective colleges or universities, a 2013 Brookings Institution study found.[26] Even here, research indicates that financial constraints and concerns about costs push lower-income students to narrow their list of potential schools and ultimately enroll in less-selective institutions.[27] Another 2013 study found evidence that some high-achieving, low-income students are more likely to “undermatch” in their college choice, in part due to financial constraints.[28]
Where a student decides to go to college has broad economic implications, especially for economically disadvantaged students and students of color. Students with less-educated parents, as well as black and Hispanic students, benefit especially from attending more elite colleges by experiencing higher postgraduate earnings, a 2011 study by Princeton University and Mathematica Policy Research found.[29]
Low-Income Students Still Struggle With Debt
As tuition continues to increase, incomes remain stagnant or rise slowly, and federal and state financial aid fails to make up the difference — even for low-income students eligible for federal and state aid — debt burdens for students and their families continue to grow. Among students graduating with a bachelor’s degree in 2012, 79 percent of those from families with incomes in the bottom quarter had student loans, compared with 55 percent of those from families in the top income quarter.[30] In the same year, more than 80 percent of graduating black students borrowed at public institutions, compared with 64 percent of graduating students overall.[31]
The share of students graduating with debt has risen since the start of the recession. Between the 2008 and 2015 school years, the share of students graduating with debt from a public four-year institution rose from 55 percent to 59 percent. The average amount of debt incurred by a bachelor’s degree recipient with loans at a public four-year institution grew as well, to $27,000 from $21,226 (in 2016 dollars), an increase of 26 percent. By contrast, the average level of debt incurred rose only about 1 percent in the six years prior to the recession.[32]
In short, at public four-year institutions, more students are taking on larger amounts of debt. By the second quarter of 2018, student debt totaled $1.4 trillion — more than the United States population’s credit card or auto loan debt.[33]
Yet, while college loan burdens have increased significantly for students at public four-year institutions, the sizeable run-up in debt levels was driven in large part by a growing share of students attending private for-profit institutions — such as Corinthian and the University of Phoenix — and two-year community colleges. In 2000, borrowers entering repayment on student loans from for-profit and two-year institutions made up roughly 30 percent of all borrowers overall, a study from the U.S. Treasury Department and Stanford University researchers found. By 2011, that share had risen to nearly half. For-profit institutions were such a driving force that in 2014, eight of the top ten and 13 of the top 25 institutions whose students owed (collectively) the most in federal student loan debt were for-profit institutions. In 2000, only one for-profit made the top 25.[34]
Onerous debt burdens make it more difficult for students to reach economic stability, costing resources that could instead go towards paying rent, saving for emergencies, or investing in the future. High debt burdens have been especially damaging for black and Latino communities. One study, which followed first-time college entrants starting in 2004, found that over 37 percent of all black first-time college students across public, private non-profit, and for-profit institutions had defaulted on their student loans within 12 years. For Hispanic students, the default rate over the same period was 20 percent. For their white counterparts, the rate was just 12 percent. The same study projected default rates into the future and predicted that as many as 70 percent of black borrowers in the 2004 cohort would default on their loans by 2024.[35]
There can be significant consequences for defaulting on student loans. Defaults impact an individual’s credit rating — lowering credit scores and making it more difficult to get future loans, housing, and even jobs. Wages can be garnished to repay the defaulted loan and older borrowers may lose a portion of their Social Security payments.[36]
States Must Address Workforce Discrimination Against Graduates of Color
The economic benefits of receiving a postsecondary credential have been well-documented.aHowever, these benefits are not shared equally across people from different racial and ethnic backgrounds. Black and Hispanic college graduates still earn substantially less than their white peers, studies show.b
When studies have attempted to determine what contributes to these gaps beyond measured variables, racial discrimination is one significant factor that emerges — that is, consciously or otherwise, employers are devaluing the potential of qualified workers of color due to their race or ethnicity. A body of research has emerged to understand the impact discrimination plays in hiring and wages.
In one 2014 study, researchers created resumes of hypothetical applicants from elite, highly selective colleges and less-prestigious state schools. After submitting the resumes to over 1,000 job listings, researchers found that black job applicants who had graduated from highly prestigious private institutions received responses from employers at a rate nearly a third lower than their comparable white counterparts. In fact, white students who had attended significantly less prestigious state schools had about the same response rates from potential employers as did black students applying from elite institutions. Even more striking, the same study found that not only did black applicants receive lower response rates, but they also received job offers with lower starting salaries than those they offered to the applicants’ white peers.c
A 2010 study of salary negotiations found that employers expected applicants of color to negotiate less than their white peers and effectively penalized them when they attempted to negotiate, viewing applicants of color as being more “pushy” and, in turn, offering them lower initial salaries.d
Research also indicates that discrimination may not be declining over time. In a meta-analysis conducted in 2017, researchers analyzed 30 years of studies on hiring discrimination and concluded that — even after controlling for variables such as education, occupational type, and gender — “African Americans remain substantially disadvantaged relative to equally qualified whites, and we see little indication of progress over time.” While the studies analyzed did seem to indicate some decline in discrimination in hiring facing Latinx individuals, the improvement was modest at best, the report noted.e
For people of color who do attain college credentials to access the full benefit of these degrees, states will need to take steps to address workforce discrimination in hiring, wage-setting, and retention, including: (1) increasing the amount of information available to businesses, job seekers, and the public on the under- or overrepresentation of people of color in companies relative to the given sector at large and the state’s general working population;f (2) providing resources and tools for employers to help them analyze personnel policies, train hiring managers, and adjust organizational practices with an eye toward reducing discrimination; and (3) tightening state employment discrimination laws to protect workers from illegal practices and ensure that laws make it possible for workers to reasonably seek recourse.g
aJennifer Ma, Matea Pender, and Meredith Welch, “Education Pays 2016,” College Board, 2016, https://trends.collegeboard.org/sites/default/files/education-pays-2016-full-report.pdf.
b Valerie Wilson and William M. Rodgers, “Black-white wage gaps expand with rising wage inequality,” Economic Policy Institute, September 20, 2016, https://www.epi.org/publication/black-white-wage-gaps-expand-with-rising-wage-inequality/#epi-toc-7; Tomaz Cajner et al., “Racial Gaps in Labor Market Outcomes in the Last Four Decades and Over the Business Cycle,” Federal Reserve Board, June 12, 2017, https://www.federalreserve.gov/econres/feds/files/2017071pap.pdf.
c S. Michael Gaddis, “Discrimination in the Credential Society: An Audit Study of Race and College Selectivity in the Labor Market,” Social Forces, Vol. 93, Issue 4, June 1, 2015, pp. 1451–1479, https://doi.org/10.1093/sf/sou111.
d Morela Hernandez and Derek R. Avery, “Getting the Short End of the Stick: Racial Bias in Salary Negotiations,” MIT Sloan Management Review, June 15, 2016, https://sloanreview.mit.edu/article/getting-the-short-end-of-the-stick-racial-bias-in-salary-negotiations/ .
e Lincoln Quillian et al., “Meta-analysis of field experiments shows no change in racism discrimination in hiring over time,” Proceedings of the National Academy of Sciences, August 8, 2017, http://www.pnas.org/content/pnas/early/2017/09/11/1706255114.full.pdf.
f Philip Cohen, “A Simple, Legal Way to Help Stop Employment Discrimination,” The Atlantic, April 1, 2013, https://www.theatlantic.com/sexes/archive/2013/04/a-simple-legal-way-to-help-stop-employment-discrimination/274519/.
g Lisa Nagele-Piazza, “Not All State Employment Discrimination Laws Are Created Equal,” Society for Human Resource Management, September 15, 2017, https://www.shrm.org/resourcesandtools/legal-and-compliance/state-and-local-updates/pages/state-employment-discrimination-laws.aspx.
States Can Do More to Ensure College Affordability and Accessibility
Long-term cuts to per-student higher education funding threaten affordability, access, and quality at public two- and four-year colleges across the states. Not only should states direct additional resources into supporting public colleges and universities and reverse the long-term trend of disinvestment, but they can also implement smarter state financial aid policies and ensure that dollars go to the schools that need it most.
Craft State Financial Aid to Target Students in Need
In the 2015-2016 academic school year, state colleges and universities awarded students almost $10.7 billion in financial aid.[37] They awarded about 76 percent of those dollars at least partly based on need to students with low incomes who might otherwise struggle to afford the costs of attending college. They awarded the remaining 24 percent based on merit to high-achieving students (typically measured by high school GPA or college entry exam scores), regardless of household income.[38]
The primary purpose of need-based aid is to expand access to higher education. For low-income students, financial aid can make a significant difference in not only affording the cost of college but in being able to graduate. A $1,000 increase in a student’s financial aid corresponds to a 9.2-percentage-point decrease in the likelihood that a student will drop out of college, research indicates.[39] Other studies have found similar effects, noting that aid targeted at low-income students can boost college retention rates and increase the share of low-income college graduates.[40]
In contrast, merit-based aid is often framed as a reward for students who have demonstrated exceptional academic achievement or leadership ability. Lawmakers hope that by rewarding academic achievement, they can lure talented students to remain in state for college and in their working years afterwards. While studies do show that offering merit-based aid can encourage certain students who would have attended college elsewhere to remain in state, some of the aid goes to students who would have stayed in state anyway.[41]
Merit aid also raises concerns that, when poorly designed, these programs can direct resources to college students from advantaged backgrounds — typically white students and students from high-income and wealthy communities who have had the benefit of well-resourced K-12 school systems and access to costly college test prep courses. One study from the early 2000s analyzed the Georgia HOPE scholarship program, one of the largest and oldest state merit-based programs in the country. Researchers found that while the HOPE program — which had no income limit on eligibility and required high schoolers to have graduated with at least a 3.0 GPA (at the time of study) — did encourage more students across racial/ethnic backgrounds to attend a four-year institution, its benefits disproportionally went to white students in the state, actually increasing the state’s racial gap in college attendance.[42]
States would be better off bolstering need-based aid programs, simplifying and consolidating programs to reduce confusion and encourage greater enrollment, and building design aspects into these programs that not only encourage enrollment but also encourage timely completion to reduce costs to both the state and students.[43]
Ensure Resources Go to Schools in Greatest Need
While most state funds for higher education are distributed on a per-pupil basis, over the past few decades states have experimented with funding models that aim to encourage better outcomes by rewarding schools that excel across specific benchmarks — and withholding funds from those that don’t. Lawmakers in states across the country have implemented funding formulas, commonly referred to as performance funding, that evaluate two- and four-year colleges on their ability to meet goals in areas such as degree completion, student retention, and job placement rates. In recent years, states have implemented performance funding schemes while continuing to cut overall state funding, hoping to encourage colleges to produce better outcomes with fewer resources.
Currently, 32 states operate with performance-based funding policies for their public two- and four-year colleges.[44] The proportion of state funds appropriated to two- and four-year colleges through performance funding formulas varies widely, a State Higher Education Executive Officers survey found. Of the 23 states that reported using performance funding formulas to allocate resources to four-year colleges, 13 reported allocating more than 10 percent of their funding via performance metrics. Six states reported using performance funding formulas to allocate more than half of their state’s resources.[45]
Research to date has found little to no positive impact of these schemes. “Across this body of research, the weight of evidence suggests states using performance-based funding do not out-perform other states — results are more often than not not statistically significant,” a 2016 study examining research on performance funding concluded.[46]
Performance funding is less effective than policymakers might hope for several reasons. One is that after years of cuts to baseline funding, public colleges — especially two-year colleges and regional institutions with smaller endowments and more modest enrollment numbers — lack the basic resources needed meet the goals laid out by performance-based metrics.
Given the inputs required to improve performance metrics, even small penalties or withholding of funds can harm less-resourced institutions without giving them the tools they would need to improve. One study noted that “the policy [in Tennessee] did not build the capacity necessary to accomplish…higher order goals.”[47] Another noted that a lack of capacity building support is an “important impediment” to being able to meet the demands of lawmakers to meet performance goals.[48] This capacity gap is particularly acute for public historically black colleges and universities, other minority serving institutions, and smaller regional schools that — due to financial constraints — have limited ability to collect, manage, and make institutional changes based on data.
States implementing performance funding also often use measures that are poorly tailored to identify institutions that produce better outcomes for their students — especially institutions with larger shares of low-income students, students from non-traditional backgrounds, and students of color. One study noted that performance funding arrangements typically fail to account for the unique challenges that smaller regional institutions face, putting them at a significant disadvantage when measured against larger flagship institutions with more selective admission policies. “If an institution has an open-admissions policy that encourages the acceptance of academically under-prepared students, then applicable output indicators should focus on how effective the institution is in educating that particular population of students.”[49]
Rather than creating funding models that benefit the most well-resourced schools at the expense of smaller regional institutions — which often teach the students most in need of additional resources and supports — lawmakers should focus additional state funds on building the capacity of colleges with fewer resources.
End Notes
[1] Complete appropriations data for Illinois is only available through 2017.
[2] This paper uses CPI-U-RS inflation adjustments to measure real changes in costs. Over the past year, the CPI-U-RS increased by 2.4 percent. We use the CPI-U-RS for the calendar year that begins the fiscal/academic year. Unless noted, all figures in this paper are adjusted for inflation.
[3] CBPP calculation using the “Grapevine” higher education appropriations data from Illinois State University, enrollment data from the State Higher Education Executive Officers Association, and the Consumer Price Index, published by the Bureau of Labor Statistics. Since enrollment data are available only through the 2017 school year, enrollment for the 2018 school year is estimated using data from past years.
[4] Education Executive Officers Association, “State Higher Education Finance: FY2017,” March 2018, p. 18, http://www.sheeo.org/sites/default/files/project-files/SHEEO_SHEF_FY2017_FINAL.pdf.
[5] Calculated from College Board, “Trends in College Pricing 2017: Average Tuition and Fee and Room and Board Charges, 1971-72 to 2017-18 (Enrollment-Weighted),” Table 2, https://trends.collegeboard.org/sites/default/files/2017-trends-in-college-pricing_0.pdf.
[6] Anthony P. Carnevale, Nicole Smith, and Jeff Strohl, “Recovery: Job Growth and Education Requirements through 2020,” Georgetown University Center on Education and the Workforce, June 2013, https://georgetown.app.box.com/s/tll0zkxt0puz45hu21g6.
[7] State Higher Education Executive Officers Association, April 2017.
[8] CBPP calculation using the “Grapevine” higher education appropriations data from Illinois State University, enrollment and combined state and local funding data from the State Higher Education Executive Officers Association, and the Consumer Price Index, published by the Bureau of Labor Statistics. Since enrollment data are only available through the 2017 school year, we have estimated enrollment for the 2018 school year using data from past years.
[9] CBPP analysis using College Board, “Trends in College Pricing 2016,” https://trends.collegeboard.org/sites/default/files/2016-trends-college-pricing-web_1.pdf. In non-inflation-adjusted terms, average tuition is up $3,459 over this period.
[10] Ibid.
[11] Ibid.
[12] Costs reported above include both published tuition and fees. Average tuition and fee prices are weighted by full-time enrollment.
[13] As noted earlier, this and other figures in this report have been adjusted for inflation. Of states with increased tuition, the average tuition increased $242, or 2.6 percent.
[14] CBPP analysis using College Board, “Trends in College Pricing 2016,” https://trends.collegeboard.org/sites/default/files/2016-trends-college-pricing-web_1.pdf. See appendix for fiscal years 2016-17 change in average tuition at public four-year colleges.
[15] See, for example, “National Postsecondary Enrollment Trends: Before, During and After the Great Recession,” National Student Clearinghouse Research Center, July 2011, p. 6, http://pas.indiana.edu/pdf/National%20Postsecondary%20Enrollment%20Trends.pdf. A survey by the American Association of Community Colleges (AACC) indicated that increases in Fall 2009 enrollment at community colleges were, in part, due to workforce training opportunities; see Christopher M. Mullin, “Community College Enrollment Surge: An Analysis of Estimated Fall 2009 Headcount Enrollments at Community Colleges,” AACC, December 2009, http://files.eric.ed.gov/fulltext/ED511056.pdf.
[16] State Higher Education Executive Officers Association, “State Higher Education Finance: FY2017,” 2018, p. 25, Figure 5, http://www.sheeo.org/sites/default/files/project-files/SHEEO_SHEF_FY2017_FINAL.pdf.
[17] State Higher Education Executive Officers Association, April 2018; government funding includes both state and local funding sources.
[18] U.S. Department of Education, National Center for Education Statistics, Higher Education General Information Survey (HEGIS), “Fall Enrollment in Colleges and Universities” surveys, 1976 and 1980; Integrated Postsecondary Education Data System (IPEDS), “Fall Enrollment Survey” (IPEDS-EF:90-99); IPEDS Spring 2001 through Spring 2016, Fall Enrollment component; and Enrollment in Degree-Granting Institutions by Race/Ethnicity Projection Model, 1980 through 2026. (This table was prepared March 2017.) https://nces.ed.gov/programs/digest/d16/tables/dt16_306.30.asp.
[19] See, for example, Steven W. Hemelt and Dave E. Marcotte, “The Impact of Tuition Increases on Enrollment at Public Colleges and Universities,” Educational Evaluation and Policy Analysis, September 2011; Donald E. Heller, “Student Price Response in Higher Education: An Update to Leslie and Brinkman,” Journal of Higher Education, Vol. 68, No. 6 (November-December 1997), pp. 624-659.
[20] Drew Allen and Gregory Wolniak, “Exploring the Effects of Tuition Increases on Racial/Ethnic Diversity at Public Colleges and Universities,” Research in Higher Education, 2018, https://doi.org/10.1007/s11162-018-9502-6.
[21] Stella Flores and Justin Shepard, “Pricing Out the Disadvantaged? The Effect of Tuition Deregulation in Texas Public Four-Year Institutions,” The ANNALS of the American Academy of Political and Social Science, Vol. 655, 2014, pp. 99-122.
[22] Thomas J. Kane, “Rising Public College Tuition and College Entry: How Well Do Public Subsidies Promote Access to College?” National Bureau of Economic Research, 1995, http://www.nber.org/papers/w5164.pdf?new_window=1.
[23] Eric P. Bettinger et al., “The Role of Simplification and Information in College Decisions: Results from the H&R Block FAFSA Experiment,” National Bureau of Economic Research, 2009, http://www.nber.org/papers/w15361.pdf. For details on the disparity in access to counseling for low-income students, see “Course, Counselor, and Teacher Gaps: Addressing the College Readiness Challenge in High-Poverty High Schools,” Center for Law and Social Policy, June 2015, http://www.clasp.org/resources-and-publications/publication-1/CollegeReadinessPaperFINALJune.pdf.
[24] U.S. Department of Commerce, Census Bureau, Current Population Survey (CPS), 1975 through 2015. https://nces.ed.gov/programs/digest/d16/tables/dt16_302.30.asp.
[25] In a 2008 piece, Georgetown University scholar Anthony Carnevale pointed out that “among the most highly qualified students (the top testing 25 percent), the kids from the top socioeconomic group go to four-year colleges at almost twice the rate of equally qualified kids from the bottom socioeconomic quartile.” Anthony P. Carnevale, “A Real Analysis of Real Education,” Liberal Education, Fall 2008, p. 57.
[26] Christopher Avery and Caroline M. Hoxby, “The Missing ‘One Offs’: The Hidden Supply of High-Achieving, Low-Income Students,” National Bureau for Economic Research, Working Paper 18586, 2012, http://www.brookings.edu/~/media/projects/bpea/spring-2013/2013a_hoxby.pdf.
[27] Patrick T. Terenzini, Alberto F. Cabrera, and Elena M. Bernal, “Swimming Against the Tide,” College Board, 2001, https://files.eric.ed.gov/fulltext/ED562879.pdf
[28] Eleanor W. Dillon and Jeffrey A. Smith, “The Determinants of Mismatch Between Students and Colleges,” National Bureau of Economic Research, August 2013, http://www.nber.org/papers/w19286. Additionally, other studies have found that undermatching is more likely to occur for students of color. In 2009 William G. Bowen, Matthew M. Chingos, and Michael S. McPherson found that undermatching was more prevalent for black students — especially black women — than for comparable white students.
[29] Stacey Dale and Alan Krueger, “Estimating the Return to College Selectivity Over the Career Using Administrative Earning Data.” Mathematica Policy Research and Princeton University, February 2011, https://www.mathematica-mpr.com/our-publications-and-findings/publications/estimating-the-return-to-college-selectivity-over-the-career-using-administrative-earning-data.
[30] College Board, “Figure 2014_14B. Cumulative Debt of 2011-12 Bachelor’s Degree Recipients by Dependency Status and Family Income,” Prepared October 2014, https://trends.collegeboard.org/sites/default/files/2017-trends-student-aid-source-data_1.xlsx. Low-income dependent students are defined as students from families earning less than $30,000 annually, while high-income students come from families earning more than $106,000.
[31] Mark Huelsman, “The Debt Divide: The Racial and Class Bias Behind the ‘New Normal’ of Student Borrowing,” May 2015, http://www.demos.org/sites/default/files/publications/Mark-Debt%20divide%20Final%20(SF).pdf. Hispanic or Latino students generally borrow at levels equal to the national average. African American students are also more likely to take on student debt to finance education at two-year colleges.
[32] College Board, “Trends in Student Aid 2016,” Figure 12, October 2017, https://trends.collegeboard.org/sites/default/files/2017-trends-student-aid_0.pdf.
[33] Federal Reserve Bank of New York, “Quarterly Report on Household Debt and Credit,” August 2018, https://www.newyorkfed.org/medialibrary/interactives/householdcredit/data/pdf/HHDC_2018Q2.pdf.
[34]Adam Looney and Constantine Yannelis, “A Crisis in Student Loans? How Changes in the Characteristics of Borrowers and in the Institutions They Attended Contributed to Rising Loan Defaults,” Brookings Institution, BPEA Conference Draft, September 10, 2015, http://www.brookings.edu/~/media/projects/bpea/fall-2015_embargoed/conferencedraft_looneyyannelis_studentloandefaults.pdf.
[35] Scott-Clayton, Judith, “The Looming Student Loan Default Crisis is Worse than We Thought,” Brookings Institution, January 10, 2018, https://www.brookings.edu/wp-content/uploads/2018/01/scott-clayton-report.pdf.
[36] Ben Miller, “Who Are Student Loan Defaulters?” Center for American Progress, December 14, 2017, https://www.americanprogress.org/issues/education-postsecondary/reports/2017/12/14/444011/student-loan-defaulters/.
[37] National Association of State Student Grant and Aid Programs, “47th Annual Survey Report on State-Sponsored Student Financial Aid,” 2018, https://www.nassgapsurvey.com/survey_reports/2015-2016-47th.pdf.
[38] Ibid.
[39] Eric Bettinger, “How Financial Aid Affects Persistence.” National Bureau of Economic Research, January 2004, http://www.nber.org/papers/w10242.
[40] Sara Goldrick-Rab et al., “Need-Based Financial Aid and College Persistence: Experimental Evidence from Wisconsin,” Wisconsin Scholars Longitudinal Study, October 10, 2012, http://finaidstudy.org/documents/Goldrick-Rab%20Harris%20Kelchen%20Benson%202012%20FULL.pdf. See also Sigal Alon, “Who Benefits Most From Financial Aid? The Heterogeneous Effect of Need-Based Grants on Students’ College Persistence,” Social Science Quarterly, Vol. 92, No. 3, September 2011, http://people.socsci.tau.ac.il/mu/salon/files/2011/11/ssq_sep2011_final.pdf.
[41] Liang Zhang and Erik C. Ness, “Does State Merit-Based Aid Stem Brain Drain?” Educational Evaluation and Policy Analysis, June 1, 2010, http://journals.sagepub.com/doi/10.3102/0162373709359683. See also David L. Sjoquist and John V. Winters, “Merit aid and post-college retention in the state,” Journal of Urban Economics, March 2014, https://www.sciencedirect.com/science/article/pii/S0094119013000818.
[42] Sue Dynarski, “The Consequences of Merit Aid,” National Bureau of Economic Research, December 2002, http://www.nber.org/papers/w9400.pdf. The same study did find, however, that merit-based programs in other states that employed less stringent requirements did not have this same effect on widening enrollment gaps — further indicating that how merit-aid program are structured matters significantly.
[43] Sandy Baum et al., “Beyond Need and Merit: Strengthening State Grant Programs,” Brookings Institution, May 8, 2012, https://www.brookings.edu/research/beyond-need-and-merit-strengthening-state-grant-programs/.
[44] Nicholas Hillman, “Why Performance-Based College Funding Doesn’t Work,” The Century Foundation, May 25, 2016, https://tcf.org/content/report/why-performance-based-college-funding-doesnt-work/.
[45] State Higher Education Executive Officers Association, April 2018, http://www.sheeo.org/sites/default/files/project-files/SHEEO_SHEF_FY2017_FINAL.pdf.
[46] Nicholas Hillman, “Why Performance-Based College Funding Doesn’t Work,” The Century Foundation, May 25, 2016, https://tcf.org/content/report/why-performance-based-college-funding-doesnt-work/.
[47] Nicholas Hillman et al., “Evaluating the Impacts of ‘New’ Performance Funding in Higher Education,” Educational Evaluation and Policy Analysis, 2014, https://pdfs.semanticscholar.org/3fc4/5ae172a258afef40532278fd0a621fb9b6e2.pdf.
[48] K. J. Dougherty et al., “Performance funding for higher education: forms, origins, impacts, and futures,” The ANNALS of the American Academy of Political and Social Science, 655(1), (2014). 163-184. p. 169.
[49] Tiffany Jones, “Performance Funding at MSIs: Considerations and Possible Measures for Public Minority-Serving Institutions,” Southern Education Foundation, June 2014, http://www.southerneducation.org/getattachment/38ac1248-3b91-4871-bb8e-f5f28b659b54/Performance-Funding-at-MSIs.aspx.
More from the Authors
Areas of Expertise

Areas of Expertise