Poverty Fell and Health Coverage Improved in 2013, But Economic Recovery Is Slow to Reach Many
Median Income Rose for Families with Children But Not Overall
The poverty rate dropped significantly in 2013 for the first time since 2006 and only the second time since 2000, Census data released September 16 show. Incomes were unchanged for middle-income households, and income inequality remained at or near record levels by a number of measures.
The improvements in income and poverty occurred primarily among children and their families. While median income was statistically unchanged among households overall, it rose $1,305 for households with children, and the child poverty rate dropped 1.9 percentage points to 19.9 percent. In contrast, median income for families without children dropped $949, and the poverty rate for individuals not living in families (primarily people living alone and unrelated people who share a household) reached a record high. Incomes likely would have been somewhat higher in 2013, and progress in pushing down poverty somewhat greater, if austerity policies had not constrained economic growth.
The share of the overall population without health insurance edged down slightly in 2013. An array of studies and data — including new data that the Centers for Disease Control and Prevention issued September 16 — show that the number of Americans without insurance has fallen markedly in 2014, following the implementation of major coverage expansions under health reform.
Poverty Fell But Middle Incomes Unchanged and Inequality Remained High
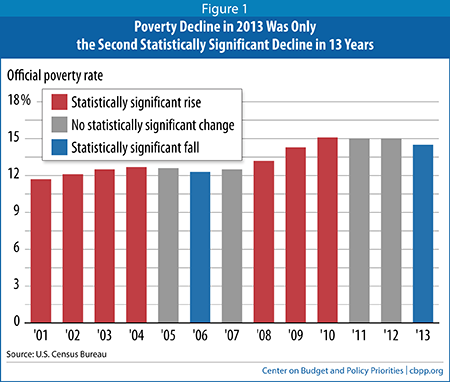
The poverty rate declined to 14.5 percent in 2013 from 15.0 percent in 2012, but remained well above pre-recession levels. At the current rate of progress, it would not return to its pre-recession level of 12.5 percent until about 2017. Some 45.3 million Americans were poor in 2013.
Last year’s poverty improvement follows a decade and a half of mostly rising or stagnant poverty rates. Prior to 2013, the official poverty rate declined only once in the 12 years since 2000 (the exception was 2006). In seven of those years, it worsened; in the remaining four years, it was statistically unchanged (see Figure 1).
As in other recent economic recoveries, relief from poverty has been slow to arrive. Last year was the fourth full year of the current recovery (which began in June 2009) but the first year of poverty reduction. In the previous business cycle, poverty didn’t decline until the fifth full year of recovery, 2006. In the economic recovery before that, poverty didn’t decline significantly until the third year, 1994. By contrast, in the recoveries in the 1960s, 1970s, and 1980s, poverty started falling within two years of the recession’s end.[1]
Like poverty, median income has rebounded more slowly after recessions in recent decades. After the 2001 recession, median income fell significantly in each of the next three years and didn’t rise until the fourth full recovery year. Moreover, median income for non-elderly households never fully made up the lost ground: in 2007, the recovery’s peak year, it was still lower than in the recession year of 2001 and well below the pre-recession level. Overall median income improved faster in each of the three recoveries before that.
In addition, income inequality continued to hover at historically high levels in 2013 by several measures. The share of the nation’s income going to the bottom fifth of households remained at 3.2 percent, tied for the lowest level on record with data back to 1967, while the ratio of the median income of the top fifth of households to that of the bottom fifth of households topped 12 to 1 for the first time on record, with data back to 1967. The principal Census summary measure of household income inequality — known as the “Gini coefficient” — was statistically unchanged from 2012, and remained significantly above its level in previous decades (meaning that inequality exceeds its level in earlier decades).
Health Coverage Improved Slightly in 2013
Some 14.5 percent of Americans lacked health insurance in 2013, according to the Census Bureau’s American Community Survey (ACS), a 0.2 percentage-point reduction from 2012. The Census Bureau usually emphasizes health insurance findings from its Current Population Survey (CPS), but this year it instituted changes to its CPS health insurance questions to improve the accuracy of the responses. As a result, although the CPS is still the preferred source of data for comparing the 2013 health insurance rates across different population groups, the ACS — which did not change its questions this year — is more suitable for comparing 2013 to prior years.[2]
No substantial change in health coverage was expected in 2013 given that the Affordable Care Act’s major coverage expansions didn’t take effect until January 2014. Preliminary data issued September 16 by the Centers for Disease Control and Prevention (CDC) show that the ranks of the uninsured fell in the first quarter of 2014 by 3.8 million people, or 1.3 percentage points.[3] The CDC data provide the first government survey data that reflect the early impacts of the coverage expansions on the uninsured. Some 13.1 percent of the population was uninsured in the first quarter of 2014, the lowest figure since the CDC began collecting these data in 1997.
The coverage gains in the CDC data were greatest among the population groups least likely historically to have health coverage. The uninsured rate for adults under 26 fell from 26.5 percent in 2013 to 20.9 percent in the first quarter of 2014. People in families under 200 percent of the poverty line, Latinos, African Americans, and people with less than a high school education all experienced disproportionately large coverage gains, as well, over this period.
The CDC figures are consistent with four independent surveys that also show significant gains in coverage for adults in 2014, with the uninsured rate down from 2013 by about a quarter in each study. (Three of the studies examined non-elderly adults; the fourth examined all adults.) Some of these studies reflect data gathered after the first quarter of 2014 and so show still-larger coverage gains than those reflected in the CDC data. For example, the Urban Institute’s Health Reform Monitoring Survey found that the uninsured rate fell among adults aged 18-64 from 17.9 percent to 13.9 percent between the third quarter of 2013 and the second quarter of 2014.
The CDC study and three of the independent surveys also include state-by-state data. All four surveys show that the states that adopted health reform’s Medicaid expansion have experienced much greater reductions this year in the share of their populations that are uninsured than the states that have declined the expansion.[4]
On a related front, the new ACS data show that the 23 states that have not adopted the Medicaid expansion already had higher-than-average uninsured rates in 2013. This suggests that the states whose citizens have the most to gain from the Medicaid expansion are, in general, the states that have declined totake it. This will further widen disparities across states in the shares of their populations that are uninsured.[5]
Poverty and Income Improved for Children and Their Families, Worsened for Childless Adults and Part-Year Workers
The Census data show that in 2013, the economic benefits of the recovery were most apparent for the young. The child poverty rate dropped from 21.8 percent to 19.9 percent, while poverty for other age groups was statistically unchanged. Median income rose 2.1 percent for families with children but fell 1.4 percent for childless families.[6] In young-adult households headed by someone under age 25, median income jumped by a robust 10.5 percent, reversing much of that group’s steep income losses since 2007.
The poverty rate for individuals not living in families reached 23.3 percent, its highest level in over 30 years. The poverty rate for childless families, while much lower at 6.2 percent, was also the highest in over three decades. (Childless families include childless couples, elderly couples, families whose children have moved away or turned 18, and other relatives who live together.)
In addition, a large number and percentage of people who work were poor in 2013, as more poor individuals who had been jobless found part-time or part-year work. Indeed, the number and percentage of workers working part time or part of the year who lived in poverty reached record highs in 2013. Some 8.2 million part-time or part-year workers were poor (15.8 percent of such workers), the highest level since at least 1987.
Other findings on work and poverty from the Census data include:
- Some 11.0 million individuals worked some or all of the year but were poor in 2013. Their poverty rate (7.0 percent), although unchanged from 2012, was tied for the highest level since 1994.
- Some 40.6 percent of adults aged 18 to 64 who were poor worked for all or part of the year in 2013, up slightly from 40.3 percent in 2012.
- Some 69.7 percent of poor children lived in a family where someone worked.
An increase even in part-year or part-time employment can improve the financial well-being of families with children, in part because these families are eligible for the Earned Income Tax Credit (EITC) and the Child Tax Credit, which provide significant help to struggling working families. The impact of these tax credits is not reflected in the official poverty statistics but is included in the government’s Supplemental Poverty Measure (SPM). Under that measure (which makes a variety of other changes as well, as explained below), these two tax credits lifted 5.3 million children in working families above the poverty line in 2012. The Census Bureau will release SPM data for 2013 later this year.
Unfortunately, poor workers without children receive little help in making ends meet. That’s in part because the EITC for these workers (and for non-custodial parents) is very small — the average beneficiary receives about $270 from the EITC for workers without children — and workers with incomes of $14,340 earned “too much” to qualify at all in 2013.
A growing bipartisan group of policymakers — including House Budget Committee Chairman Paul Ryan and President Obama — as well as researchers and analysts from across the political spectrum have called for expanding the EITC for these workers. An expansion could both reduce poverty among these workers and encourage more individuals to enter the labor force and actively seek employment, as the EITC has done with parents. A broad array of academic research has shown that the EITC has been highly effective at increasing employment among parents and reducing child poverty.
Austerity Policies Limited Progress on Jobs, Income, and Poverty in 2013
Two reasons that median incomes stayed flat and poverty did not fall more in 2013 were the lack of faster job growth and austerity policies that dampened the labor market’s recovery.
In 2013, the economy produced barely enough jobs to outpace population growth. Only 67.4 percent of the working-age population (people aged 16 to 64) was employed that year, just slightly higher than in 2012 (67.1 percent), according to previously released Labor Department figures.[7] The share of non-elderly adults who are employed has remained low since tumbling in the recession from 71.8 percent in 2007 to 67.6 percent in 2009.
In response to low employment, policymakers could have created jobs, such as by expanding infrastructure investments (as President Obama proposed in the American Opportunity Act of 2013) or reinstituting the temporary Recovery Act funding that states used successfully on a bipartisan basis in 2009 and 2010 to place 260,000 low-income parents and youth into jobs.[8] Instead, policymakers adopted various austerity policies that constrained consumer spending and employment growth, including sequestration budget cuts that reduced federal appropriations for most discretionary (i.e., non-entitlement) programs by 5 to 8 percent in 2013. They also allowed a payroll tax holiday to expire after December 2012; for most workers, the expiration lowered take-home pay by 2 percent of earnings. A third policy decision, to allow tax cuts for very-high-income individuals to expire at the end of 2012, mattered less for consumer demand, as these individuals’ level of consumer spending is less sensitive to tax changes.
The Congressional Budget Office projected in early 2013 that taken together, these measures would reduce economic growth over the year by about 1½ percentage points and lower employment by more than 1 million jobs. Goldman Sachs similarly estimated that changes in government spending and taxes in 2013 cost the economy 1.1 percent of gross domestic product (GDP).
Changes in the availability of unemployment insurance (UI) also held down progress on poverty. While UI kept 3.3 million Americans above the poverty line at the recession’s height in 2009, this number fell sharply to 1.7 million in 2012 and 1.2 million in 2013. To be sure, this decline partly reflected a positive development — falling unemployment. But the 49 percent decline in UI beneficiaries from 2009 to 2013 far exceeded the decline of less than 20 percent in the number of unemployed workers during the same period. In fact, Labor Department data show that the average number of unemployed workers not receiving unemployment benefits was higher in 2013 than in any prior year of the recovery or of the Great Recession itself.[9]
UI’s anti-poverty impact weakened in 2013 for several reasons, apart from falling unemployment. These included a cut in weekly benefit levels for federal UI benefits (triggered by sequestration) and a shrinkage in the number of weeks for which long-term unemployed workers can draw such benefits (enacted in 2012 but with stronger effects in 2013).
Income Inequality Remained at Historic High
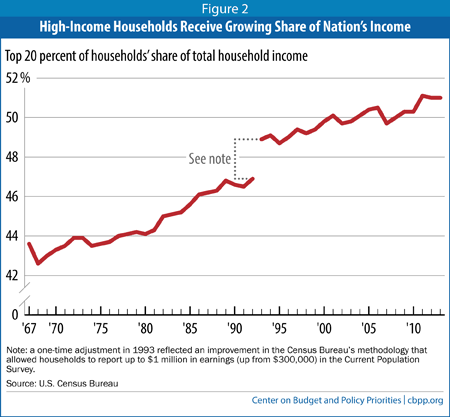
Income inequality remained close to a record high in 2013 by several Census measures, with data back to 1967. The principal Census summary measure of household income inequality, known as the “Gini coefficient,” was not statistically different in 2013 from its record highs in 2012 and 2011 and was higher than in any year before 2007. In addition, the share of national income going to the top fifth of households, 51.0 percent, was not statistically different from its record high of 51.1 percent in 2011. The top 20 percent of households now receive more than half of the nation’s income (see Figure 2). The ratio of top to bottom incomes (i.e., the ratio of the income of the household at the 90th percentile of the income distribution to that of the household at the 10th percentile), while not significantly different than in 2012, surpassed 12 to 1 for the first time on record.
These inequality measures, like most of the income and poverty data the Census Bureau released on September 16, have important limitations. They do not include capital gains income, a significant source of income for high-income households and one that has seen much faster-than-average growth since the recession ended (following a larger-than-average drop during the recession). The Census figures also miss substantial earnings among very high-income people, because Census doesn’t collect data on salaries above $1,099,999. An individual whose compensation rises from $20 million to $25 million between 2012 and 2013 (or falls from $25 million to $20 million) is recorded as earning $1.1 million in both years. In addition, the Census data don’t include some forms of income that low-income households receive such as SNAP (food stamps), rental subsidies, and the EITC.
Although the Census figures thus provide an incomplete look at pre-tax income inequality, the broad trend toward high and rising inequality that the new data show is consistent with other recent studies. For example, a Federal Reserve study issued earlier this month that captures more of the income of high-income households found strong evidence of growing income concentration between 2010 and 2013. “Only families at the very top of the income distribution saw widespread income gains between 2010 and 2013,” the study found, as incomes grew for the nation as a whole but fell for middle- and lower-income households.[10] (The Federal Reserve study includes key income sources, for both affluent and low-income households, that the Census data omit — such as realized capital gains and SNAP benefits.[11])
Wage data, too, show that earnings per hour of work rose fastest during the economic recovery among those at the top of the income scale. Between 2009 and 2013, inflation-adjusted hourly wages rose 1.2 percent for workers in the 95th percentile (that is, for people with wages higher than 95 percent of workers receive and lower than the other 5 percent get), while falling for workers in the middle of the income scale (dropping 3.6 percent for workers at the 50th percentile) and at the bottom (dropping 4.2 percent for workers at the 10th percentile), according to the Economic Policy Institute.[12]
Anti-Poverty Programs Have Strong Impact
The new Census data include figures showing the extent to which various federal programs lift families above the poverty line. As noted above, UI benefits kept 1.2 million people out of poverty in 2013.
Various other benefits do not affect the official poverty statistics because they are not in the form of cash, but do affect the broader, more comprehensive measures of poverty that analysts generally favor. For example, the official poverty measure does not count SNAP benefits as income, but Census data show that if SNAP income is counted, the program lifted 3.7 million people out of poverty last year, including 1.5 million children.
Most analysts favor including SNAP in the poverty measure. The Census Bureau’s alternative measure of poverty, the Supplemental Poverty Measure, does so along with making other changes to determine more accurately whether families have the resources to meet basic needs. (See box.)
More Comprehensive Poverty Measure Shows Much Smaller Rise in Poverty During Recession
The Census figures for 2013 released September 16 do not include the government’s alternative poverty measure, the Supplemental Poverty Measure (SPM), which many analysts regard as providing a more comprehensive and accurate measure of poverty. Later this year, the Census Bureau will release poverty data for 2013 using the SPM.
Unlike the official poverty measure, which counts only cash income, the SPM counts government food assistance, rent subsidies, home energy assistance, and tax credits. It also subtracts taxes owed and out-of-pocket medical and work-related expenses from its measure of family resources. In addition, it updates the poverty line each year based on Americans’ shifting patterns of spending on basic needs.
Although Census SPM data are not available for years before 2009, Columbia University researchers recently estimated the SPM for the years from 1967 to 2012. (To apply today’s living standards consistently over this period, they used a version of the SPM called the “anchored SPM,” which adjusts the 2012 SPM poverty threshold for inflation.) Two of their findings are especially notable:
- Poverty rose much less in the Great Recession when one counts the full array of government assistance. Between 2007 and 2012, the anchored SPM rose from 14.7 percent to 16.0 percent. This 1.3 percentage-point increase was less than half the rise in the official poverty rate, which went from 12.5 percent to 15.0 percent in the same period. The smaller increase in the SPM largely reflects the wider range of safety-net programs included in it and their success in keeping more Americans from falling into poverty during the recession.
- Poverty has fallen significantly since the 1960s. The official poverty measure shows no progress against poverty since 1967, but the Columbia team finds strong improvements — due to safety-net programs such as SNAP and the EITC that aren’t counted under the official measure — when a broader measure of poverty is used. Using the anchored SPM, the poverty rate dropped between 1967 and 2012 from 25.8 percent to 16.0 percent.
Additional Findings on Poverty and Income
For some groups hit especially hard by rising poverty in the Great Recession, 2013 brought partial relief. Hispanics, who experienced the largest percentage-point rise in poverty during the recession of any racial or ethnic group, saw their poverty rate fall from 25.6 percent in 2012 to 23.5 percent in 2013, although this remained well above their 2007 (pre-recession) level of 21.5 percent. By contrast, poverty rates were statistically unchanged in 2013 for non-Hispanic whites and African Americans.
Some 9.7 percent of non-Hispanic whites were poor in 2013. Black Americans continued to have the highest poverty rates; 27.1 percent were poor in 2013, including more than one in three black children (36.9 percent).
The improvement in poverty was particularly striking among Latino children, a group whose poverty rate rose sharply around the time of the recession. Poverty among these children jumped from 26.9 percent in 2006 to 34.9 percent in 2010, but then fell to 33.8 percent in 2012 and 30.4 percent in 2013. White children saw a smaller decline in poverty in 2013, and poverty among African American children remained statistically unchanged.
Among less-educated Americans, who entered the recession with higher poverty rates than more-educated Americans and experienced larger poverty increases in the recession, the poverty rate fell last year: 28.2 percent of Americans aged 25 and older without a high school diploma were poor in 2013, down from 29.7 percent in 2012. Poverty rates were unchanged for those with only a high school education (13.9 percent) and actually rose for those with a college degree (5.1 percent, up from 4.5 percent in 2012), although college-educated adults remain the least likely to be poor.
Finally, the percentage of people in “deep poverty” — with incomes below half of the poverty line (below $11,917 for a family of four) — fell to 6.3 percent in 2013 from 6.6 percent in 2012. Nearly 20 million Americans were this poor. The percentage of children below half of the poverty line dropped to 8.8 percent, from 9.7 percent in 2012. This welcome drop likely reflects the increase in employment, particularly among families with children. Even modest earnings can go a long way toward keeping families out of deep poverty. Deep poverty rates are considerably lower when non-cash and tax-based benefits are considered, but deep poverty remains a significant problem under any poverty definition. In 2012, some 16 million people had incomes below half of the poverty line even under the SPM, which reflects a more complete range of government assistance.
Mixed Outlook for 2014
Signs for 2014 regarding poverty and incomes are mixed. Employment growth appears to be picking up somewhat; the share of non-elderly adults who are employed rose 0.6 percentage points between the first half of 2013 and the first half of 2014, twice the increase between the first halves of 2012 and 2013. Job growth improved slightly as well; the economy added 2.35 million jobs between the first half of 2013 and the first half of 2014, compared with 2.15 million the year before.
On the other hand, the Economic Policy Institute reports that real wages generally declined again in the first half of 2014, and federal unemployment benefits largely ended in early 2014. Real wages did edge up slightly, however, for the lowest-paid workers in the first half of 2014. For workers at the 10th percentile — the ones most directly affected by minimum wage rules — wages edged up 0.2 percent in the first half of 2014, with the wage gains concentrated among states that raised their state minimum wages.a
a Elise Gould, “Why America’s Workers Need Faster Wage Growth -- And What We Can Do About It,” Economic Policy Institute, August 27, 2014, http://www.epi.org/publication/why-americas-workers-need-faster-wage-growth, and CBPP calculations. States that raised the minimum wage did not, as some had feared, experience slower job growth. See Jared Bernstein, “Guess Where Low Wages Went Up? (Hint: Look where minimum wages went up.),” On the Economy blog, September 2, 2014, http://jaredbernsteinblog.com/guess-where-low-wages-went-up-hint-look-where-minimum-wages-went-up/.End Notes
[1] Job growth in the first two full calendar years of the recovery also was stronger after the recessions of the 1960s, 1970s, and 1980s than in any subsequent recovery. (This analysis treats the back-to-back recessions that started in 1980 and 1981 as one recession.)
[2] Based on the CPS, the share of Americans without health insurance in 2013 was 13.8 percent.
[3] Robin Cohen and Michael Martinez, “Health Insurance Coverage: Early Release of Estimates from the National Health Interview Survey, January-March 2014,” Centers for Disease Control and Prevention, September 2014, http://www.cdc.gov/nchs/data/nhis/earlyrelease/insur201409.pdf.
[4] Katherine Grace Carman and Christine Eibner, “Changes in Health Insurance Enrollment Since 2013,” RAND, April 2014, http://www.rand.org/content/dam/rand/pubs/research_reports/RR600/RR656/RAND_RR656.pdf; Sharon Long et al., “Taking Stock at Mid-year: Health Insurance Coverage Under the ACA as of June 2014,” Urban Institute, July 2014, http://hrms.urban.org/briefs/taking-stock-at-mid-year.pdf; Dan Witters, “Arkansas, Kentucky Report Sharpest Drops in Uninsured Rate,” Gallup, August 2014, http://www.gallup.com/poll/174290/arkansas-kentucky-report-sharpest-drops-uninsured-rate.aspx ; and Sara Collins, Petra Rasmussen, and Michelle Doty, “Gaining Ground,” Commonwealth Fund, July 2014, http://www.commonwealthfund.org/publications/issue-briefs/2014/jul/health-coverage-access-aca.
[5] For a more detailed analysis of these and other points from the health insurance data, see Matt Broaddus and Edwin Park, “Census Data Show Uninsured Rate Edged Down Slightly in 2013.” Center on Budget and Policy Priorities, September 22, 2014.
[6] Households headed by someone living with no relative — child, spouse, or other — make up their own category in the Census data. Their income was statistically unchanged in 2013.
[7] The employment rate of non-elderly adults is a more revealing indicator of the job situation than the unemployment rate in times when, as in recent years, large numbers of people stop looking for work. An adult who gives up seeking work is not counted in the unemployment rate but is included in the non-working population when the employment rate is computed.
[8] LaDonna Pavetti, “New Evidence that Subsidized Jobs Programs Work,” Off the Charts blog, September 9, 2013, http://www.offthechartsblog.org/new-evidence-that-subsidized-jobs-programs-work/.
[9] Since unemployment benefits are provided on a weekly basis, the number of unemployed workers not receiving unemployment benefits varies weekly. The number averaged 6.8 million workers in 2013, up from 6.5 million in 2012, 6.0 million in 2011, and 5.0 million in 2010. The numbers were smaller in 2008 and 2009.
[10] Jesse Bricker et al., “Changes in U.S. Family Finances from 2010 to 2013: Evidence from the Survey of Consumer Finances,” Federal Reserve Board, September 2014, http://www.federalreserve.gov/pubs/bulletin/2014/pdf/scf14.pdf.
[11] Federal taxes and tax credits make the post-tax distribution of income modestly less unequal than the pre-tax income distribution.
[12] Elise Gould, “Why America’s Workers Need Faster Wage Growth—And What We Can Do About It,” Economic Policy Institute, August 27, 2014. EPI also found that although wages for those in the middle and the bottom of the wage scale edged upward in 2013, wage inequality continued to grow slightly; wages rose an average of 0.6 percent in 2013 for the bottom group and 1.0 percent for those in the middle, compared to 1.2 percent for those at the top. From http://www.epi.org/publication/why-americas-workers-need-faster-wage-growth, figure F, and CBPP calculations.
More from the Authors

Areas of Expertise

Areas of Expertise