Agencies Generally Use All Available Voucher Funding to Help Families Afford Housing
But Challenges in Some Communities Remain
The Center’s analysis of Department of Housing and Urban Development (HUD) data finds that housing agencies generally use all (or nearly all) of the Housing Choice Voucher funds that Congress makes available every year to help low-income families live in modest, private-market housing at a rent they can afford.[1] While some agencies may leave modest amounts of funds unspent in any particular year, over time the program assists all of the families it can with available funding, even in communities where individual families face significant challenges in finding housing where they can use a voucher.
Recent reports have described these challenges and the tragic circumstances of families that struggle to pay rent, are precariously housed or are even homeless, and yet are unable to use the voucher they received.[2] Searching for housing can be a time-consuming process, and many voucher recipients know little about potential housing options outside of the neighborhoods in which they’ve lived. Moreover, large shares of landlords in some communities refuse to accept housing vouchers, and in most communities the law does not protect renters using vouchers against discrimination.[3] Tight housing markets, in which low-income renters face strong competition from higher-income households as well as other low-income renters, increase families’ difficulties in finding suitable housing where they can use a voucher.
These challenges do not mean that voucher funding is going unused or that the housing voucher program could serve more families if the difficulties were eliminated. That’s because when a significant share of families that receive vouchers do not succeed in finding a place to rent with the voucher, agencies typically compensate by “overissuing” vouchers to eligible families (similar to the way airlines overissue tickets for available seats on a flight). This ensures that all (or nearly all) available voucher assistance funds are used to help families afford housing — which is a critical program objective at a time when, due to funding limitations, 3 out of 4 eligible households do not receive rental assistance of any kind.[4]
Yet low success rates among families that receive housing vouchers remain a legitimate and serious concern. Moreover, while housing vouchers are well utilized overall, a small number of individual housing agencies do not use all of their funding consistently, and could improve their performance in this respect.
Housing agencies can do much to increase families’ chances of using their housing vouchers, and also to improve voucher funds’ utilization where needed. Housing agencies are required to provide voucher holders with information about housing opportunities, but this information is more effective if it is accurate and comprehensive — if it includes, for example, information about opportunities in a wide variety of neighborhoods that could potentially meet families’ needs, as well as a list of properties that are supported by Low Income Housing Tax Credits or other federal subsidies that are required to accept housing vouchers. Agencies can also strengthen their program management in ways that improve families’ chances — such as by expanding their use of project-based vouchers to increase housing opportunities in tight markets — and make the agencies more responsive and reliable partners for landlords, as well as improve their use of voucher assistance funds.
The Department of Housing and Urban Development (HUD) and policymakers also have roles to play. More families are likely to succeed in using their vouchers if Congress provides sufficient annual funding to renew vouchers at subsidy levels that fully reflect reasonable market costs. Voucher assistance fills the gap between what tenants can afford to pay (typically 30 percent of household income, under federal standards) and the rental costs, within reasonable limits set by HUD and the local housing agency. If voucher program funding does not keep pace with changes in market rents and other factors, this shrinks the number of families that can use vouchers, or may increase their housing costs above affordable levels. It’s also important that Congress provide ample funding for agencies to manage their programs effectively, support families’ efforts to locate suitable housing, and respond quickly to landlord requests for inspections. It’s difficult for agencies to administer their voucher programs effectively when they receive only about 80 percent of the funding for which they are eligible under the HUD administrative fee formula, as they have in recent years.
Families Use All Funded Housing Vouchers, But Tight Markets Present Challenges
Housing agencies generally use all (or nearly all) of the Housing Choice Voucher funds that Congress makes available every year.
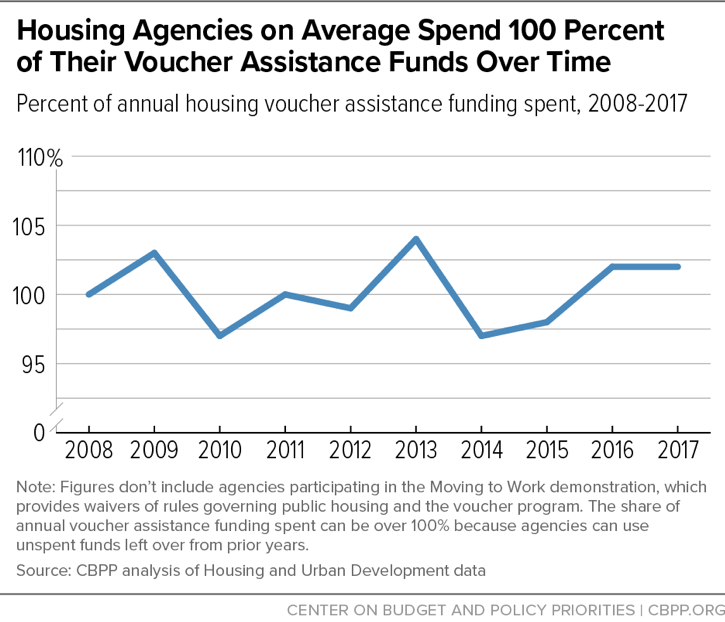
HUD data indicate that, while agencies’ expenditure of voucher assistance funding often fluctuates from year to year, they typically use all (or nearly all) of the funds that Congress makes available over the course of several years. For example, a housing agency may spend a bit less than its annual funding allocation in one year, resulting in some higher-than-needed carryover funding, and then in the next year spend a bit more than its annual allocation by drawing on those reserves. This pattern is evident for the program as a whole as well. Agencies on average spent about 104 percent of the funds they received in 2013 (drawing on reserves from prior years to fill in for a funding shortfall that year), 97 to 98 percent of their funds in 2014 and 2015, and 102 percent of their funds in 2016 and 2017. But overall, agencies have spent 100 percent of the funds they’ve received over the past decade. (See Figure 1.)
The program is thus assisting as many families as possible under current funding levels, even in communities where families’ success rates are relatively low. (See text box for a concise explanation of success and utilization measures.[5])
Measuring Voucher Program Effectiveness: Utilization and Success Rates
Two interrelated types of measures ― utilization rate and success rate ― help shed light on how effectively agencies use their housing vouchers and funds.
- Utilization rate. There are four commonly used measures of utilization: voucher leasing (“unit months leased”), voucher lease-up rate, voucher funds expenditure rate, and the HUD SEMAP measure, which combines the latter two. Each of these measures is useful, but each highlights different aspects of agency performance. Figure 1 shows the national voucher funds expenditure rate in recent years. An agency’s voucher funds expenditure rate is the percentage of its funding allocation that it spends to assist families with vouchers during the year. For instance, if an agency receives $2.5 million for voucher assistance (not counting administrative fees), and spends $2.4 million to assist families, its expenditure utilization rate is 96 percent. This indicator is the most important for assessing program performance in terms of how well funds are used to assist needy families.
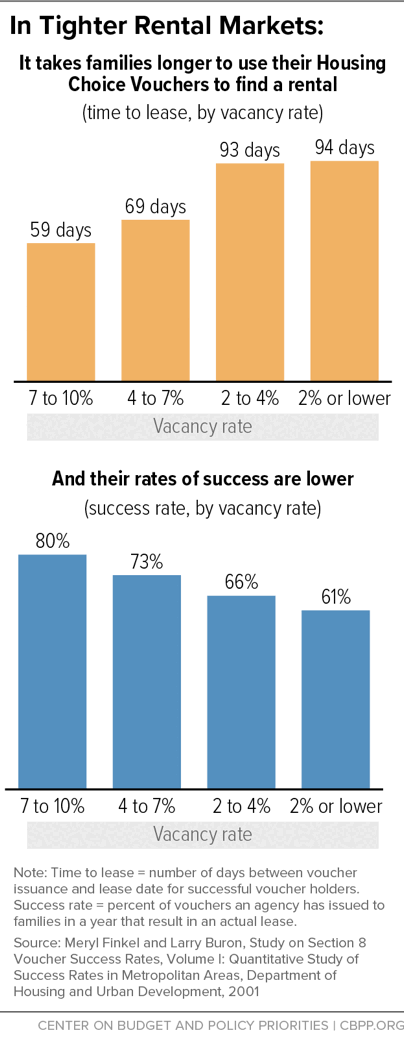
- Success rate. The voucher success rate is the percent of vouchers issued to families in a year that result in an actual lease with a landlord and an assistance contract between the landlord and housing agency. This measure captures market conditions and other external factors that affect families’ ability to use housing vouchers they are offered, as well as agencies’ performance in helping them overcome any barriers.
Reliable, up-to-date success rate data are not publicly available. Historical studies have found that about 70 percent of families that receive housing vouchers succeed in using them, although rates vary widely by community and over time.[6] While a share of households do not succeed, agencies overall have still spent an average of 100 percent of their annual voucher assistance funds in recent years to assist families.[7] This trend holds among housing agencies even in states such as California, despite operating in very tight housing markets where rents have risen sharply.[8]
Even if a share of families is unable to lease units using housing vouchers, housing agencies can use all their voucher funds by overissuing vouchers to families on their waiting lists, thereby compensating for low success rates. For instance, if only two-thirds of the families that receive housing vouchers succeed in using them to rent units, an agency can adjust by issuing three vouchers for every two additional vouchers that available funds will support. By doing this, agencies typically use all available voucher funds — and more importantly, needy families are able to use every available housing voucher for which funds are available — even in challenging housing markets.[9]
Still, it would be better if all (or nearly all) families that are issued vouchers could use them and housing agencies did not have to resort to overissuing vouchers. When families fail to lease with a voucher, they’ve likely wasted significant time and resources in searching for housing, and it’s very frustrating, particularly for families that are homeless or precariously housed, as most voucher recipients are. Overissuing housing vouchers also increases administrative costs for housing agencies.
Where Needed, Agencies Should Improve Voucher Utilization, Expand Housing Options
Even when agencies are able to use all their voucher funds, low success rates among some families issued vouchers are a legitimate and serious concern. Moreover, while housing vouchers are well utilized overall, some individual agencies do not use all their funding. In 2017, for example, housing agencies overall spent 102 percent of the voucher assistance funds they received, yet more than 300 housing agencies (about 15 percent of all agencies administering housing vouchers) spent less than 95 percent of the funds they received to help families pay their rent, leaving $102 million of their 2017 funds unspent at the end of the year.[10] While generally agencies that underspend one year compensate the following year by drawing down their excess reserves, for a small number of agencies, underutilization is a chronic problem.
Housing Market Conditions, Other Factors Can Make It Hard to Use Vouchers
Finding a suitable unit to rent can be challenging for anyone, and particularly for the vulnerable people who receive housing vouchers. Many know little about housing options outside of the neighborhoods in which they’ve lived, and they may lack transportation to visit available units, as well as the funds often required for security deposits or moving costs. Frail seniors, people with disabilities, and single parents who are balancing work and childcare responsibilities may find it particularly difficult to navigate the time-consuming housing search process.
In addition, a host of factors exacerbate families’ challenges and can make it harder for agencies to use available funds effectively. These factors, which vary across communities, include:
-
Market conditions such as low vacancy rates and poor housing quality: Low rental vacancy rates intensify competition among renters, put upward pressure on rents, and generally lower families’ chances of success in using housing vouchers. (See Figure 2.) This is a common theme in tight coastal housing markets but is not limited to those areas.[11]
Housing quality can also be a barrier. Federal law requires that homes where vouchers are used meet basic safety and quality standards, yet in some communities many units do not, and landlords may refuse to make the fixes required to lease units to voucher holders.[12] In rural areas, the share of the housing stock that is available for rent tends to be smaller than in other areas, which can make it more difficult for families with children, particularly larger families, to use housing vouchers.[13]
-
Landlord refusal and weak legal protections: The Fair Housing Act prohibits landlords from refusing to rent to people because of their race, color, national origin, sex, religion, disability, and familial status. But voucher holders are not specifically protected under the Act, and landlords may refuse to rent to them unless such discrimination is prohibited by state or local law.[14]
In a recent large-scale study across five sets of localities, Urban Institute researchers found that the share of landlords who refused to accept housing vouchers for available units that otherwise appeared to be voucher eligible ranged from 15 to 78 percent. The shockingly high refusal rates in Fort Worth (78 percent), Los Angeles (76 percent), and Philadelphia (67 percent) help explain the frequently frustrating experiences of families attempting to use housing vouchers in those locations.[15]
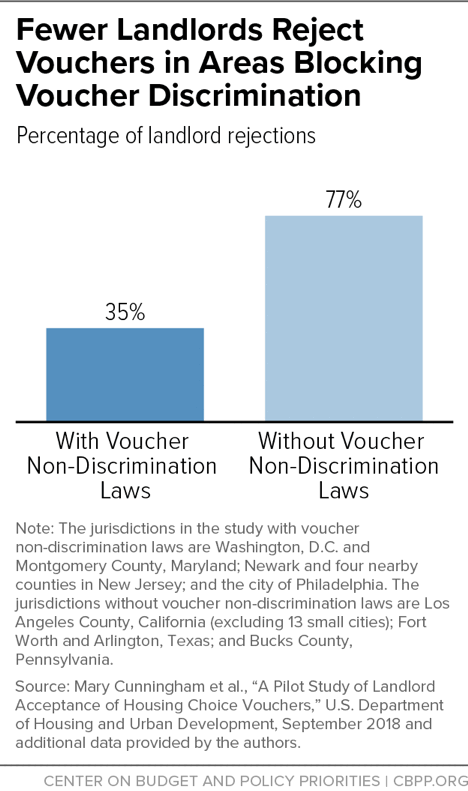
Eleven states and more than 50 cities and counties have enacted laws that prohibit landlords from refusing to rent to tenants solely because they have a housing voucher.[16] While the vigor with which they are enforced varies widely, evidence suggests that such laws substantially increase landlords’ acceptance of families with housing vouchers. (See Figure 3.) States and localities with these laws should enforce them, and those that lack them should enact them.
-
Inadequate funding or ineffective funds management: The breadth of families’ housing options is determined in part by the amount of the voucher subsidy. That amount, in turn, is a function of the amount of program funding that Congress makes available each year, HUD-determined limits on the maximum amount of subsidy, and housing agencies’ decisions about how to use the funding they receive. Voucher assistance fills the gap between what families can afford to pay and the actual rent of modest units available in the private market, within reasonable limits that the local housing authority sets. The voucher subsidy limits (so-called “payment standards”) that housing agencies set each year determine the number of available units that will be affordable for families using vouchers. When payment standards are set too low, the number of affordable units available to families shrinks, which makes it more difficult for them to use their vouchers. (Moreover, households are prohibited under program rules from initially leasing a unit if their rental cost burden would exceed 40 percent of household income.)
Similar problems arise when the funding that Congress provides is inadequate. For instance, if year-over-year funding does not rise to keep pace with market rent increases, it forces agencies to choose between cutting the number of households they assist or limiting the amount of the voucher subsidy, which in turn can increase families’ costs and reduce the number of affordable units available to them. Inadequate administrative funding also limits agencies’ capacity to recruit landlords, assist families in their housing search, or even perform timely inspections or other functions that can improve families’ rate of success (more on these issues below).
Housing Agencies Can Reduce Barriers, Improve Voucher Utilization
While housing agencies can do little to influence factors such as low vacancy rates in the private rental market, they can take steps to improve families’ chances of finding available housing that meets their needs and improve voucher utilization where needed. Strategies they can use have a range of administrative costs associated with them.[17]
Supporting Families’ Housing Search
Housing agencies are required to provide families with informational “briefing packets” that include a list of owners that make units available to voucher holders and a map with information about housing opportunities and other housing market information. Families are more likely to succeed if this information is accurate and comprehensive. For instance, the packets should have up-to-date information about owners with units available in a wide range of neighborhoods, including those with good schools or other characteristics that are important to families, as well as units supported by Low Income Housing Tax Credits or other federal development subsidies that are prohibited from discriminating against housing voucher holders. In addition, financial counseling and other services, including help with repairing credit, can improve families’ chances of succeeding in their search. Agencies can partner with other organizations that provide these and other housing-related services for people who are homeless, have disabilities, or face other significant challenges.[18] It’s also essential to allow families sufficient time to search for a suitable unit. Housing agencies must allow households to search for at least 60 days but have discretion to allow longer search periods. Making use of this discretion can significantly improve families’ success rates, and costs agencies virtually nothing.
Being a Responsive and Reliable Partner for Landlords
A recent HUD-sponsored study of landlord behavior found that landlords’ reasons for refusing to accept housing vouchers fall into three overlapping areas: their perceived financial interests, prejudice and concerns about voucher tenants, and frustration with program bureaucracy.[19] Strong housing agency management can mitigate concerns in each of these areas. For instance, agencies can set (and regularly update) voucher payment standards at levels that make voucher holders competitive with other renters, including in high-opportunity areas, thereby eliminating or reducing financial disincentives to program participation.[20] Aggressive outreach that emphasizes the program’s advantages, such as the preliminary tenant screening that agencies do and the reliability of agencies’ assistance payments to owners, may also help in recruiting landlords. Prompt inspections let owners avoid the lost month or more in rent that occurs if agencies are slow to inspect units before tenants move in. Finally, responding quickly to landlord requests and helping them resolve tenant conflicts or other issues, where appropriate, are examples of other agency strategies to recruit and retain willing landlords.
Strengthening Other Basic Aspects of Program Management
To improve voucher funds utilization, agencies should closely monitor voucher issuances and success rates (and adjust the former accordingly), track the flow of assistance payments as well as reserves of unspent funds (including reserves that are held by HUD but available to the agency for use), and spend excess reserves aggressively to assist more families (or raise payment standards to expand families’ housing opportunities). Agencies can also expand the use of project-based vouchers, which ensure that existing units in the local stock will be affordable and available to low-income households. Doing so can expand housing options in tight markets, including high-opportunity areas, or for people with special housing needs. People with mental health conditions, for example, are more likely to remain housed if they receive treatment and other support services, and project-based vouchers are particularly well-suited to supportive housing.[21]
Housing Agencies Have Incentives to Improve Success Rates and Voucher Utilization
Helping more needy households secure an affordable home is not the only reason that housing agencies should improve success rates and voucher utilization. Improving in these areas benefits agencies, too, in the following ways:
- Increased renewal funding eligibility: Agencies’ annual renewal funding eligibility is based on their voucher leasing and costs in the prior year, and their base funding eligibility thus increases dollar for dollar in the next year whenever they improve their voucher funds utilization. Conversely, agencies’ base renewal funding eligibility declines if they fail to use all of the funds they received in the prior year. Agencies with excess reserves of unspent prior-year funds may also lose those funds, as Congress typically authorizes HUD (in annual appropriations acts) to reduce renewal funding eligibility for agencies with excess reserves, which in effect requires them to spend down reserves in lieu of receiving renewal funding to sustain the vouchers that families are using.
- Increased administrative funding: Housing agencies receive funds from HUD for their costs of program administration, and the amount of funding they receive is largely based on the number of vouchers that are currently leased. Administrative funding eligibility thus increases when agencies increase their voucher utilization.
- Improved performance in HUD assessment: Voucher utilization is a key element (about 15 percent of the total score) of HUD’s Section 8 Management Assessment (SEMAP) protocol, a measure that factors in things like the agency’s “lease-up rate,” or the percentage of its authorized housing vouchers in use.[22] Meeting the minimal acceptable standard under SEMAP has benefits for agencies. For instance, when Congress appropriates funds to expand the availability of housing vouchers, HUD often allocates these vouchers to agencies on a competitive basis, and prioritizes agencies that have a demonstrated history of managing their voucher funds well.[23]
- Reduced administrative costs: Overissuing vouchers to compensate for low success rates may yield strong voucher utilization rates, but it also increases agencies’ costs. Agencies have to determine the eligibility of multiple households, and brief them, for every voucher they ultimately lease. Improving success rates can therefore reduce administrative costs, other things being equal, as well as limit the consequences for families when they fail to lease successfully.[24]
HUD Also Has a Role
By strengthening enforcement of existing rules and providing more robust technical assistance, HUD could play an important role in reducing the barriers that families face and encouraging housing agencies to fully utilize their vouchers.
HUD already does much to encourage housing agencies to improve voucher funds utilization — and Secretary Ben Carson’s recent launch of a task force aimed at improving landlord participation in the program promises further improvements — but it could do more.[25] For instance, housing agencies are required to provide a list of landlords that will potentially rent to voucher holders and other useful information in the briefing packets that they provide families at the beginning of their housing search. As explained above, high-quality materials can improve families’ chances of successfully using their vouchers. Yet HUD does little to monitor the quality and comprehensiveness of briefing materials. For instance, is the landlord list regularly updated, and does it include landlords representing a wide range of housing and location options, including options outside the agencies’ jurisdiction? Does it include a complete listing of properties that were developed using Low Income Housing Tax Credits, HOME funds, or other federal subsidies that are required to accept housing vouchers? In addition to monitoring briefing materials, HUD could generally provide more technical assistance to agencies that struggle with low success rates, including by improving families’ chances to rent in high-opportunity areas.[26]
End Notes
[1] For general information on the Housing Choice Voucher program, see “Policy Basics: The Housing Choice Voucher Program,” Center on Budget and Policy Priorities, https://www.cbpp.org/research/housing/policy-basics-the-housing-choice-voucher-program.
[2] Gale Holland and Abby Sewell, “Subsidized rent, but nowhere to go: Homeless vouchers go unused,” Los Angeles Times, May 30, 2016, http://www.latimes.com/local/lanow/la-me-homeless-vouchers-snap-story.html. For another example, see Laura Sullivan and Meg Anderson, “Section 8 Vouchers Help The Poor — But Only If Housing Is Available,” a National Public Radio story about the experiences of several families in Dallas, May 10, 2017, https://www.npr.org/2017/05/10/527660512/section-8-vouchers-help-the-poor-but-only-if-housing-is-available. Several reports also followed the publication of a new Urban Institute study of landlord behavior, cited below.
[3] Alison Bell, Barbara Sard, and Becky Koepnick, “Prohibiting Discrimination Against Renters Using Housing Vouchers Improves Results,” Center on Budget and Policy Priorities, December 20, 2018, https://www.cbpp.org/research/housing/prohibiting-discrimination-against-renters-using-housing-vouchers-improves-results.
[4] “Three Out of Four Low-Income At-Risk Renters Do Not Receive Federal Rental Assistance,” Center on Budget and Policy Priorities, https://www.cbpp.org/three-out-of-four-low-income-at-risk-renters-do-not-receive-federal-rental-assistance.
[5] For a more detailed explanation of this and other terms involved with housing vouchers, see Center on Budget and Policy Priorities, “Housing Voucher Success and Utilization Indicators, and Understanding Utilization Data,” https://www.cbpp.org/research/housing/housing-voucher-success-and-utilization-indicators-and-understanding-utilization.
[6] Meryl Finkel and Larry Buron, “Study on Section 8 Voucher Success Rates, Volume I, Quantitative Study of Success Rates in Metropolitan Areas,” Department of Housing and Urban Development, 2001, https://www.huduser.gov/portal/publications/pubasst/sec8success.html. Success rates in metro areas studied varied from 37 to 100 percent.
[7] This figure is the average for 2008 to 2017 for all of the more than 2,000 state and local agencies that administer housing vouchers, except for the 39 agencies that participate in the Moving to Work (MTW) demonstration. Data include all Housing Choice Voucher assistance funding received in each year, including funding for new tenant protection, Veterans Affairs Supportive Housing (VASH), and other new vouchers awarded to agencies during the year, and total voucher housing assistance payments (HAP). In some years, some agencies spend more than 100 percent of their funding allocations by using unspent funds left over from prior years.
Voucher funds expenditure rates among MTW agencies are historically much lower, on average, than among other agencies. The average expenditure rate among non-MTW agencies was 102 percent in 2016 and 2017, but just 88 percent among MTW agencies, for example, and MTW agencies received $775 million in voucher assistance funds over the two-year period that they either did not spend or spent on other activities, such as program administration, resident services, or housing rehabilitation or development. (MTW agencies are allowed to receive waivers of many program rules, including the rules that funding be spent on housing vouchers.) As a result, MTW agencies provide housing assistance to tens of thousands fewer families than they could with the funds they received. For further discussion, see Will Fischer, “New Report Reinforces Concerns About HUD’s Moving to Work Demonstration,” Center on Budget and Policy Priorities, October 30, 2017, https://www.cbpp.org/research/housing/new-report-reinforces-concerns-about-huds-moving-to-work-demonstration.
[8] In 2016 and 2017, for example, California housing agencies spent 101 percent of the voucher assistance funds they received, compared to about 102 percent nationally. These figures do not include data for the 39 agencies (seven of which are in California) participating in the Moving to Work demonstration.
[9] An important factor contributing to the very high voucher funds expenditure rate is the fact that most families using vouchers received their vouchers in prior years and continue to rent from the same landlord. Low success rates affect only families that have just received a voucher. In addition, HUD is authorized to reduce renewal funding allocations at agencies that build up excess reserves of unspent funds, effectively forcing agencies to spend these reserves to renew assistance and improving the program’s funds expenditure rate.
[10] These figures do not include agencies participating in the MTW demonstration. Nearly 1,300 non-MTW agencies spent more than 100 percent of the funds they received in 2017 by spending down reserves of unspent funds left over from prior years. Agencies were forced to rely on funding reserves because the renewal funding that Congress provided under the fiscal year 2017 appropriations law was 3 percent less than agencies required according to the formula that HUD uses, which calculates renewal funding eligibility based on actual voucher usage and costs in the prior year, adjusted for inflation and other factors.
[11] For instance, rental vacancy rates in the Minneapolis-St. Paul and Denver metro areas have hovered around 4 to 5 percent in recent years, according to Census surveys, which is similar to the rate in the New York City metro area, https://www.census.gov/housing/hvs/data/ann17ind.html.
[12] Finkel and Buron, op. cit.
[13] Linda Pistilli, Study on Section 8 Voucher Success Rates Volume II: Qualitative Study of Five Rural Areas, Department of Housing and Urban Development, 2001, https://www.huduser.gov/portal//Publications/pdf/sec8_vol2.pdf.
[14] There is evidence that some owners refuse to rent to voucher holders as a pretext for discriminating against groups of people that are protected under the Fair Housing Act. Owners of housing developed with Low Income Housing Tax Credits or other federal subsidies may not discriminate against voucher holders, even if no local law prohibits such discrimination.
[15] Mary K Cunningham et al., “A Pilot Study of Landlord Acceptance of Housing Choice Vouchers,” Urban Institute, August 20, 2018, https://www.urban.org/research/publication/pilot-study-landlord-acceptance-housing-choice-vouchers.
[16] Bell et al., op. cit.
[17] More comprehensive and detailed discussions of these and other strategies are available in: Finkel and Buron, op. cit.; Meryl Finkel et al., “Costs and Utilization in the Housing Choice Voucher Program,” Department of Housing and Urban Development, 2003, https://www.huduser.gov/portal//Publications/PDF/utilization.pdf; “Dialogue with Amy Ginger, HUD Director of Housing Voucher Program, on How to Improve Housing Voucher Utilization,” April 6, 2016, https://www.cbpp.org/sites/default/files/atoms/files/3-4-19hous-interview.pdf; and the guidance on improving success rates and utilization that HUD provides at https://www.hud.gov/program_offices/public_indian_housing/programs/hcv/Tools. For a discussion of strategies to help families to locate in low-poverty areas with quality schools and other opportunities, see Barbara Sard et al., “Federal Policy Changes Can Help More Families with Housing Vouchers Live in Higher-Opportunity Areas,” Center on Budget and Policy Priorities, September 4, 2018, https://www.cbpp.org/research/housing/federal-policy-changes-can-help-more-families-with-housing-vouchers-live-in-higher.
[18] In general, housing agencies can use admissions preferences to attract tenants who are most likely to benefit from relevant services that partner organizations provide, and thereby bring partner organizations to the table. In this way, agencies can leverage support services for tenants through their use of admissions preferences. See Jeffrey M. Lubell, Kathryn P. Nelson, and Barbara Sard, “How Housing Programs’ Admissions Policies Can Contribute to Welfare Reform,” in A Place to Live, a Means to Work, Fannie Mae Foundation, 2003.
[19] Philip Garboden et al., “Urban Landlords and the Housing Choice Voucher Program: A Research Report,” Department of Housing and Urban Development, May 2018, https://www.huduser.gov/portal/publications/UrbanLandlords.html.
[20] Voucher payment standards, which vary by unit bedroom number, are the maximum rent that a voucher subsidy will cover. If families choose units that rent above the payment standard, then they must pay the difference, in addition to the 30 percent of adjusted household income that they typically pay already. Housing agencies have discretion to set payment standards at 90 to 110 percent of the Fair Market Rent (FMR), although they can ask HUD to set them above 110 percent of FMR. They may also use Small Area Fair Market Rents (SAFMRs) in higher-rent zip codes, or use SAFMRs in every zip code with HUD’s permission. (A small number of agencies are required to use SAFMRs in every zip code.) See “A Guide to Small Area Fair Market Rents (SAFMRs): How State and Local Housing Agencies Can Expand Opportunity for Families in All Metro Areas,” Center on Budget and Policy Priorities, May 4, 2018, https://www.cbpp.org/research/housing/a-guide-to-small-area-fair-market-rents-safmrs.
[21] See “Policy Basics: Project-Based Vouchers,” Center on Budget and Policy Priorities, https://www.cbpp.org/research/housing/policy-basics-project-based-vouchers. Regarding housing for people with special needs, see Ehren Dohler et al., “Supportive Housing Helps Vulnerable People Live and Thrive in the Community,” Center on Budget and Policy Priorities, May 31, 2016, https://www.cbpp.org/research/housing/supportive-housing-helps-vulnerable-people-live-and-thrive-in-the-community.
[22] As noted above, see “Housing Voucher Success and Utilization Indicators, and Understanding Utilization Data” for further detail on terms.
[23] See, for example, the 2018 Notice of Funding Availability for new mainstream vouchers, https://www.hud.gov/sites/dfiles/SPM/documents/FY17%20Mainstream%20Voucher%20Program%20NOFA.pdf.
[24] See Ginger interview, op cit.
[25] HUD tracks voucher and voucher funds utilization as part of SEMAP. In recent years, HUD has regularly reviewed these data to identify agencies that are underutilizing funds, and offered them technical assistance aimed primarily at improving funds management, such as helping them track the expenditures of assistance funds and remaining balances of available funds more accurately, and adjusting voucher issuances to use available funds more efficiently to assist families. Regarding the new HUD task force, see “HUD Launches Campaign to Boost Landlord Acceptance of Housing Vouchers,” Department of Housing and Urban Development press release, August 20, 2018, https://www.hud.gov/press/press_releases_media_advisories/HUD_No_18_086.
[26] States and localities should also do more, particularly in regions where markets are tight or success rates tend to be low for other reasons. More states should enact laws prohibiting discrimination against households using vouchers, for example. Currently, only 34 percent of households with housing vouchers live in jurisdictions with protections against discrimination by landlords, despite the growing body of evidence indicating that such laws substantially increase the program’s effectiveness. See Bell et al., op. cit. Learning from examples in Illinois and Virginia, states and localities can also offer targeted tax or other incentives to landlords to accept housing vouchers — for instance, incentives targeted to landlords in high-opportunity areas where vouchers may be harder to use. Mary K. Cunningham, “To increase housing choice, try incentivizing landlords,” Urban Institute, September 15, 2016, https://www.urban.org/urban-wire/increase-housing-choice-try-incentivizing-landlords.
More from the Authors