House-Passed Proposal to Block-Grant and Cut SNAP (Food Stamps) Rests on False Claims About Program Growth
Recent Increases in SNAP Spending Largely Reflect the Recession; Program Does Not Contribute to Nation’s Long-Term Budget Problems
The House-passed plan to convert SNAP (the Supplemental Nutrition Assistance Program, formerly called food stamps) to a block grant and cut the program by almost 20 percent rests on the false claim that the program is experiencing “relentless and unsustainable growth.” [1] SNAP’s substantial growth of recent years has come primarily in response to the battered economic circumstances of tens of millions of Americans, showing that, in fact, the program is working as intended — not that it is out of control and contributing to the nation’s long-term fiscal problem.
Converting SNAP to a block grant and exacting deep cuts, as the House-passed budget resolution proposes to do beginning in 2015, would hurt the tens of millions of Americans who rely on the program. [2] SNAP would largely lose the ability to respond to rising need, forcing states during economic downturns to cut benefits or create waiting lists for needy families. (See box, p. 3.)
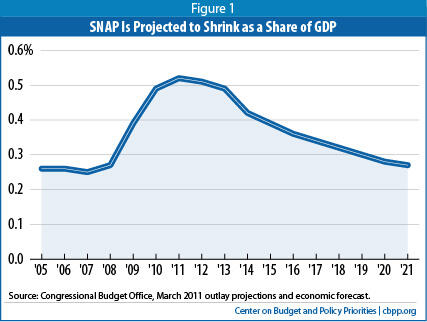
SNAP is the nation’s most important anti-hunger program and a major pillar of the safety net. Three-quarters of SNAP benefits go to families with children. Nearly a third of beneficiaries are senior citizens or people with disabilities. By design, enrollment expands quickly during economic downturns as poverty rises, unemployment mounts, and more people need assistance Enrollment then falls as the economy recovers and need abates, which the non-partisan Congressional Budget Office predicts will occur in the coming years. By 2021, SNAP spending is expected to fall nearly to pre-recession levels relative to the size of the economy (measured by Gross Domestic Product, or GDP), according to CBO’s latest projections. (See Figure 1.)
Despite charges to the contrary, SNAP is not contributing to the nation’s long-term budget problem. That problem is driven largely by the aging of the population and health care costs (in both the public and private sectors) that are rising faster than the economy — the combination of which will drive up the costs of Medicare, Medicaid, and Social Security in the coming years — and revenues that are inadequate to cover those rising costs. SNAP is not contributing to this problem, nor are there demographic or programmatic pressures that will cause SNAP costs to grow in the future. Once the economy has fully recovered, SNAP costs are expected to rise only in response to growth in the low-income population and food prices.
The recent increases in SNAP costs have been caused primarily by three factors:
- the deepest economic recession since the program was established, which accounts for about two-thirds of the increase in costs between 2007 and 2010;Image
- a temporary increase to SNAP benefits that was enacted in 2009 as an economic stimulus measure, and which a broad range of economists across the political spectrum view as one of the most effective and efficient forms of economic stimulus (this accounts for about half of the rest of the increase between 2007 and 2010); and
- food price increases, which were very high over the 2007 and 2008 period, eased in 2009 and 2010, but now appears to be on the rise again.
This analysis discusses the details and causes of recent SNAP expenditure growth. Before getting into the specifics, a few key points are important to put the SNAP increases in context.
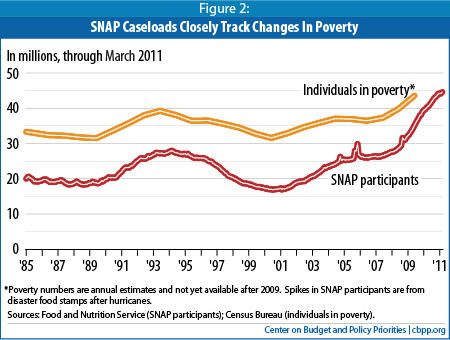
- SNAP eases hardship and reduces poverty. According to the Census Bureau, 43.6 million people lived in poverty in 2009, an increase of 3.7 million over 2008. Most experts expect that poverty figures will be even higher for 2010 and may take several years to recover, given the expected slow decline in unemployment from very high levels. Despite these increases in poverty, between 2008 and 2009 the share of households that experienced food insecurity (as measured by the Department of Agriculture through a Census Bureau survey) held steady at about 14.7 percent, in large part because of the boost to benefits from the 2009 Recovery Act and because SNAP was able to expand to meet the growing need. [3] Other research has found that, under an expanded definition of poverty that counts non-cash benefits (like SNAP benefits) as income, the combination of SNAP, refundable tax credits, and unemployment insurance has kept poverty from rising sharply during the current economic downturn. [4]
House Proposal to Block-Grant SNAP Would Seriously Harm Low-Income Families
The House proposal to convert SNAP into a block grant beginning in 2015 would seriously damage the program and cause harm to the millions of low-income Americans who rely on it. Although the chairman’s proposal does not include details on how deeply the block grant would cut the program, a capped funding structure of the kind he proposes would largely eliminate SNAP’s ability to respond to rising need, such as during recessions. In such times, states would be forced to cut benefits to some households or create waiting lists for needy families.
Under a block grant:
- SNAP would be less able to respond to increased need during an economic downturn;
- States would likely be able to shift funds away from food assistance to other purposes, which they would be tempted to do when they face large budget shortfalls (as they do today); and
- Fixed funding would provide no room to address one of the most significant issues facing the program today: low participation rates among eligible working-poor families with children and low-income seniors.
The Center will provide a more comprehensive analysis as more details of this proposal become available.
- SNAP fills important gaps in the safety net. A significant share of unemployed workers do not qualify for unemployment insurance (UI) because of their low wages, part-time work, or employment in high-turnover job sectors. SNAP is often the only benefit available to unemployed workers who cannot qualify for UI or whose UI benefits have ended. A preliminary CBPP analysis finds that of the estimated 7.7 million workers who became jobless over a four-month period in late 2008, approximately 1.7 million, or 23 percent, received SNAP at the time they lost their job or at some point within the following 12 months.
SNAP’s role in the safety net has been all the more important because TANF cash assistance has not been available to many unemployed low-income families. TANF provides basic cash assistance to families with children that have little or no income. Nationally, TANF cash assistance caseloads increased by only 13 percent between December 2007 and December 2009. In contrast, SNAP caseloads increased by 45 percent over this period, the number of unemployed workers almost doubled (a 99 percent increase), and the number of long-term unemployed workers — those who have been out of work for more than six months and are still looking for a job — almost quadrupled (a more than 360 percent increase).
The recession has exposed damage that the 1996 welfare law apparently did to the safety net’s ability during economic downturns to help unemployed families who can’t find work and don’t qualify for unemployment insurance. Because TANF is a block grant with fixed funding, states do not automatically get any additional funding when poverty rises and caseloads increase. [5] Moreover, other features of TANF’s design give states incentives to keep caseloads from growing even in hard economic times. [6]
- SNAP puts money into local economies. SNAP benefits can be redeemed at any of the more than 200,000 retail outlets in communities across the nation that are authorized to participate in the program. Almost 80 percent of SNAP benefits are redeemed within two weeks of receipt, and 97 percent are spent within a month. Because the benefits quickly reach families and communities in need, and because recipients are highly likely to spend the money quickly, economists view SNAP as one of the most effective forms of economic stimulus during an economic downturn. Mark Zandi, chief economist of Moody’s Analytics, estimates that for every dollar the Recovery Act spent on the temporary increase in SNAP benefits, the Gross Domestic Product increased by $1.72, making it the strongest stimulus provision that Moody’s assessed. [7] The U.S. Department of Agriculture estimates the multiplier at $1.79.[8]
- SNAP responded effectively to the recession. Between fiscal years 2007 and 2009 (the latest year for which detailed data are available), the number of households that received SNAP benefits grew by 30 percent. The increase occurred among all SNAP populations: the number of families with children receiving SNAP benefits grew 26 percent, while the number with an elderly beneficiary grew by 20 percent. Even with the high unemployment rate, the number of households receiving SNAP who have earnings increased by 28 percent, reflecting the loss of income that many working families experienced when one wage-earner in a two earner family lost his or her job or when a worker’s income declined because the worker’s hours were cut back or the person was laid off and forced to take a lower-paying job.
- No structural pressures are driving SNAP spending higher. Unlike other entitlement programs such as Social Security, Medicare, and Medicaid — where the retirement of the baby boomers and overall health industry inflation are driving up program costs — there are no demographic or programmatic pressures that will cause SNAP costs to grow in the future. Once the recovery has fully taken hold, SNAP costs are expected to increase only in response to growth in the low-income population and food price increases.
- A large share of the deep SNAP cuts made by the 1996 welfare law remain in place. Despite investments in SNAP in the 2002 and 2008 farm bills, roughly half of the large SNAP benefit cuts made by the 1996 welfare law remain in place, including certain eligibility restrictions for legal immigrants and unemployed childless adults and a large share of the 1996 law’s across-the-board benefit reductions. Once the temporary increase in SNAP benefits from the Recovery Act ends, a typical family will again receive less in SNAP benefits than it would have under food stamp law in effect prior to 1996.
- SNAP errors are at an all-time low. To ensure that benefits are provided only to eligible households and in the proper amounts, SNAP has one of the most rigorous quality control systems of any public benefit program and, in recent years, has achieved its lowest error rates on record. In fiscal year 2009, even as caseloads were rising, states set new record lows for error rates. The net loss due to errors equaled only 2.7 percent of program costs in 2009. [9] There is no evidence that program errors are driving up SNAP spending.
SNAP Spending Has Grown Substantially, Primarily Due to Recession
Since the recession began — that is, between 2007 and 2010 — SNAP costs have grown by 102 percent in nominal terms. [10] The Congressional Budget Office (CBO) projects that SNAP costs will rise by about 11 percent in fiscal year 2011 and about 3 percent in fiscal year 2012, because of a continued increase in the number of SNAP recipients. As explained below, after nearly all recessions, the number of people living in poverty continues to increase for a year or two after the unemployment rate begins to decline. After 2012, SNAP costs are projected to drop, with a sharp decline in 2014 when the temporary Recovery Act benefit increase ends and a further decline each year after that as the economic recovery takes hold more fully.
CBO’s SNAP cost projections are consistent with its overall economic forecast. CBO projects that the unemployment rate will remain above 6 percent until 2016. If the economic recovery is faster or stronger than that, SNAP spending will decline more rapidly. In the longer term, the only upward pressures on SNAP costs are expected to be those from normal population growth and food price increases.
SNAP spending is driven almost entirely by the number of people who participate and by how much each receives in benefits. Between 2007 and 2010, both of those factors increased markedly. In the future, both are expected to come down substantially.
Recession Made Many More People Eligible for Benefits
The growth in SNAP participation from fiscal year 2007 to fiscal year 2010 accounted for about two-thirds of the total growth in SNAP expenditures over that period. The number of individuals receiving SNAP in an average month grew from 26.3 million to 40.3 million between 2007 and 2010, primarily because the economic downturn made more people eligible. In some of the states that have been hit hardest by the economic downturn (such as Florida and Nevada), SNAP caseloads have more than doubled since 2007. (See Table 1 at the end for state-by-state growth in unemployment and SNAP participation.)
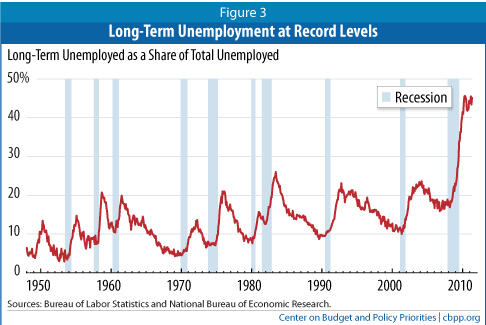
The record-setting SNAP participation levels are consistent with the extraordinarily deep and prolonged nature of the recession. Long-term unemployment reached the highest levels on record and has remained at these unprecedented levels during the nascent recovery. Today, 45.1 percent of all unemployed workers have been out of work for more than half a year; the previous post-World War II high was 26 percent in 1983. Since the recession began in December 2007, the number of long-term unemployed workers has risen by an astonishing 367 percent (through May 2011). (See Figure 3.)
By the end of calendar year 2010, SNAP participation growth had begun to slow. (Participation increased 13 percent between December 2009 and 2010, compared to 22 percent the prior year.) It is not surprising that SNAP participation has continued to grow even though the number of unemployed individuals has leveled off. As discussed below, in recent recessions, even after the economy has begun growing and unemployment rates have peaked, poverty has taken significantly longer to start its decline. After each of the last three recessions, poverty continued rising (or failed to decline) in the first year after unemployment began to fall. [12]
Other factors: Increased need because of the deep economic downturn and lagging recovery is clearly the overwhelming reason SNAP participation has grown. But states and USDA also have taken steps in recent years to increase the share of eligible households — especially eligible working-poor households — that participate in SNAP. There is some evidence these efforts have produced results. USDA research finds that since 2001, the participation rate among eligible households has grown from about 54 percent to 67 percent. The House proposal attacks the program growth that has resulted from states doing a better job of serving people eligible for SNAP; it should be noted that SNAP eligibility rules are set by Congress and are designed to target benefits at families and individuals who cannot afford a basic diet.
Benefits Have Gone Up Due to Rising Prices and Temporary Recovery Act Increase
Growth in benefit levels accounts for the other third of SNAP expenditure growth between 2007 and 2010. The primary cause of the growth between 2007 and 2009 was large increases in food prices, which drove up the maximum SNAP benefits by about 13 percent. Then, starting in April 2009 the Recovery Act boosted SNAP benefits temporarily by another 13.6 percent.
Food prices. SNAP benefits are pegged to the cost of the USDA Thrifty Food Plan, so when food prices rise, SNAP benefits also go up, though the benefits increase only once a year and lag behind actual food price increases. Food prices rose rapidly in late 2007 and throughout 2008. Because of the increases in the cost of food, maximum SNAP benefits rose by 4.4 percent in fiscal year 2008 and by 8.5 percent in fiscal year 2009 (before the effects of the Recovery Act discussed below). Food prices subsequently stabilized, although they have recently risen sharply.
Economic recovery legislation. The Recovery Act, enacted in February 2009, included a temporary 13.6 percent increase in maximum food stamp benefits that took effect in April 2009. [13] The higher benefits raised SNAP spending by about $4.3 billion in 2009 and $10.6 billion in 2010 and are expected to raise benefits by about $12.2 billion in 2011.
Outlook
The road to recovery from the 2007-2009 recession has been long and difficult and will likely continue to be so. CBO forecasts that the unemployment rate will remain high through 2014, averaging 8.7 percent in 2012, 7.8 percent in 2013, and 7.1 percent in 2014. CBO projects we will not reach full employment (an employment rate of close to 5 percent) until 2018. [14]
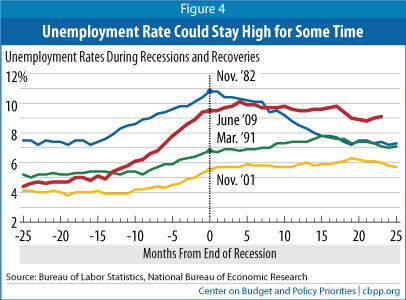
Unemployment has been slow to recover after recent recessions, and poverty even slower. Post-World War II history suggests that deep recessions are followed by stronger labor market recoveries than more moderate recessions. The two most recent recessions, however, have been followed by protracted job slumps. Data thus far from the current recovery indicate that this recession is likely to continue following the more recent pattern (see Figure 4).
Poverty often takes even longer to start its decline. After each of the last three recessions, poverty continued rising or failed to decline in the first year that unemployment began to fall.
- In 2004, the first year that the annual unemployment rate declined following the 2001 recession, the poverty rate rose to 12.7 percent, up from 12.5 percent the year before. The number of poor people rose 3.3 percent or 1.2 million.
- In 1993, the first year that the annual unemployment rate declined following the 1991 recession, the poverty rate reached 15.1 percent, not statistically different from the prior year’s 14.8 percent. The number of poor people rose a statistically significant 3.3 percent, or 1.3 million people.
- In 1983, the first year that the annual unemployment rate declined following the 1981-82 recession, the poverty rate reached 15.2 percent (not statistically different from the prior year’s 15.0 percent), and the number of poor people climbed by 0.9 million (a statistically significant 2.6 percent increase.)
The pattern suggests that poverty could take years to start falling and much longer than that to return to pre-recession levels. CBO’s projections of future SNAP costs are consistent with this pattern.
| Table 1: Change in SNAP Caseloads, Number of Unemployed, and SNAP Participation Rates, by State Fiscal Years 2007 to 2010 | ||||||||||
| State | SNAP | Number of Unemployed People | ||||||||
| 2007 No. Participants (in 000s)* | 2010 No. Participants (in 000s)* | % Change | Rank | 2008 SNAP Participation Rate** | 2007 No. Unemployed (in 000s)*** | 2010 No. Unemployed (in 000s)*** | % Change | Rank | ||
| Nevada | 122 | 278 | 128% | 1 | 51% | 57 | 200 | 248% | 1 | |
| Idaho | 87 | 194 | 123% | 2 | 55% | 21 | 69 | 232% | 2 | |
| Florida | 1,233 | 2,603 | 111% | 3 | 62% | 338 | 1,041 | 208% | 3 | |
| Utah | 123 | 247 | 100% | 4 | 55% | 35 | 107 | 206% | 4 | |
| Arizona | 545 | 1,018 | 87% | 5 | 61% | 112 | 321 | 187% | 5 | |
| Wisconsin | 383 | 715 | 87% | 6 | 63% | 149 | 267 | 79% | 37 | |
| Rhode Island | 76 | 139 | 82% | 7 | 61% | 29 | 67 | 131% | 14 | |
| Washington | 536 | 956 | 78% | 8 | 80% | 157 | 344 | 119% | 20 | |
| New Hampshire | 59 | 104 | 77% | 9 | 62% | 27 | 47 | 77% | 39 | |
| Maryland | 318 | 561 | 76% | 10 | 61% | 109 | 224 | 105% | 25 | |
| Georgia | 950 | 1,591 | 67% | 11 | 64% | 218 | 481 | 121% | 18 | |
| Delaware | 67 | 113 | 67% | 12 | 66% | 15 | 36 | 140% | 12 | |
| Massachusetts | 456 | 749 | 64% | 13 | 70% | 155 | 300 | 93% | 33 | |
| Vermont | 53 | 86 | 63% | 14 | 79% | 14 | 23 | 67% | 45 | |
| Colorado | 251 | 405 | 61% | 15 | 52% | 100 | 238 | 138% | 13 | |
| Oregon | 438 | 705 | 61% | 16 | 92% | 98 | 216 | 119% | 21 | |
| South Dakota | 60 | 95 | 58% | 17 | 61% | 13 | 22 | 66% | 46 | |
| California | 2,048 | 3,239 | 58% | 18 | 50% | 912 | 2,241 | 146% | 9 | |
| Connecticut | 213 | 336 | 58% | 19 | 66% | 82 | 172 | 110% | 24 | |
| Minnesota | 276 | 430 | 56% | 20 | 62% | 132 | 223 | 69% | 43 | |
| Hawaii | 90 | 138 | 54% | 21 | 78% | 16 | 42 | 169% | 7 | |
| Wyoming | 23 | 35 | 54% | 22 | 46% | 8 | 21 | 161% | 8 | |
| New York | 1,802 | 2,758 | 53% | 23 | 68% | 423 | 839 | 99% | 29 | |
| Virginia | 515 | 786 | 53% | 24 | 63% | 120 | 293 | 145% | 10 | |
| New Mexico | 234 | 357 | 53% | 25 | 66% | 32 | 78 | 143% | 11 | |
| North Carolina | 883 | 1,346 | 53% | 26 | 65% | 213 | 492 | 130% | 15 | |
| New Jersey | 415 | 622 | 50% | 27 | 54% | 190 | 432 | 128% | 16 | |
| Ohio | 1,077 | 1,607 | 49% | 28 | 70% | 330 | 609 | 85% | 36 | |
| Kansas | 182 | 270 | 48% | 29 | 57% | 62 | 107 | 74% | 41 | |
| Michigan | 1,204 | 1,776 | 47% | 30 | 86% | 353 | 630 | 78% | 38 | |
| Alabama | 546 | 805 | 47% | 31 | 67% | 74 | 209 | 184% | 6 | |
| Texas | 2,422 | 3,552 | 47% | 32 | 55% | 503 | 983 | 95% | 31 | |
| South Carolina | 545 | 797 | 46% | 33 | 75% | 122 | 246 | 101% | 27 | |
| Iowa | 238 | 340 | 43% | 34 | 75% | 61 | 102 | 66% | 47 | |
| Montana | 80 | 114 | 42% | 35 | 65% | 16 | 35 | 120% | 19 | |
| Tennessee | 865 | 1,224 | 42% | 36 | 87% | 143 | 305 | 114% | 23 | |
| Maine | 163 | 230 | 41% | 37 | 94% | 33 | 56 | 72% | 42 | |
| Pennsylvania | 1,135 | 1,575 | 39% | 38 | 74% | 271 | 550 | 103% | 26 | |
| Indiana | 587 | 813 | 39% | 39 | 69% | 150 | 327 | 118% | 22 | |
| Oklahoma | 421 | 582 | 38% | 40 | 68% | 72 | 125 | 74% | 40 | |
| District of Columbia | 87 | 118 | 37% | 41 | 86% | 18 | 34 | 90% | 35 | |
| Alaska | 56 | 76 | 36% | 42 | 70% | 21 | 29 | 36% | 50 | |
| Mississippi | 426 | 576 | 35% | 43 | 64% | 82 | 138 | 68% | 44 | |
| Nebraska | 121 | 163 | 35% | 44 | 63% | 29 | 47 | 63% | 48 | |
| Missouri | 671 | 901 | 34% | 45 | 83% | 151 | 290 | 92% | 34 | |
| North Dakota | 45 | 60 | 33% | 46 | 67% | 11 | 15 | 30% | 51 | |
| Illinois | 1,246 | 1,646 | 32% | 47 | 80% | 319 | 706 | 121% | 17 | |
| Kentucky | 602 | 778 | 29% | 48 | 86% | 114 | 221 | 94% | 32 | |
| Louisiana | 650 | 826 | 27% | 49 | 72% | 77 | 151 | 96% | 30 | |
| West Virginia | 269 | 341 | 27% | 50 | 91% | 35 | 69 | 100% | 28 | |
| Arkansas | 380 | 467 | 23% | 51 | 71% | 71 | 106 | 48% | 49 | |
| United States | 26,316 | 40,302 | 53% | 66% | 6,934 | 14,951 | 116% | |||
| * FNS SNAP Data: http://www.fns.usda.gov/pd/15SNAPpartPP.htm, ** FY2008 is the most recent participation rate available. *** Bureau of Labor Statistics | ||||||||||
End Notes
[1] The Path to Prosperity: Restoring America’s Promise, House Budget Committee, April 5, 2011, page 41.
[2] For an analysis and state estimates of what it would mean to achieve $127 billion in spending cuts from SNAP, as the House budget proposes, see “Ryan Budget Would Slash SNAP Funding by $127 Billion Over Ten Years: Low-Income Households in All States Would Feel Sharp Effects,” CBPP, April 11, 2011.
[3] Mark Nord, Alisha Coleman-Jensen, Margaret Andrews, and Steven Carlson, “Household Food Security in the United States, 2009,” Economic Research Report 108, U.S. Department of Agriculture, Economic Research Service, November 2010; and Mark Nord and Mark Prell, “Food Security Improved Following the 2009 ARRA Increase in SNAP Benefits,” Economic Research Report 116, U.S. Department of Agriculture, Economic Research Service, April 2011.
[4] See Arloc Sherman, “Despite Deep Recession and High Unemployment, Government Efforts — Including the Recovery Act — Prevented Poverty from Rising in 2009, New Census Data Show,” Center on Budget and Policy Priorities, January 5, 2011, and Sam Roberts, “Food Stamps and Tax Aid Kept Poverty Rate in Check,” New York Times, March 21, 2011.
[5] The Recovery Act did create a $5 billion TANF Emergency Fund during the recent recession, which allowed states to get additional funding, but that fund has expired.
[6] See LaDonna Pavetti, Danilo Trisi, and Liz Schott, “TANF Responded Unevenly to Increase in Need During Downturn,” Center on Budget and Policy Priorities, January 2011.
[7] Mark Zandi, “Too Soon to Pull Back Fiscal Policy Support,” December 6, 2010.
[8] Kenneth Hansen, “The Food Assistance National Input-Output Multiplier (FANIOM) Model and Stimulus Effects of SNAP,” Economic Research Report Number 103, U.S. Department of Agriculture, October 2010.
[9] USDA issues three payment error rates each year, based on rigorous state reviews and federal re-reviews of eligibility and benefit decisions: an overpayment error rate, an underpayment error rate, and a combined payment error rate, which is the sum of the overpayment and underpayment error rates. In 2009 the national overpayment rate was 3.53 percent and the underpayment error rate was 0.82 percent, so the combined error rate was the sum of these two figures, or 4.36 percent. But the net loss to the federal government from errors — that is, benefits lost through overpayments minus those saved by underpayments — was 2.7 percent.
[10] Benefits make up more than 90 percent of SNAP outlays. The total also includes the federal share of state administrative costs, block grants for nutrition assistance in Puerto Rico and American Samoa, funds for commodities for The Emergency Food Assistance Program (TEFAP), and funding for the Food Distribution Program on Indian Reservations (FDPIR).
[11] Federal outlays for unemployment insurance increased by more than 400 percent from 2007 to 2010 because of legislation (including the 2009 Recovery Act) to extend and increase benefits and because the number of unemployed individuals qualifying for benefits increased.
[12] Prior to the onset of the most recent recession, SNAP participation had been increasing for several years for two main reasons. First, the economic recovery after the 2001 recession did not improve employment or real wages at the lower end of the labor market, as can be seen in the continued rise in poverty in Figure 3 even after overall unemployment turned around in the mid-2000s. Second, as discussed, beginning around 2000 states and USDA undertook efforts to reach more eligible people, especially working-poor-families.
[13] The bill also provided administrative funds to states to implement the change and to help manage rising caseloads during the recession, suspended for 18 months the three-month time limit that unemployed childless adults face, and provided a comparable increase for Puerto Rico’s food assistance block grant.
[14] Congressional Budget Office, The Budget and Economic Outlook: Fiscal Years 2011 to 2021, January 2011.
More from the Authors