House-Passed Bill Would Devastate Health Care in Rural America
July 6th, 2017: We have updated this analysis to incorporate the effects of the Senate Republican health bill. That report can be found here.
The House-passed health bill — the American Health Care Act, or AHCA — would effectively end the Affordable Care Act’s (ACA) Medicaid expansion, radically restructure the entire Medicaid program through a per capita cap, and replace the ACA’s premium tax credit and cost-sharing protections with a woefully inadequate tax credit that would make coverage unaffordable for millions of people looking to purchase coverage in the individual market. Taken together, these and other provisions would raise the number of uninsured by 24 million by 2024, according to the Congressional Budget Office (CBO).[1]
The harmful effects would be particularly severe in rural America.The harmful effects would be particularly severe in rural America. Medicaid has long played an even larger role in providing health coverage and paying for care in rural areas than in urban areas. Medicaid’s importance to rural America has only grown under the ACA. Nearly 1.7 million rural Americans have newly gained coverage through the Medicaid expansion. In at least eight expansion states, more than one-third of expansion enrollees live in rural areas: Alaska, Arkansas, Iowa, Kentucky, Montana, New Hampshire, New Mexico, and West Virginia. Moreover, in expansion states overall, rural residents make up a larger share of expansion enrollees than they do of these states’ combined population. The Medicaid expansion has also become a critical financial lifeline sustaining rural hospitals.
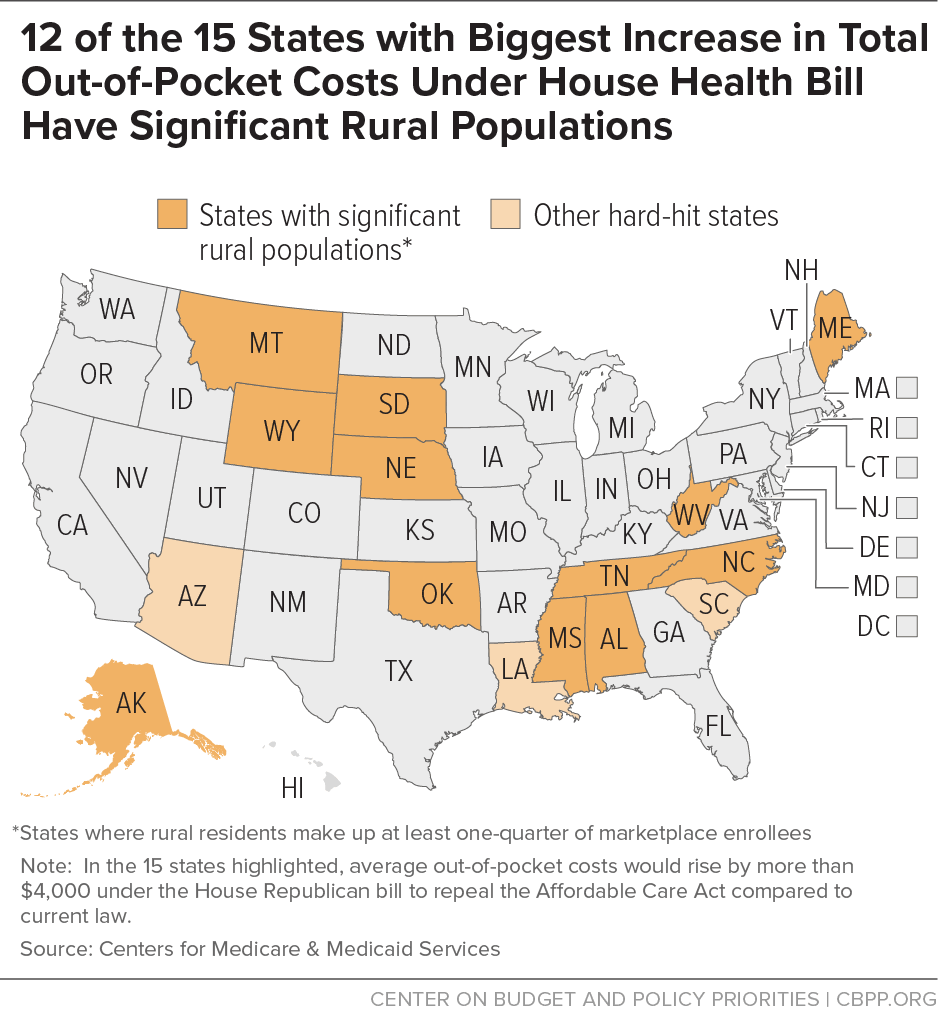
Rural areas have also greatly benefited from the ACA’s premium tax credits and cost-sharing subsidies and would be disproportionately harmed by the House bill’s dramatically smaller credits and elimination of help with deductibles and copayments. More than 1.6 million enrollees — or nearly one in five marketplace enrollees in the 39 states that use HealthCare.gov — live in rural areas. In 12 of the 15 states in which consumers would face the steepest average increases in total out-of-pocket spending under the AHCA, rural residents make up at least one-quarter of marketplace enrollees. And many rural residents could face prohibitive premiums and out-of-pocket spending because the House plan eliminates nationwide protections that enable people with pre-existing conditions to get the coverage and services they need, allowing states to waive these protections.
ACA Has Significantly Improved Rural Health Coverage and Residents’ Health
Like the rest of the country, rural America has enjoyed large gains in health coverage since the ACA’s major coverage expansions took effect in 2014. The uninsured rate among rural non-elderly individuals plummeted by nearly one-third between 2013 and 2015, from 17 percent to 12 percent, according to a Kaiser Family Foundation analysis. Over the same period, the Urban Institute’s Health Reform Monitoring Survey found that rural individuals’ insured rate rose by 7.2 percentage points, compared to 6.3 percentage points for individuals in urban areas.[2]
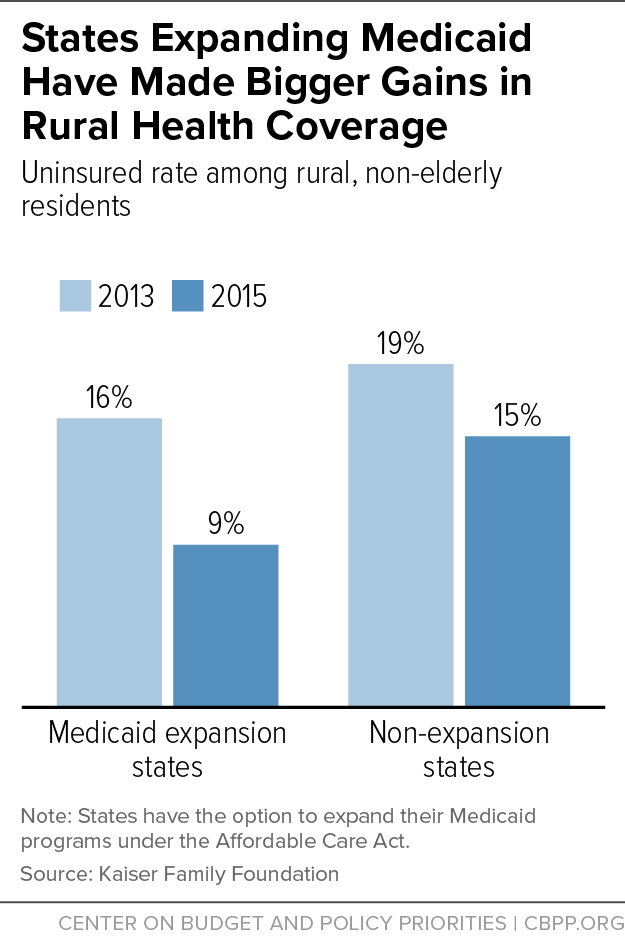
Coverage gains occurred in both Medicaid and private insurance, but states that expanded Medicaid have made larger gains in rural health coverage: the uninsured rate among rural, non-elderly individuals dropped much more in states that expanded Medicaid (from 16 percent in 2013 to 9 percent in 2015) than in non-expansion states (from 19 percent to 15 percent).[3] (See Figure 1.)
People enrolled in coverage through the Medicaid expansion are receiving needed primary care and critical health services, research shows. For example, a survey of low-income, non-elderly adults in three states found that the share of residents with a primary care physician rose by 8 percentage points more in the expansion states of Arkansas and Kentucky (both of which have many rural residents enrolled in coverage through the expansion) than in the non-expansion state of Texas.[4] In Kentucky, state data show tens of thousands of low-income individuals have received cholesterol, diabetes, and cancer screenings, and preventive dental services.[5] Medicaid expansion has also helped millions of people access treatment for opioid addiction and other substance use disorders.[6]
Medicaid Cuts Would Undermine Program in Rural America
Medicaid has long played an essential role in delivering health care in rural America. In 2010, prior to the ACA, 18 percent of rural residents nationwide were enrolled in Medicaid, compared to 15 percent of urban residents. This reflected various factors unique to rural America, including its lower access to job-based coverage, greater prevalence of self-employed jobs (such as farming and contracting), lower incomes, and greater share of people with a disability.[7]
Of the more than 11 million people who have gained Medicaid coverage through the ACA expansion, nearly 1.7 million live in rural America, according to new CBPP estimates (see Appendix Table 1). The expansion population is more rural than the population as a whole: rural residents make up 12.1 percent of the population of expansion states but 14.1 percent of expansion enrollees in these states. In at least eight expansion states, more than one-third of expansion enrollees live in rural areas: Alaska, Arkansas, Iowa, Kentucky, Montana, New Hampshire, New Mexico, and West Virginia.
The Medicaid expansion has been a lifeline for rural areas in other ways. The ACA coverage expansions, especially the Medicaid expansion, have substantially reduced hospital uncompensated care costs: uncompensated care costs as a share of hospital operating budgets fell by about half between 2013 and 2015 in expansion states.[8] Reductions in uncompensated care and increases in the share of patients covered by Medicaid have been especially important for rural hospitals. For example:
- Rural hospitals in expansion states have had larger gains in Medicaid revenue than urban hospitals.
- Rural hospitals are also likelier to turn a profit if located in an expansion state.[9]
- Both urban and rural hospitals in expansion states saw improvements in operating margins after the expansion. But the Medicaid expansion was associated with a 4 percentage-point increase in operating margins for rural hospitals, as compared to a 1 percentage-point increase for urban hospitals.[10]
- Most of the 78 rural hospitals that have closed since 2010 are in southern states that haven’t expanded Medicaid.[11]
The House-passed bill would roll back this progress in coverage and harm rural providers by effectively ending the Medicaid expansion. Beginning in 2020, states would receive only the regular federal Medicaid matching rate — on average, 57 percent — for any new enrollees under the expansion instead of the permanent expansion matching rate of 90 percent. This would force states to pay 2.8 to 5 times more than under current law for each new enrollee.
In seven states (Arkansas, Illinois, Indiana, Michigan, New Hampshire, New Mexico, and Washington), these higher costs would automatically trigger immediate or eventual termination of the Medicaid expansion, with no action by state policymakers necessary. Laws in these states either explicitly require the expansion to end if the federal matching rate falls or require the state to prevent an increase in state Medicaid costs. But in practice, most or all of the other 25 states that have expanded Medicaid would also see their expansions end due to the size of the cost shift. The House bill would permit states to freeze expansion enrollment and bar any new enrollees, and since CBO estimates that more than two-thirds of those enrolled as of the end of 2019 will fall off the program by 2021 and fewer than 5 percent of newly eligible enrollees will remain on Medicaid by the end of 2024, the Medicaid expansion would be eliminated after several years.
In addition, the House bill would radically restructure federal Medicaid financing by converting virtually the entire program for all states to a per capita cap. (States would have the option to convert their program to a block grant for children, adults, or both.) Under the cap, states would get less federal funding per beneficiary than under current law, with the cuts growing each year. States would be responsible for 100 percent of any costs in excess of the per capita cap, whether due to unanticipated health care cost growth or to demographic changes that a per capita cap wouldn’t account for.[12] To compensate for these cuts, states would have to raise taxes, cut other budget areas like education, or as is far likelier, cut Medicaid spending by cutting payments to providers or rolling back eligibility for the program, with the cuts becoming increasingly severe over time.
Overall, these changes would cut federal Medicaid spending by $839 billion over ten years — a 24 percent cut by 2026 — and cut Medicaid enrollment by 14 million people by 2026, CBO estimates.[13]
House Bill’s Tax Credits Would Not Meet Rural Residents’ Needs
The House Republican bill’s damage to rural America would extend beyond people who’ve gained coverage through the Medicaid expansion and beyond the seniors, families with children, and people with disabilities affected by the bill’s other Medicaid cuts. The bill’s new tax credit for the purchase of individual market coverage would be woefully inadequate for many people in rural areas. Unlike the ACA’s far more generous and flexible tax credit, the House bill’s credit wouldn’t adjust for geographic variation in premiums and would provide too little assistance for older people. These deficiencies would leave many of the 1.6 million current rural marketplace enrollees unable to afford their high insurance premiums.[14]
The ACA’s premium tax credit varies based on income and the cost of insurance. Low- and moderate-income families without access to other coverage are guaranteed the option to purchase benchmark health insurance for a set percentage of their income, with the credit covering the rest. Once the credit’s value is set under this formula, consumers can use the credit to help pay the premium of any qualified health plan offered in their state’s marketplace.
Because the ACA’s premium tax credit is based on the cost of a benchmark plan — an actual plan in the marketplace for someone of the consumer’s age in the consumer’s geographic rating area — it is flexible enough to meet the needs of people who live in high-cost areas, are older, or have lower incomes. Adjusting assistance based on geographic variation in premiums is especially important to people who live in rural areas. Premiums tend to be higher in rural areas because the low population density often raises the cost of providing medical care, and these areas generally have a limited array of providers and little competition among insurers.[15] In addition, residents are disproportionately older and tend to have lower incomes.[16] But even if these factors raise premiums, individuals don’t pay more than a certain percentage of income for benchmark coverage under the ACA’s premium tax credits.
In contrast, the House bill would provide flat tax credits varying only by age: $2,000 for people under 30, $2,500 for people age 30 to 39, $3,000 for people age 40 to 49, $3,500 for people age 50 to 59, and $4,000 for people age 60 and older. Thus, older people could get a credit that is up to twice as large as younger people — but the House bill allows insurers to charge premiums that are five times higher than they charge younger people, based solely on age. The House bill’s tax credits would be the same regardless of local premium costs and would generally be the same regardless of income (although they would phase out at higher income levels).
Collectively, these factors would increase net premiums for many people (that is, the share of the premium that consumers must pay) and disproportionately hurt rural consumers. In fact, 12 of the 15 states that would face the steepest percentage declines in the value of the tax credits have significant rural populations (see Appendix Table 2). For example, in Wyoming, where rural residents constitute a higher share of marketplace enrollees than in any other state (78 percent), the average enrollee would get nearly $4,300 less in tax credits under the House bill than under current law, a 60 percent drop.[17]
Even within a given state, rural consumers would often fare worse than urban ones, county-level data from the Kaiser Family Foundation show. In urban Memphis (Shelby County), Tennessee, a 40-year-old earning $30,000 would get a $3,000 tax credit under the House plan, or $410 less than under current law. But in the rural counties to the north, like Gibson or Madison County, that $3,000 credit would be $3,300 less than the ACA would provide — more than doubling premiums for those residents.[18]
Moreover, the ACA’s tax credits — unlike the House bill’s tax credits — increase as needed to largely shield low- and moderate-income consumers from annual premium increases. For example, in 2017, pre-credit premiums rose significantly from the previous year, but net premiums among the roughly 85 percent of consumers eligible for tax credits stayed exactly the same, averaging $106 per month.[19] Under the House plan, the tax credits would grow at the rate of inflation plus 1 percentage point, no matter how quickly premiums rose in a particular year or in a consumer’s area. As a result, CBO estimates that average tax credits for subsidized consumers would fall by 40 percent by 2020 and by 50 percent by 2026.
Rural areas also tend to have older residents, so they would be particularly harmed by the House bill’s inadequate adjustment for age. For example, a 60-year-old in Maine with an income of $22,000 would pay premiums of $1,183 per year after receiving a premium tax credit of more than $10,400, the balance of the cost for a benchmark plan. Under the House bill, that older consumer would pay premiums of more than $10,000 a year after receiving a tax credit of just $4,000. (See Appendix Table 3.)
In addition to higher premiums, the House bill would greatly increase consumers’ out-of-pocket costs by repealing the ACA’s cost-sharing subsidies, which are available to people with incomes below 250 percent of the poverty line (about $30,000 for a single person, or about $60,000 for a family of four). Under current law, almost 60 percent of marketplace consumers qualify for these subsidies, which entitle them to purchase coverage with lower deductibles and other out-of-pocket costs. Without these subsidies, the national average marketplace deductibles would increase by about $2,800 for single people with incomes below $18,000, by about $2,300 for single people with incomes between $18,000 and $24,000, and by about $600 for single people with incomes between $24,000 and $30,000.[20] The result is that many lower-income people in rural areas would have difficulty paying the deductibles and other cost-sharing necessary to use their coverage. And at the same time people will lose important cost-sharing help, other parts of the bill would increase deductibles.
Appendix Table 4 shows the combined impact of the House bill’s increases in net premiums and out-of-pocket costs. Marketplace consumers in every state would see higher costs, on average, with large differences across states. Twelve of the 15 states with total out-of-pocket cost increases greater than $4,000 have significant rural populations. (See Figure 2.) Eight rural states (Alaska, North Carolina, Oklahoma, Alabama, West Virginia, Wyoming, Nebraska, and Tennessee) would see increases of more than $5,000. In Alaska, total costs for marketplace consumers would go up by $12,600, on average. While higher-income and younger consumers would see lower-than-average increases, or cost decreases, many lower-income and older consumers would see even larger increases than their state averages.
High Rates of Chronic Disease in Rural Areas May Further Increase Premiums
The large increases in out-of-pocket costs described above would occur because of the House bill’s large cuts to premium tax credits and cost-sharing reductions and because it eliminates the ACA’s individual mandate and allows insurers to charge older consumers up to five times more in premiums than younger consumers. But changes made to the House bill shortly before passage made an already harmful bill even worse for people in rural America.
As a result of these changes, the version of the bill passed by the House removes key protections that the ACA put in place nationwide to enable people with pre-existing conditions to get affordable coverage that provides the health services they need.[21] Under the House bill, decisions about whether to keep these protections would once again be left up to states — most of which did not have protections for people with pre-existing conditions, or benefit requirements, before the ACA.[22]
Charging people the full cost of their pre-existing conditions could mean annual surcharges of $140,510 for people with metastatic cancer, $17,060 for pregnant women, and $8,370 for those with a history of depression, according to the Center for American Progress.[23] It could also mean plans could go back to excluding key services. Before the ACA, plans frequently excluded coverage for services like maternity care, mental health services, substance use disorder treatment, or prescription drugs.[24] This means that even if people with pre-existing conditions could afford their premiums, their health insurance might exclude the treatment they need.
Rural populations tend to be older and sicker than urban populations. For example, people in rural areas are more likely to die from heart disease, cancer, unintentional injury, chronic lower respiratory disease, and stroke than their urban counterparts.[25] For these reasons, rural residents likely benefited disproportionately from the ACA’s protections against discrimination based on medical history — and they could be disproportionately harmed by removing those protections, as well as by the other major provisions of the House bill.
| APPENDIX TABLE 1 | |||
|---|---|---|---|
| Nearly 1.7 Million Rural Residents Have Health Coverage Through the Medicaid Expansion | |||
| State | Estimated percent of expansion enrollees who live in rural areas | Estimated number of expansion enrollees living in rural areas | |
| United States | 15% | 1.7 million | |
| Alaska | 38% | 5,500 | |
| Arizona | 10% | 11,600 | |
| Arkansas | 47% | 130,900 | |
| California | 3% | 97,500 | |
| Colorado | 21% | 87,500 | |
| Connecticut | 3% | 6,700 | |
| Hawaii | 27% | 8,600 | |
| Illinois | 14% | 94,100 | |
| Indiana | 20% | 49,000 | |
| Iowa | 44% | 61,600 | |
| Kentucky | 50% | 223,700 | |
| Louisiana | 17% | 72,400 | |
| Maryland | 4% | 10,100 | |
| Michigan | 19% | 113,800 | |
| Minnesota | 24% | 53,900 | |
| Montana | 63% | 29,300 | |
| Nevada | 13% | 27,200 | |
| New Hampshire | 48% | 25,200 | |
| New Jersey | 0% | ||
| New Mexico | 35% | 85,900 | |
| New York | 7% | 18,200 | |
| Ohio | 21% | 135,800 | |
| Oregon | 19% | 92,700 | |
| Pennsylvania | 13% | 85,700 | |
| Rhode Island | 0% | ||
| Washington | 13% | 75,300 | |
| West Virginia | 43% | 76,900 | |
| APPENDIX TABLE 2 | ||||
|---|---|---|---|---|
| Most States With Biggest Cuts in Premium Tax Credits Under House Bill Have Significant Rural Populations | ||||
| Share of Marketplace Consumers Living in Rural Areas | ACA Credit for Average Enrollee | AHCA Credit for Average Enrollee | Percent Difference | |
| Alaska | 51% | $13,386 | $2,869 | -79% |
| North Carolina | 25% | 8,411 | 2,865 | -66% |
| Oklahoma | 37% | 7,758 | 2,868 | -63% |
| Alabama | 28% | 7,312 | 2,912 | -60% |
| Nebraska | 51% | 7,292 | 2,801 | -62% |
| Wyoming | 78% | 7,114 | 2,840 | -60% |
| West Virginia | 41% | 7,425 | 3,084 | -58% |
| Tennessee | 27% | 7,112 | 2,953 | -58% |
| Arizona | 10% | 6,501 | 2,841 | -56% |
| South Dakota | 64% | 6,295 | 2,810 | -55% |
| Montana | 74% | 6,401 | 2,952 | -54% |
| South Carolina | 19% | 5,844 | 2,911 | -50% |
| Louisiana | 15% | 5,926 | 2,914 | -51% |
| Maine | 57% | 5,592 | 2,957 | -47% |
| Iowa | 46% | 5,710 | 3,024 | -47% |
| Total - HealthCare.gov states | 18% | 5,104 | 2,935 | -43% |
| APPENDIX TABLE 3 | ||||
|---|---|---|---|---|
| Cost Increase for 60-Year-Old Enrollee With Income of $22,000, by Rural Share | ||||
| Net Premium | ||||
| Share of Marketplace Consumers Living in Rural Areas | ACA | AHCA | Premium Increase | |
| Wyoming | 78% | $1,183 | $14,255 | $13,073 |
| Montana | 74% | 1,183 | 12,841 | 11,658 |
| South Dakota | 64% | 1,183 | 12,531 | 11,349 |
| North Dakota | 61% | 1,183 | 8,730 | 7,547 |
| Maine | 57% | 1,183 | 10,012 | 8,829 |
| Mississippi | 53% | 1,183 | 8,067 | 6,884 |
| Nebraska | 51% | 1,183 | 14,167 | 12,984 |
| Alaska | 51% | 784 | 29,593 | 28,810 |
| Iowa | 46% | 1,183 | 9,614 | 8,431 |
| Kentucky | 45% | 1,183 | 7,448 | 6,266 |
| New Hampshire | 43% | 1,183 | 5,680 | 4,497 |
| West Virginia | 41% | 1,183 | 13,062 | 11,879 |
| Arkansas | 40% | 1,183 | 6,962 | 5,779 |
| Oklahoma | 37% | 1,183 | 14,742 | 13,559 |
| Wisconsin | 37% | 1,183 | 9,437 | 8,255 |
| APPENDIX TABLE 4 | ||||
|---|---|---|---|---|
| Most States With Biggest Increases in Total Out-of-Pocket Costs Under House Bill Have Significant Rural Populations | ||||
| Share of Marketplace Consumers Living in Rural Areas | Net Premium Increase | Cost-Sharing Increase | Increase in Total Costs | |
| Alaska | 51% | $11,106 | $1,493 | $12,599 |
| North Carolina | 25% | 5,921 | 1,628 | 7,549 |
| Oklahoma | 37% | 5,241 | 1,096 | 6,337 |
| Alabama | 28% | 4,725 | 1,604 | 6,329 |
| West Virginia | 41% | 4,738 | 1,387 | 6,125 |
| Wyoming | 78% | 4,622 | 1,314 | 5,936 |
| Nebraska | 51% | 4,828 | 935 | 5,763 |
| Tennessee | 27% | 4,491 | 1,218 | 5,709 |
| Arizona | 10% | 4,006 | 921 | 4,927 |
| South Dakota | 64% | 3,791 | 1,130 | 4,921 |
| Louisiana | 15% | 3,325 | 1,498 | 4,823 |
| South Carolina | 19% | 3,223 | 1,395 | 4,618 |
| Montana | 74% | 3,778 | 828 | 4,606 |
| Mississippi | 53% | 2,573 | 1,554 | 4,127 |
| Maine | 57% | 2,928 | 1,086 | 4,014 |
| Missouri | 28% | 2,819 | 1,133 | 3,952 |
| Florida | 3% | 2,465 | 1,462 | 3,927 |
| Iowa | 46% | 2,983 | 926 | 3,909 |
| Delaware | 22% | 2,742 | 1,131 | 3,873 |
| Pennsylvania | 13% | 2,687 | 1,118 | 3,805 |
| Georgia | 14% | 2,266 | 1,327 | 3,593 |
| Wisconsin | 37% | 2,425 | 1,089 | 3,514 |
| Kansas | 34% | 2,422 | 1,005 | 3,427 |
| Hawaii | 37% | 1,797 | 1,391 | 3,188 |
| Illinois | 13% | 1,901 | 853 | 2,754 |
| New Jersey | 1% | 1,637 | 1,103 | 2,740 |
| Texas | 12% | 1,700 | 987 | 2,687 |
| Virginia | 13% | 1,491 | 1,014 | 2,504 |
| North Dakota | 61% | 1,286 | 835 | 2,121 |
| Nevada | 10% | 1,091 | 913 | 2,005 |
| Oregon | 22% | 1,313 | 687 | 2,000 |
| Arkansas | 40% | 871 | 998 | 1,869 |
| Kentucky | 45% | 822 | 982 | 1,804 |
| Utah | 15% | 745 | 836 | 1,582 |
| Michigan | 23% | 684 | 834 | 1,519 |
| Ohio | 22% | 406 | 710 | 1,116 |
| Indiana | 25% | 314 | 749 | 1,064 |
| New Mexico | 31% | 293 | 663 | 956 |
| New Hampshire | 43% | -264 | 575 | 310 |
| Total - HealthCare.gov states | 18% | 2,439 | 1,170 | 3,609 |
End Notes
[1] Based on the CBO analysis of an earlier version of the House-passed bill. Congressional Budget Office, Letter to Speaker Paul Ryan, March 23, 2017, https://www.cbo.gov/system/files/115th-congress-2017-2018/costestimate/hr1628.pdf.
[2] Michael Karpman et al., “Substantial Gains in Health Insurance Coverage Occurring for Adults in Both Rural and Urban Area,” Urban Institute, April 16, 2015, http://hrms.urban.org/quicktakes/Substantial-Gains-in-Health-Insurance-Coverage-Occurring-for-Adults-in-Both-Rural-and-Urban-Areas.html.
[3] Julia Foutz, Samantha Artiga, and Rachel Garfield, “The Role of Medicaid in Rural America,” Kaiser Family Foundation, April 25, 2017, http://kff.org/medicaid/issue-brief/the-role-of-medicaid-in-rural-america/. Definitions of “rural” differ. The CBPP analysis defines rural as not living in a metropolitan county. This is the definition used by the Office of Management and Budget. KFF based its estimates on analysis of American Community Survey data from 2013-2015. Rural areas were defined using the 2010 Index of Relative Rurality measure, and the population quintile with the highest degree of rurality is referred to as “rural” and that with the lowest degree of rurality is referred to as “urban.” For a full description of KFF’s methodology, see its report.
[4] Benjamin Sommers, Robert Blendon, and E. John Orav, “Both The ‘Private Option’ And Traditional Medicaid Expansions Improved Access To Care For Low-Income Adults,” Health Affairs, January 2016, http://content.healthaffairs.org/content/35/1/96.abstract.
[5] Jesse Cross-Call, “Medicaid at 50: Kentucky's Experience Highlights Benefits of Medicaid Expansion,” Center on Budget and Policy Priorities, July 23, 2015, https://www.cbpp.org/blog/medicaid-at-50-kentuckys-experience-highlights-benefits-of-medicaid-expansion.
[6] Peggy Bailey, “ACA Repeal Would Jeopardize Treatment for Millions with Substance Use Disorders, Including Opioid Addiction,” Center on Budget and Policy Priorities, February 9, 2017, https://www.cbpp.org/research/health/aca-repeal-would-jeopardize-treatment-for-millions-with-substance-use-disorders.
[7] For more information about Medicaid’s role in rural America prior to the ACA taking effect, see Center on Budget and Policy Priorities, “Rural America Will Benefit from Medicaid Expansion,” June 7, 2013, https://www.cbpp.org/sites/default/files/atoms/files/Fact-Sheet-Rural-America.pdf.
[8] Council of Economic Advisers, “The Economic Record of the Obama Administration: Reforming the Health Care System,” December 2016, https://obamawhitehouse.archives.gov/sites/default/files/page/files/20161213_cea_record_healh_care_reform.pdf.
[9] Brystana Kaufman et al., “Medicaid Expansion Affects Rural and Urban Hospitals Differently,” Health Affairs, May 2017, http://content.healthaffairs.org/content/35/9/1665.abstract.
[10] Fredric Blavin, “How Has the ACA Changed Finances for Different Types of Hospitals? Updated Insights from 2015 Cost Report Data,” Urban Institute, April 2017, http://www.urban.org/sites/default/files/publication/89446/2001215-how-has-the-aca-changed-finances-for-different-types-of-hospitals.pdf.
[11] Sharita Thomas et al., “A Comparison of Closed Rural Hospitals and Perceived Impact,” North Carolina Rural Health Research Program, April 2015, http://www.shepscenter.unc.edu/wp-content/uploads/2015/04/AfterClosureApril2015.pdf. See also an updated list of rural hospital closures: http://www.shepscenter.unc.edu/programs-projects/rural-health/rural-hospital-closures/.
[12] For more information about the AHCA’s impact on the Medicaid program, see Center on Budget and Policy Priorities, “House Health Care Bill Ends Medicaid as We Know It,” May 9, 2017, https://www.cbpp.org/research/health/house-health-care-bill-ends-medicaid-as-we-know-it.
[13] Congressional Budget Office, Letter to Speaker Paul Ryan, March 23, 2017, https://www.cbo.gov/system/files/115th-congress-2017-2018/costestimate/hr1628.pdf.
[14] This includes only the enrollees in the 39 HealthCare.gov states. Centers for Medicare & Medicaid Services, Press Release, Health Insurance Marketplaces 2017 Open Enrollment Period Final Enrollment Report: November 1, 2016 – January 31, 2017, March 15, 2017, https://www.cms.gov/Newsroom/MediaReleaseDatabase/Fact-sheets/2017-Fact-Sheet-items/2017-03-15.html.
[15] Abigail Barker et al., “Health Insurance Marketplaces: Premium Trends in Rural Areas,” Center for Rural Policy Analysis, May 2016, http://cph.uiowa.edu/rupri/publications/policybriefs/2016/HIMs%20rural%20premium%20trends.pdf.
[16] CBPP analysis of the Census Bureau’s 2015 American Community Survey, and Foutz, Artiga, and Garfield.
[17] Our analysis uses the same methods as our earlier paper on the effect of the Republican plan in the states that use the HealthCare.gov platform. See Aviva Aron-Dine and Tara Straw, “House GOP Health Bill Still Cuts Tax Credits, Raises Costs by Thousands of Dollars for Millions of People,” Center on Budget and Policy Priorities, March 22, 2017, https://www.cbpp.org/research/health/house-gop-health-bill-still-cuts-tax-credits-raises-costs-by-thousands-of-dollars. The percentage of rural marketplace enrollees is from the Centers for Medicare & Medicaid Services 2017 Marketplace Open Enrollment Period Public Use Files, May 11, 2017, https://www.cms.gov/Research-Statistics-Data-and-Systems/Statistics-Trends-and-Reports/Marketplace-Products/Plan_Selection_ZIP.html.
[18] Kaiser Family Foundation, “Premiums and Tax Credits Under the Affordable Care Act vs. the American Health Care Act: Interactive Maps,” April 27, 2017, http://kff.org/interactive/tax-credits-under-the-affordable-care-act-vs-replacement-proposal-interactive-map/.
[19] Center for Medicare & Medicaid Services, “Health Insurance Marketplaces 2017 Open Enrollment Period Final Open Enrollment Report,” March 15, 2017, https://www.cms.gov/Newsroom/MediaReleaseDatabase/Fact-sheets/2017-Fact-Sheet-items/2017-03-15.html.
[20] Commonwealth Fund, “The ACA’s Cost-Sharing Reduction Plans: A Key to Affordable Health Coverage for Millions of U.S. Workers,” October 13, 2016, http://www.commonwealthfund.org/publications/issue-briefs/2016/oct/aca-cost-sharing-reduction-plans.
[21] Aviva Aron-Dine, Edwin Park, and Jacob Leibenluft, “Amendment to House ACA Repeal Bill Guts Protections for People with Pre-Existing Conditions,” Center on Budget and Policy Priorities, April 27, 2017, https://www.cbpp.org/research/health/amendment-to-house-aca-repeal-bill-guts-protections-for-people-with-pre-existing.
[22] Center on Budget and Policy Priorities, “The House-Passed Bill Can’t Be Fixed,” revised May 10, 2017, https://www.cbpp.org/research/health/the-house-passed-health-bill-cant-be-fixed.
[23] Sam Berger and Emily Gee, “Latest ACA Repeal Plan Would Explode Premiums for People with Pre-existing Conditions,” Center for American Progress, April 20, 2017, https://www.americanprogress.org/issues/healthcare/news/2017/04/20/430858/latest-aca-repeal-plan-explode-premiums-people-pre-existing-conditions/.
[24] Sarah Lueck, “Eliminating Federal Protections for People with Health Conditions Would Mean Return to Dysfunctional Pre-ACA Individual Market,” Center on Budget and Policy Priorities, May 3, 2017, https://www.cbpp.org/research/health/eliminating-federal-protections-for-people-with-health-conditions-would-mean-return.
[25] Centers for Disease Control & Prevention, “Rural Health Basics,” March 15, 2017, https://www.cdc.gov/ruralhealth/ruralhealthbasics.html.
More from the Authors

Areas of Expertise

Areas of Expertise

Areas of Expertise