A Case for Full Employment: Underemployment, the Falling NAIRU and the Costs of Excess Slack
This report was commissioned by the Center on Budget and Policy Priorities’ Full Employment Project. Views expressed within the report do not necessarily reflect the views of the Center.
Conventional economic wisdom holds that labor market slack and inflation rates have a persistent, negative relationship — as unemployment falls, both wage inflation and subsequently price inflation are expected to rise more quickly. Economists refer to the relationship between labor market slack and wage growth as the “Wage Phillips Curve” and the relationship between slack and price growth as the “Price Phillips Curve.” The Wage Phillips Curve illustrates that lower unemployment rates encourage firms to attract and compete for workers by persistently raising nominal wages, and the Price Phillips Curve shows how higher labor costs for firms during periods of low unemployment are passed onto consumers through increasingly higher prices for goods and services. Phillips Curve models can therefore be used to determine the lowest level of unemployment consistent with stable prices. This ideal unemployment rate is known as the natural rate of unemployment or the NAIRU (non-accelerating inflation rate of unemployment) and up until recently has been generally assumed to fall between 4 and 6 percent. Phillips Curve models are a staple of macroeconomics courses at universities across the world, and most importantly, serve as policy guideposts for monetary policy makers at central banks across the globe.
But if these well-known models accurately describe the relationship between inflation rates and labor market slack, why are the United States and other advanced economies experiencing such slow to modest wage growth as national unemployment rates keep dropping lower and lower? Our analysis of the U.K.’s economy finds that part of the explanation for weak wage growth is that there is more slack in the U.K. labor market than the unemployment rate suggests. This excess slack is better captured by underemployment rates, which can be measured in a variety of ways but broadly capture the number of workers placed in jobs below their qualifications. In addition, structural shifts in the U.K.’s economy have driven the NAIRU lower than it used to be, so lower levels of unemployment and underemployment are needed to produce meaningful wage growth.
Furthermore, our research on the significant psychological and emotional costs associated with unemployment and underemployment in the U.K. reaffirms the importance of pushing labor market slack to the lowest possible levels. When a variety of average well-being scores are broken down by labor force groups, the unemployed consistently have the lowest scores (aside from the sick or disabled) and underemployed workers have consistently lower scores than full-time or voluntary part-time workers. Additionally, rates of depression are growing more quickly for the underemployed than for any other groups of workers. Low unemployment rates across the U.K. mean little if many workers are facing the economic insecurity, lack of fulfillment, and subsequent depression and anxiety that accompany underemployment. A strong labor market that has truly reached full employment would not only ensure that as few workers as possible are unemployed, but also that as few workers as possible face underemployment.
Explanations for Slow-to-Modest Wage Growth: Underemployment and the Falling NAIRU[1]
Underemployment and Lack of Wage Growth
Policymakers at the Bank of England’s Monetary Policy Committee (MPC) have been expecting wage growth to take off for years, but their forecasts consistently over-estimated wage growth from 2014 to mid-2019.[2] The MPC have repeatedly failed to accurately predict wage growth and the natural rate of unemployment because they primarily focus on unemployment, and largely ignore underemployment, when constructing their forecasts.
Underemployment can be defined and measured in a variety of ways. One metric of underemployment is the share of involuntary part-time workers in total employment, or the involuntary part-time rate (IPTR). In the United States, this population of workers is classified as “part-time for economic reasons.” This measure only captures the number of part-time workers who want to work full-time. It carries no information on the exact number of additional hours these workers wish to work, nor if other groups of workers, including voluntary part-timers and full-timers, would prefer to increase their hours. To address the limitations of standard measures, we have developed (and use in much of our analyses) a more comprehensive measure of underemployment that accounts for the aggregate number of additional hours that workers would prefer to work.[3]
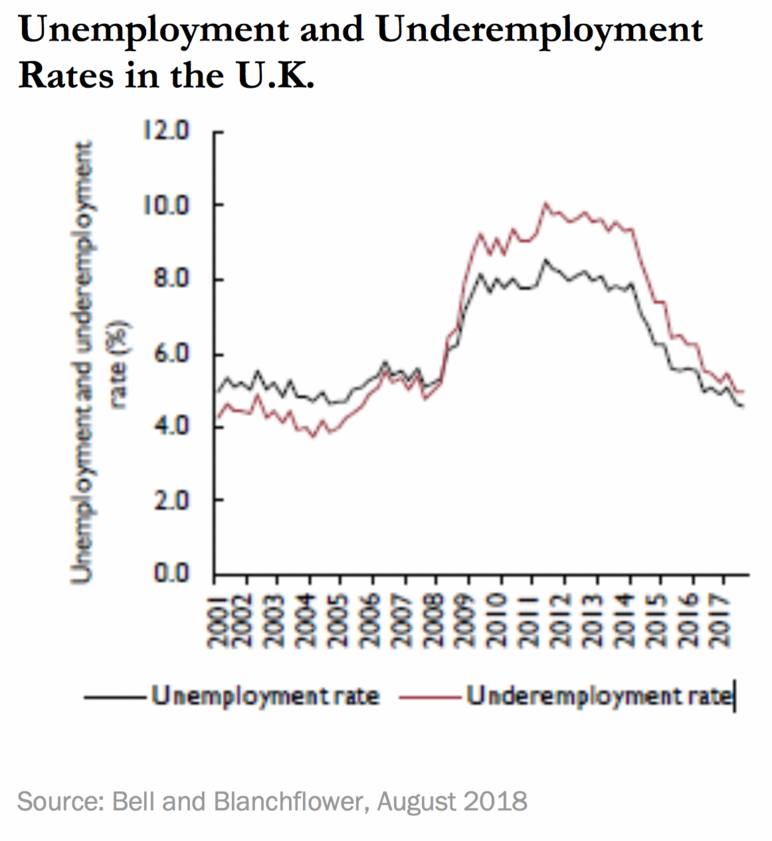
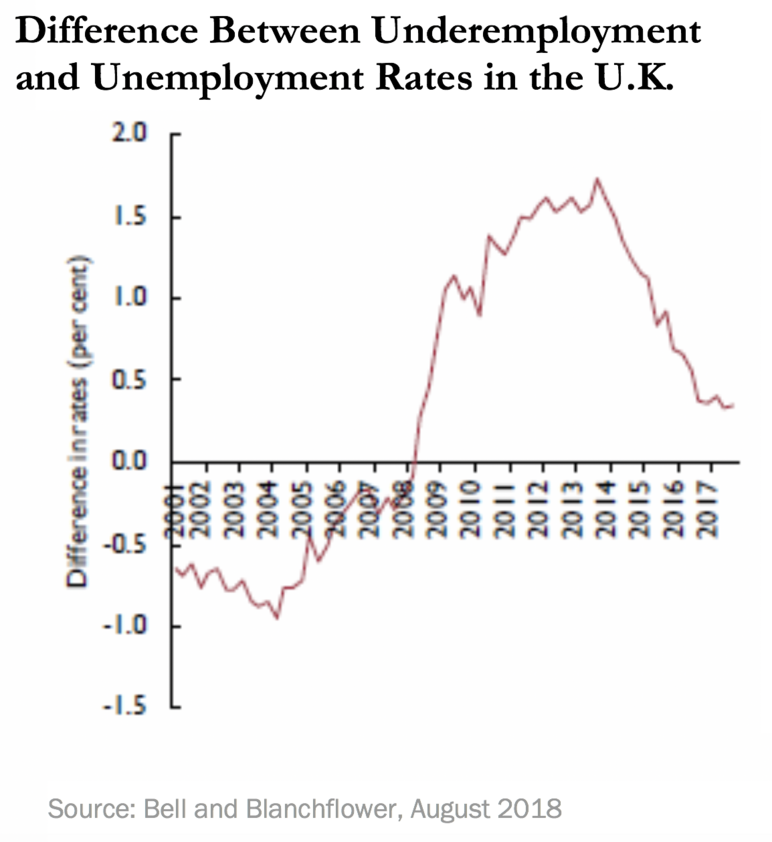
While unemployment has already returned to its pre-recession levels in the U.K., underemployment (as quantified by our hours-based index) remains higher than its pre-recession levels (see Figure 1) and has remained persistently higher than unemployment throughout the recovery (see Figure 2). It should be noted that during the pre-recession period, the number of workers who wanted more hours was less than the number who wanted fewer hours. This is unusual, given that underemployment historically has disappeared as labor markets tightened. Rates of underemployment that have remained persistently higher than unemployment rates since the Great Recession suggest that there have been significantly higher amounts of slack in the U.K.’s labor market than traditionally assumed.
Data on self-employment provides further evidence that underemployment is generating much more labor market slack in the U.K. than suggested by unemployment rates alone. As an economy moves toward full employment, opportunities should increasingly present themselves for underemployed workers who want more hours and overemployed workers who want fewer hours to overcome their hours constraints. One possibility for those who want more hours is to obtain a second job - a further possibility would be for employees to switch to self-employment, where they could choose their own hours. Therefore, if the economy was truly closing in on full employment, we would expect to see rising shares of workers that are either self-employed or working more than one job.
However, there is no evidence of any rise in multiple-job-holding in the U.K. over the last decade, and the share of self-employed workers has recently started to decline. In April 2008, there were 1.1 million workers with more than one job (representing 4.35 percent of total employment). This figure remains essentially unchanged over a decade later, as there were also 1.1 million workers with more than one job (at 4.07 percent of total employment) as of February 2019. Furthermore, while the self-employed share of total employment increased from 13.1 percent in April 2008 to 15.1 percent in September 2016, it remained unchanged through February 2019. If the U.K. was close to full employment, we would expect to see evidence from both self-employment and multiple-job-holding that the underemployed were starting to move their actual hours closer to their desired hours — but no such moves are apparent in the data. Clearly, underemployment is contributing substantially to labor market slack, and there is considerable evidence that such slack is dragging down wage growth.
Recent research supports the contention that underemployment has been significantly slowing down wage growth. For example, Hong et al. (2018) studied the relationship between labor market slack and wage growth in 29 advanced countries, and they found that “involuntary part-time employment appears to have weakened wage growth even in economies where headline unemployment rates are now at or below their averages in the years leading up to the recession.”[4] These authors shared their data with us, and we find that a 1 percentage point increase in the involuntary part-time rate is associated with a 0.14 percentage point decline in nominal wage growth. This effect is greater than the effect of the unemployment rate on wages.
Further analysis of wage growth and underemployment within the U.K. demonstrates that it is vital for monetary policymakers to take underemployment into account when estimating wage equations. Using microdata from the U.K.’s Labor Force Survey for 2001 to 2017, we are unable to find any significant unemployment effects on wage growth, but we do find underemployment effects on both weekly and hourly nominal pay. Table 1 displays our regression results, with T-statistics in parentheses. We estimate this as a wage curve, with log hourly and weekly pay in period “t” as the dependent variables, and log unemployment, log underemployment (the number of additional hours the underemployed would like to work), and log wages on a four-quarter lag as independent variables. If the data followed a classic Phillips curve, the lagged wage variable would have a coefficient of one, but it does not.[5]
In Table 1, the first column under hourly pay and weekly pay shows results from regressing each pay measure on unemployment, lagged pay, and several control variables, and we find the unemployment rate’s coefficient is statistically insignificant. The second column under each pay measure includes the underemployment measure in the regression. We find that the coefficient on underemployment is both negative and statistically significant and remains significant even when we drop the unemployment rate variable from the regression, as shown in the third and sixth columns. These results demonstrate that in recent decades, underemployment has had a stronger relationship with wage growth than unemployment, and that the Phillips curve in the U.K. must therefore be rewritten into the wage/underemployment space.
| TABLE 1 | ||||||
|---|---|---|---|---|---|---|
| Time Series Log Wage Equations (Quarterly), U.K. Panel Data | ||||||
| Hourly Pay | Weekly Pay | |||||
| Log Wage(t-4) | 0.0999 (3.43) | 0.0991 (3.41) | 0.0990 (3.41) | 0.0941 (3.19) | 0.0922 (3.14) | 0.0918 (3.13) |
| Log Unemployment Rate(t-1) | 0.0092 (0.72) | 0.0140 (1.10) | 0.0089 (0.68) | 0.0140 (1.08) | ||
| Log Underemployment (# Extra Hours Wanted) | –.0417 (3.02) | –0.0398 (2.91) | –0.0446 (3.18) | –0.0428 (3.07) | ||
| Constant | 1.8898 | 1.8496 | 1.8784 | 5.1576 | 5.1234 | 5.1544 |
| Adjusted R2 | 0.9201 | 0.9206 | 0.9206 | 0.9195 | 0.9201 | 0.9201 |
| N | 1260 | 1260 | 1260 | 1260 | 1260 | 1260 |
The Falling NAIRU
It is clear that the unemployment rate fails to fully explain the level of slack prevailing in most OECD countries since the Great Recession, and that underemployment is an important component of slack that has contributed to sluggish wage growth. However, given that falling underemployment in both the U.K. and the U.S. throughout 2018 has not jumpstarted wage growth, it seems that underemployment alone cannot explain low levels of wage growth. A further possibility exists, namely that there has been a structural shift in the U.K. economy such that the natural rate of unemployment, or the NAIRU, has shifted downwards.
As Milton Friedman famously argued, the NAIRU is a flexible rate that can change over time depending upon various factors. Rather than being “immutable or unchangeable,” the natural rate of unemployment can change depending on factors like the strength of union power, the size of the minimum wage, and information improvements in labor exchanges.[6] Former Chair of the U.S. Federal Reserve, Janet Yellen, also suggested that the natural rate has fallen during a speech in September 2017: “some key assumptions underlying the baseline outlook could be wrong in ways that imply that inflation will remain low for longer than currently projected […] the long-run sustainable unemployment rate can drift over time because of demographic changes and other factors, some of which can be difficult to quantify in real time.”[7]
There are a number of reasons why the relationship between labor market slack and wage growth has weakened over time in the U.K. and in other advanced economies. One major factor is the steady erosion of worker bargaining power — private sector union membership in the U.K. has fallen from about 50% in 1979 to about 13% in 2016.[8] As worker bargaining power has diminished, the power of large employers has increased as revealed by the rise of “monopsony” conditions in key sectors, meaning a level of firm concentration within industries that allows dominant employers to fend off market-driven wage pressures. Other long-term factors, including globalization, technological change biased against non-college educated workers, and the erosion of key labor standards and protections are also contributing to the weakened relationship between diminished slack and faster wage growth.
MPC Member Gertjan Vlieghe and others have argued against a flattening Phillips Curve in the U.K., and by extension against a lower NAIRU, by pointing to the solidly inverse relationship of monthly wage growth and unemployment from 2001 to 2018.[9] Figure 3 plots 3-month/3-month nominal growth in average weekly earnings and the monthly unemployment rates from 2001 to 2018, and the trendline for the data clearly slopes downwards. The slope of the best-fit line is over
-0.7, suggesting a strongly negative relationship between unemployment rates and wage inflation and therefore displaying a classic Phillips curve.
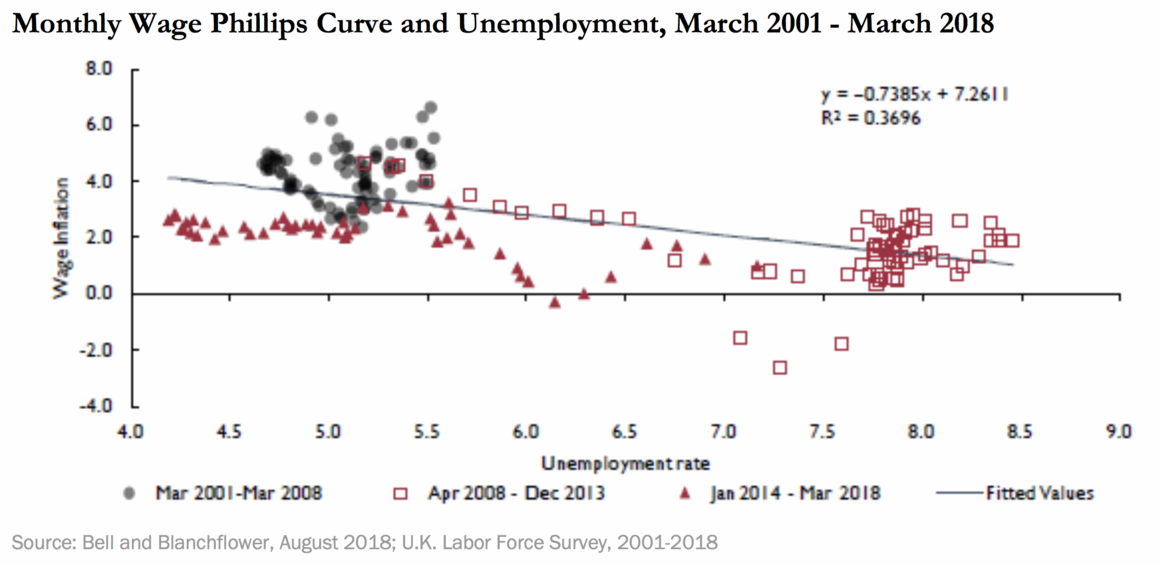
However, it is clear from Figure 3 that there are three areas in the data with trends that are markedly different from each other, and these areas have datapoints that are marked as circles, triangles, and squares. The area plotted as circles represents the pre-recession zone (March 2001 – March 2008), the area plotted with triangles represents the recession/ post-recession zone (April 2008 – December 2013), and the area plotted with squares represents the recovery zone (January 2014 – March 2018). To better understand how the relationship between unemployment and wage inflation changes over time, we calculate three best-fit wage Phillips Curve equations separately for the pre-recession, recession, and recovery zones (see Table 2). For simplicity, the recession months of April 2008 – May 2009 are excluded from the best-fit equations because of several significant outlier months. We find that the lines for the pre-recession zone and the post-recession zone are positively sloping rather than negatively sloping, meaning that higher unemployment rates were associated with higher wage inflation during those periods. The recovery zone looks more like a standard, negatively sloping Phillips curve such that lower unemployment rates are associated with higher wage inflation, but the slope of the line is lower than the slope of the overall trendline for the data.
| TABLE 2 | |
|---|---|
| Best-Fit Equations for U.K. Unemployment and Wage Inflation, 2001-2018 | |
| Time Period | Best-Fit Equation |
| 2001-2018 | Wage Change = 7.1204 – 0.7181*Unemployment Rate |
| Pre-Recession Zone (April 2001-March 2008) | Wage Change = 2.4479 + 0.3580*Unemployment Rate |
| Post-Recession Zone (June 2009 – December 2013) | Wage Change = -5.9831 + 0.9574*Unemployment Rate |
| Recovery Zone (January 2014 – March 2018) | Wage Change = 5.2993 – 0.6168*Unemployment Rate |
The equation for the recovery zone’s best-fit line has significantly more predictive power than the equation for the overall data’s best-fit line when forecasting wage growth. For example, the recovery zone’s best-fit line equation produces a much more accurate forecast of wage growth for April 2018 than the overall data’s best-fit line. Wages grew 2.6% in April 2018 and plugging that month’s unemployment rate into the recovery zone’s best-fit equation produces a very close wage growth forecast of 2.7%, while the overall data’s equation produces a higher and more inaccurate wage growth estimate of 4.1%. This shows how the relationship between wage inflation and unemployment has weakened over time and that when measured correctly, the Phillips curve in the U.K. has clearly flattened. If lower and lower unemployment rates are needed to put upward pressure on wages, the natural rate of unemployment must be falling over time and must currently be lower than traditional estimates assume.
Underemployment and the Falling NAIRU
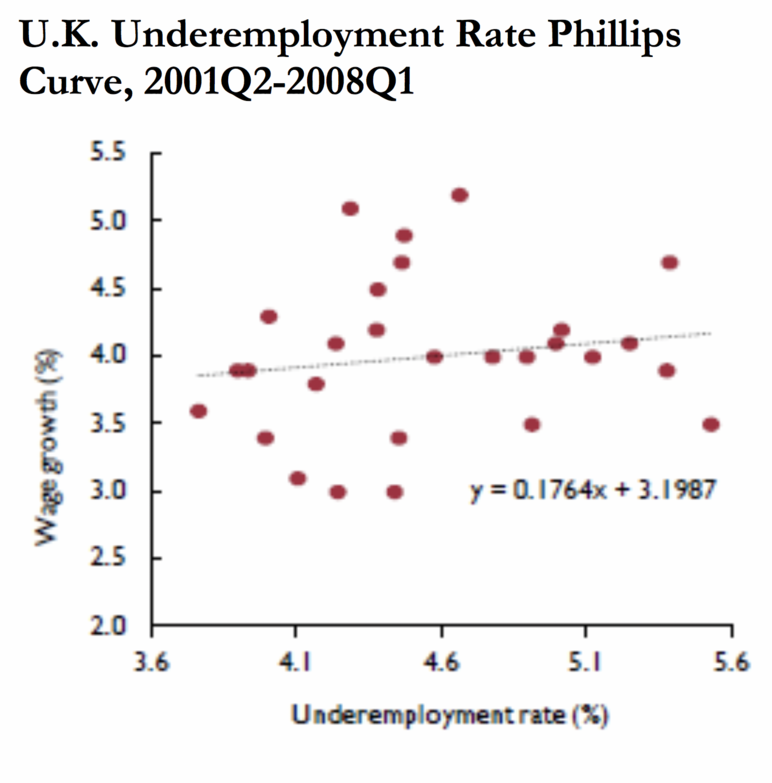
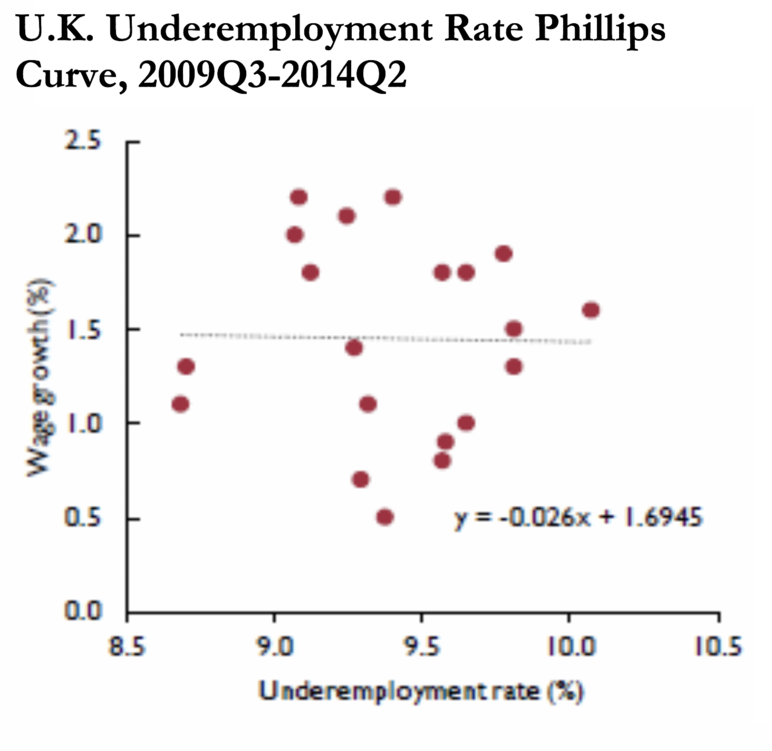
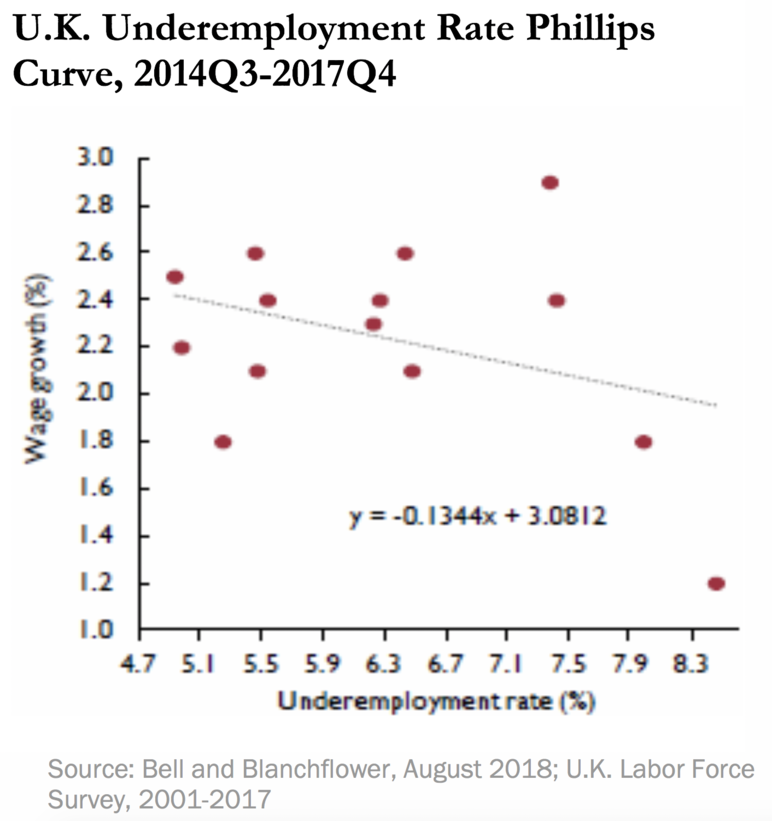
The same trend holds when underemployment is used as a measure of labor market slack, instead of unemployment. When quarterly nominal wage growth and our hours-based underemployment index are plotted from 2001 to 2017, the best-fit line for the data has a strongly negative slope of roughly -0.5. However, when broken into pre-recession, post-recession, and recovery zones, the trend lines diverge substantially. Figures 4A-4C visualize the scatter plots and best-fit equations for each zone’s wage growth and underemployment data. The pre-recession zone’s best-fit line once again has a positive slope, the post-recession zone’s best-fit line has a very slightly negative slope of
-0.026, and the recovery zone’s best-fit line has a negative slope of -0.134 that is still much lower than the slope across the entire data. Even when underemployment is chosen as the measure of slack, the Phillips curve still appears to have flattened in recent years, demonstrating that the natural rate must have fallen as well.
With sluggish wage growth even at a time of low unemployment, it is clear that the unemployment rate should not be the sole measure of slack in the U.K.’s labor market. Our findings suggest that underemployment is even more important than unemployment in explaining the weakness of wage growth during the ongoing economic recovery. Furthermore, there is every reason to believe that the natural rate of unemployment has fallen sharply since the Great Recession, and that the unemployment rate could go even lower than previously assumed — perhaps even below 3 percent — before there is an equivalent increase in wage growth. This conclusion is borne out in the most recent data — even though the U.K.’s unemployment rate fell as low as 3.8% in February 2019, average weekly earnings growth was a weak 1.7% in the private sector. In our view, the NAIRU in the U.K. may well be nearer to 3 percent, and even below it, than around 5 percent which other commentators, including the MPC, seem to believe.
What About the United States?[10]
Our results for the United States tell a similar story as our results for the United Kingdom — in the U.S., the relationship between labor market slack and wage growth has weakened over time, and underemployment once again has a stronger relationship to wage growth than unemployment. Unfortunately, it is not possible to construct an hours-based measure of underemployment using U.S. data, so we calculate the PTER rate from the Bureau of Labor Statistics. This rate expresses the number of workers who are working “part-time for economic reasons” (PTER) as a proportion of total employment. Just as we did with LFS data from the U.K., we estimate a series of wage curves with log hourly earnings as the dependent variable and log wages on a four-quarter lag, log unemployment, and log underemployment as independent variables. We estimate these wage curves for three separate time periods – 1979 through 2018, 1979 through 2007, and 2008 through 2017. Regression results are displayed in Table 3.
| TABLE 3 | ||||||
|---|---|---|---|---|---|---|
| Time Series Log Wage Equations, U.S. Panel Data | ||||||
| Slack Variable: Unemployment | Slack Variable: Underemployment | |||||
| Time Period | 1980-2017 | 1980-2007 | 2008 -2017 | 1980-2017 | 1980-2007 | 2008-2017 |
| Log Wt-1 | 0.6612 (21.76) | 0.7185 (22.75) | 0.0439 (1.30) | 0.6479 (20.38) | 0.6999 (22.35) | 0.0474 (1.35) |
| Log Unemployment Rate | -0.0171 (4.51) | -0.0211 (5.23) | 0.0068 (0.59) | |||
| Log Underemployment Rate | -0.0238 (6.91) | -0.0212 (6.08) | -0.0263 (3.23) | |||
In the first column, we regress hourly earnings growth on unemployment and lagged earnings from 1980 to 2017, and we find a negative, statistically significant coefficient on unemployment, suggesting that lower levels of unemployment do translate into higher rates of wage growth. However, the regression results change dramatically when the same wage curve is specified for 1979-2007 and 2008-2017 separately (Columns 2 and 3 in Table 3, respectively). While the coefficient on unemployment remains negative and significant for the time period from 1979-2007, the unemployment coefficient is neither negative nor statistically significant from 2008-2017, which represents the onset of the Great Recession and the recovery. This suggests that in the past decade, structural economic changes in the United States have caused the relationship between labor market slack and wage growth to substantially decline, such that unemployment must be very low for an extended period of time in order to leverage robust wage growth.
Furthermore, columns 4 through 6 in Table 3 demonstrate that in the post-recession years since 2008, measures of underemployment replace the unemployment rate as the most significant measure of labor market slack. We find that for all time periods tested, including 2008-2017, the underemployment rate has a negative, statistically significant relationship with wage growth. This shows that since the recession, reductions in the underemployment rate have a much stronger effect on increasing wage growth than reductions in the unemployment rate. Thus, central bankers and macroeconomists in the United States should closely monitor the underemployment rate when evaluating whether the U.S. economy has reached full employment.
The Well-Being of the Underemployed and the Rise of Depression in the U.K.[11]
The weakened relationship between labor market slack and wage inflation provides a compelling case that monetary policymakers should feel comfortable pushing underemployment rates and unemployment rates lower than ever before. An additional, equally important reason that monetary policymakers should strive for the lowest levels of labor market slack possible is the strong relationship between unemployment rates, underemployment rates, and measures of well-being. Using Labor Force Survey (LFS) and Annual Population Survey (APS) data, we find that the underemployed and the unemployed have substantially lower levels of well-being than other groups of workers in the U.K., based on measures of happiness, life satisfaction, worthwhileness, anxiety, and depression.
Other research supports the conclusion that underemployed and unemployed people have lower levels of well-being. Heyes et al. (2017) analyzed the well-being of workers along “enthusiasm-depression” and “contentment-anxiety” axes, and they found “workers who are underemployed experience lower well-being levels than those who are more adequately employed.”[12] Angrave and Charlwood (2015) found that both underemployment and over-employment lower well-being as quantified by job and life satisfaction.[13] Similar studies of other countries, like research conducted by Wilkins (2007) and Wooden, Warren, and Drago (2009) in Australia, reach the same conclusion — that underemployment lowers job and life satisfaction.[14]
For our own work, the APS contains four unique questions we use to assess well-being. These are:
Q. “Next, I would like to ask you four questions about your feelings on aspects of your life. There are no right or wrong answers. For each of these questions I’d like you to give an answer on a scale of nought to 10, where nought is ‘not at all’ and 10 is ‘completely’.”
1. “Overall, how satisfied are you with your life nowadays?”
2. “Overall, to what extent do you feel that the things you do in your life are worthwhile?”
3. “Overall, how happy did you feel yesterday?”
4. “On a scale where nought is ‘not at all anxious’ and 10 is ‘completely anxious’, overall, how anxious did you feel yesterday?”
We use microdata for January 2013-January 2017, and we find that the unemployed have consistently lower average scores across the measures of happiness, satisfaction, and worthwhileness and higher scores for anxiety than full-time and voluntarily part-time workers. The underemployed have higher levels of well-being than the unemployed, but substantially lower levels of well-being than full-time or voluntarily part-time employees. For instance, while full-time workers have an average score of 7.69 (out of 10) and voluntary part-time workers have an average score of 7.85 for the satisfaction measure, unemployed people have an average score of 6.67 and involuntary part-time workers have an average score of 7.18. The disparities are even more striking when our broader definition of underemployment is used, which includes all workers (both full- and part-time) who wish to increase the number of hours they work at the going wage rate. Employees working for at least 20 hours less than their ideal number of hours had an even lower satisfaction score of 6.99. Similar disparities exist across the other measures of well-being (See Table 4).
| TABLE 4 | ||||||
|---|---|---|---|---|---|---|
| Average Well-Being Scores by Labor Force Status, U.K. January 2013-January 2017 | ||||||
| Labor Force Status | Happiness Score | Satisfaction Score | Worthwhile Score | Anxiety Score | ||
| Full-Time | 7.47 | 7.69 | 7.89 | 2.82 | ||
| Voluntary Part-Time | 7.67 | 7.85 | 8.17 | 2.80 | ||
| Unemployed | 6.92 | 6.67 | 7.12 | 3.40 | ||
| Underemployed (Involuntary Part Time) | 7.22 | 7.18 | 7.55 | 3.11 | ||
| Underemployed (Under 1-4 Hours) | 7.49 | 7.56 | 7.90 | 3.16 | ||
| Underemployed (Under 5-9 Hours) | 7.40 | 7.52 | 7.83 | 3.12 | ||
| Underemployed (Under 10-19 Hours) | 7.27 | 7.30 | 7.69 | 3.17 | ||
| Underemployed (Under 20+ Hours) | 7.12 | 6.99 | 7.44 | 3.29 | ||
Economic modeling also demonstrates the negative effects of underemployment and unemployment on well-being. OLS regression results under multiple specifications illustrate that both measures of underemployment — involuntary part-time status and the hours-based measure —are negatively associated with measures of happiness, satisfaction, and feeling life is worthwhile. They are also both positively associated with the measure of anxiety. With the exception of one, all coefficients are strongly statistically significant. Regression results are documented in the table below, and t-statistics are included in parentheses.
| TABLE 4 | ||||||
|---|---|---|---|---|---|---|
| Average Well-Being Scores by Labor Force Status, U.K. January 2013-January 2017 | ||||||
| Labor Force Status | Happiness Score | Satisfaction Score | Worthwhile Score | Anxiety Score | ||
| Full-Time | 7.47 | 7.69 | 7.89 | 2.82 | ||
| Voluntary Part-Time | 7.67 | 7.85 | 8.17 | 2.80 | ||
| Unemployed | 6.92 | 6.67 | 7.12 | 3.40 | ||
| Underemployed (Involuntary Part Time) | 7.22 | 7.18 | 7.55 | 3.11 | ||
| Underemployed (Under 1-4 Hours) | 7.49 | 7.56 | 7.90 | 3.16 | ||
| Underemployed (Under 5-9 Hours) | 7.40 | 7.52 | 7.83 | 3.12 | ||
| Underemployed (Under 10-19 Hours) | 7.27 | 7.30 | 7.69 | 3.17 | ||
| Underemployed (Under 20+ Hours) | 7.12 | 6.99 | 7.44 | 3.29 | ||
Survey data on mental health diagnoses among workers also shows that unemployed and underemployed people are more likely to experience depression and anxiety than other members of the labor force. In the quarterly Labor Force Surveys since 1997, respondents have been asked to report their main health problem, if they have any. We examined data from January 2014 to March 2018, which has over 1.3 million observations on those aged sixteen and over. Overall, 63% say they have no health problems. The survey provides two options for respondents related to mental health — respondents can indicate that they have “depression or bad nerves” or that they have “mental illness, phobia, or panics.” On average, 2.3% of those in the labor force self- identify with the former and 0.5% identify with the latter. However, 9.7% of the unemployed report that they are depressed and 4.2% report that they have other mental illnesses. For all measures of underemployment, the underemployed were more likely to be depressed than full-time workers.
It also seems that the probability of being depressed has increased for all workers over time but has increased especially rapidly for underemployed workers. Since the onset of austerity by the U.K. Chancellor George Osborne in June 2010, the incidence of depression among all workers has increased from 1% in 2011 to 3.1% in 2018. Depression rates have grown even more among underemployed workers (defined as all workers who desire to work more hours at the going rate), rising from 1.4% in 2011 to 4.8% in 2018. This rise in depression matches the rise in the fear of unemployment captured by other U.K. statistics. Statistical analysis controlling for other factors demonstrates that underemployed people have considerably higher probabilities of being depressed than other workers.
These findings illustrate the consequences of a labor market with too much slack at a personal level, beyond the traditional macroeconomic consequences that are commonly studied. Unemployed and underemployed people are substantially more likely to experience anxiety and depression and to feel less happy, satisfied, and fulfilled by their lives. Our work complements the existing economic literature on full employment by illustrating the extent to which macroeconomic forces can strongly affect the personal lives of individual people.
Conclusion
Our work on the importance of underemployment as a measure of labor market slack and the falling natural rate of unemployment, as well as on the psychological toll of high underemployment and unemployment rates, make complementary, strong arguments for aggressive pursuit of full employment. The former encourages policymakers to account for the underemployed in the process of pursuing full employment and shows that labor markets can sustain lower levels of under/unemployment than traditionally assumed, while the latter details the personal, human costs of failing to advance a full employment agenda. Monetary policymakers should not be hesitant to allow unemployment to fall, as the relationship between labor market slack and inflation has substantially weakened over time such that lower levels of unemployment are needed to leverage wage growth for workers. Furthermore, the positive externalities of low under/unemployment rates extend even beyond financial matters, as gainfully employed workers are more likely to be happy and personally fulfilled members of society.
End Notes
[1] David Blanchflower and David Bell, “The Lack of Wage Growth and the Falling NAIRU,” National Institute Economic Review, No. 245, August, pp. R1-R16, 2018
[2] David Blanchflower, “Raising interest rates is a big mistake. This will have to be reversed,” The Guardian, August 3, 2018, https://www.theguardian.com/commentisfree/2018/aug/03/raising-interest-rates-mpc-wage-growth.
[3] The index starts with the unemployment rate, and then factors in the difference between the aggregate number of additional work hours and the total number of hours reductions preferred by all workers (obtained from the U.K. Labor Force Survey). If the desired increase in hours equals the desired reduction in hours, then the index simply reproduces the unemployment rate. If the desired increase in hours is greater than the desired decrease in hours, the underemployment index will be greater than the unemployment rate. More detail can be found in: David Blanchflower and David Bell, “Underemployment in the US and Europe,” forthcoming Industrial and Labor Relations Review.
[4] Gee Hee Hong, Zoska Kóczán, Weicheng Lian, and Malhar Nabar, “More slack than meets the eye? Recent wage dynamics in advanced economies,” International Monetary Fund, March 9, 2018, https://www.imf.org/en/Publications/WP/Issues/2018/03/09/More-Slack-than-Meets-the-Eye-Recent-Wage-Dynamics-in-Advanced-Economies-45692.
[5] David Blanchflower and Andrew Oswald, The Wage Curve (Cambridge, MA: MIT Press, 1994).
[6] Milton Friedman, “The role of monetary policy’, American Economic Review, 58(1):1–17.
[7]Janet Yellen, “Inflation, Uncertainty, and Monetary Policy,” The Federal Reserve, September 26, 2017, https://www.federalreserve.gov/newsevents/speech/yellen20170926a.htm.
[8] Richard Partington, “UK Unions Must Reform To Tackle Membership Decline,” The Guardian, November 15, 2017, https://www.theguardian.com/politics/2017/nov/15/uk-unions-membership-fabian-society-community-hospitality.
[9] Gertjan Vlieghe, “From asymmetry to symmetry: changing risks to the economic outlook,” Bank of England, March 23, 2018, https://service.betterregulation.com/sites/default/files/from-asymmetry-to-symmetry-changing-risks-to-the-economic-outlook-speech-by-gertjan-vlieghe.pdf.
[10] David Blanchflower and David Bell, “Underemployment in the US and Europe,” forthcoming Industrial and Labor Relations Review.
[11] David Bell and David Blanchflower, “The Well-being of the Overemployed and the Underemployed and the Rise in Depression in the UK,” Journal of Economic Behaviour and Organization, June, 2019.
[12] Jason Heyes, Mark Tomlinson, and Adam Whitworth, “Underemployment and well-being in the UK before and after the Great Recession,” 2017, Work, Employment and Society, 31(1):71–89.
[13] David Angrave and Andy Charlwood, “What is the relationship between long working hours, over-employment, underemployment and the subjective well-being of workers? Longitudinal evidence from the UK,” 2015, Human Relations, 68(9): 1491–1515.
[14] Roger Wilkins, “The consequences of underemployment for the underemployed,” 2007, Journal of Industrial Relations, 49(2): 247–75; Mark Wooden, Diana Warren, and Robert Drago, “Working time mismatch and subjective well-being,” March 2009, British Journal of Industrial Relations, 47(1):147-179.
More from the Authors