More Adequate SNAP Benefits Would Help Millions of Participants Better Afford Food

The Supplemental Nutrition Assistance Program (SNAP, formerly food stamps) is the primary source of nutrition assistance for many low-income families and individuals, enabling them to spend more on groceries than their limited budgets would otherwise allow and making it easier to put enough food on the table. SNAP forms a critical foundation for low-income households’ health and well-being, lifting millions out of poverty and improving food security. But SNAP’s relatively modest benefits — which are based on an outdated model and averaged less than $1.40 per person per meal in 2019, before the COVID-19 pandemic — may not be enough to meet the needs of America’s poor.[1] The Agriculture Department (USDA) is re-evaluating the basis for SNAP benefits to better reflect the cost of a healthy diet. It’s a much-needed revision, as a large body of evidence shows that SNAP benefits fall short of what households need to afford a healthy diet.

Households participating in SNAP include families in which one or more adults are working for low pay, seniors with low incomes, people with disabilities living on modest incomes, and people who are out of work; more than two-thirds of participants in an average month are in households with children, and more than one-quarter are in households with seniors or people with disabilities.

Despite the program’s success, millions of people across the United States, including roughly half of all households participating in SNAP, were food insecure even before the pandemic. (Food insecurity is a lack of consistent access to enough food to support an active, healthy life.) Food hardships grew at an alarming rate as the pandemic’s economic effects took hold, disproportionately affecting households with children and people of color. The number of households reporting in Census Bureau data that they had trouble getting enough to eat spiked in the spring of 2020 and rose further in the fall. Despite improvements in early 2021 since the peak in December 2020, levels of food hardship remain much higher than pre-pandemic levels.[2]

Last revised in 2006 and held to an unrealistic cost constraint for decades, the TFP falls short of the cost for many families of a healthy, adequate diet.The Thrifty Food Plan (TFP) — the USDA’s food plan designed to provide a nutritionally adequate diet at minimal cost and the basis for SNAP benefits — is badly out of date with the most recent dietary recommendations and the economic realities most struggling households face when trying to buy and prepare healthy food. Last revised in 2006 and held to an unrealistic cost constraint for decades, the TFP falls short of the cost for many families of a healthy, adequate diet that includes foods commonly eaten in the United States.

In recognition of the need to modernize the TFP to more accurately measure the cost of a healthy diet, the bipartisan 2018 Farm Bill mandated a re-evaluation of the TFP by 2022 and every five years thereafter. President Biden, in one of his first executive actions, asked USDA to move quickly on the TFP re-evaluation process. While the results of USDA’s review are not yet available, our assessment of research from the last decade strongly suggests that SNAP benefits fall short of what many participants need to purchase and prepare a healthy diet and that higher SNAP benefits would increase food expenditures and improve food security.[3]

  • The TFP does not reflect what U.S. households really eat, meet all key nutrient standards, or account for different family types and needs. USDA imposes several constraints on the development of the TFP. Its cost, for example, has been fixed in inflation-adjusted terms since the 1970s. In an effort to hold costs down, the food plan doesn’t meet all federal nutrition standards, includes only small quantities of some non-luxury healthy foods commonly eaten by U.S. households, and includes foods in amounts that most U.S. households do not consume — such as quantities of milk and legumes that are well in excess of what people eat.

    USDA should improve the TFP by basing it on a healthy food consumption pattern instead of current consumption by low-income households that reflects the fact that their resources are too low to afford a broader variety of foods. Current consumption patterns may not reflect the foods low-income households need, prefer, or find culturally acceptable. Consumption is shaped by many factors, some of which — such as high price and limited access — may restrict choice. Consumption is shaped by many factors, some of which — such as high prices and limited access — may restrict choice. For example, low-income households may eat greater variety and amounts of certain food groups, such as legumes or refined grains, and lesser variety and amounts of others, such as whole fruits, yellow vegetables, poultry, or fish, not due to preference, but because that is what they can afford. Basing the TFP on the food choices that households make under significant resource constraints results in a TFP that limits SNAP benefits to cover a narrower set of foods or to be used to purchase less healthy food than households would with more resources.

  • The TFP assumes consumers will have far more time to prepare meals than most households spend on food preparation, resulting in a plan that is heavily dependent on foods that take more time to prepare and not enough on healthy foods that reduce preparation time. Preparing a healthy meal requires both time — to plan menus, travel to and from a grocery store, comparison shop to minimize costs, and prepare meals — and money. Studies have found that if a household tried to eat only the foods in the TFP, they would likely have to devote much more time than most households actually have to prepare meals, and to make meals largely from scratch. SNAP benefits cannot easily be stretched to purchase as many of the more time-saving, but often more costly, forms of grocery foods that American consumers typically eat today, such as pre-sliced frozen vegetables or ready-to-cook cuts of lean meat.
  • Current benefits fall well short of what households may need to ensure an adequate diet. Food-insecure SNAP participants report they need about $10 to $20 more per person each week to buy enough food to meet their needs. Similarly, researchers have estimated that SNAP benefits fall about $11 short per person of the weekly cost of a nutritious meal plan. And larger benefit adjustments also would be needed to reflect more realistic expectations about the degree to which families can prepare meals from scratch.
  • Many families struggle once SNAP benefits run out. About one-quarter of all households exhaust virtually all their benefits within a week of receipt, and more than half exhaust virtually all benefits within the first two weeks.[4] To be sure, SNAP benefits are intended to supplement other income that households can use to purchase food, and households may economize by purchasing in bulk when they get their benefits. But food expenditures and consumption fall — and food insecurity increases — as families use up their benefits and other resources during the rest of the month. Running out of benefits may also harm participants’ health and educational achievement: studies find that hospital admissions and school disciplinary problems rise, and test scores fall, among SNAP families later in the month.
  • Families in high-cost areas find it especially hard to afford a healthy diet. SNAP benefits are adjusted each year to account for rising food prices, and maximum allotments are the same across all states (except for Alaska and Hawai’i) and the District of Columbia. While this ensures that poor households with similar circumstances are eligible for the same SNAP benefit regardless of where they live — an essential feature of SNAP — it can render a healthy diet unaffordable for families in high-cost areas, both because food prices are higher in those communities and the cost of other expenses, such as housing, is more expensive as well, limiting the funds households have available for food. As many as 20 to 30 percent of SNAP households may not be able to purchase the TFP market basket, which is itself a flawed measure of the cost of food as discussed in this brief, because they live in areas with higher food prices.[5]
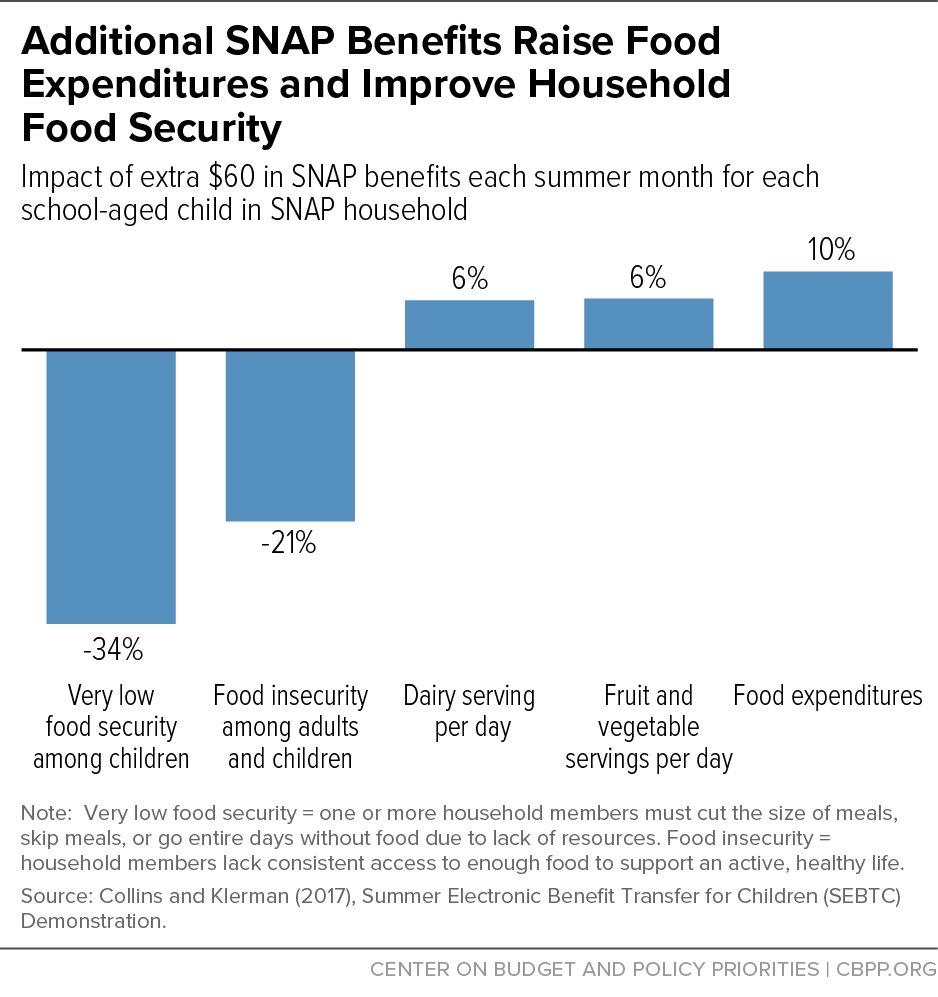
  • Additional SNAP benefits would increase both food expenditures and food security, studies show. SNAP households’ food spending increased, and food security improved, after policymakers temporarily boosted SNAP benefits in response to the Great Recession. These trends then reversed as inflation eroded the benefit increase and policymakers subsequently ended it. Similarly, increasing benefits in the summer — when children lack access to free or reduced-price school meals — reduced by one-third the share of children with very low food security (that is, who must cut the size of meals, skip meals, or go days without food due to lack of resources). Preliminary evidence suggests the Pandemic Electronic Benefit Transfer (P-EBT) program, created to help families with children who lost access to free or reduced-price meals when their school closed due to the pandemic, also substantially reduced food insecurity.
  • Increased SNAP benefits could help reduce child poverty. Children growing up in families with incomes below the poverty line typically fare worse over the long term — in terms of physical and mental health, educational attainment and labor market success, and other outcomes — than children from more affluent families. Increasing SNAP benefits would reduce the number of children in poverty.
  • Increased SNAP benefits could address disproportionate impacts of benefit inadequacy on people of color. Poverty and food insecurity rates are higher among Black and Latino households due to structural factors that contribute to income disparities. Moreover, evidence suggests that the current SNAP benefit calculation may be especially inaccurate at estimating food needs for people of color, such as the TFP’s inclusion of a significant amount of dairy products, even though at least one-quarter of the U.S. population is lactose intolerant, with rates of lactose intolerance much higher among individuals of color. Because of SNAP’s role in addressing higher food insecurity among people of color, ensuring benefits are adequate is especially important for those communities.

A large body of research conducted over roughly the last decade has shed light on the multiple factors contributing to the inadequacy of SNAP benefits and the need to revise benefits to better meet households’ nutritional needs. A panel of researchers and policy experts commissioned by USDA’s Food and Nutrition Service and convened by the National Academies in 2012 drew attention to the wide range of individual, household, environmental, and program characteristics that influence the program’s adequacy.[6] A household’s ability to achieve food security and consume a healthy diet depends on many factors: time and resources; nutrition knowledge; food choices; access to reasonably priced grocery stores and supermarkets; and the cost of food and transportation. Key program design features — from the way benefits are calculated to the availability and effectiveness of nutrition education — also matter.[7] Fortunately, this extensive research, some of it sparked by the expert panel’s work, offers insights on the inadequacy of SNAP benefits and the need to revise the TFP to better reflect the cost of a healthy diet.[8]

SNAP Benefits Are Based on an Outdated Model and Unrealistic Assumptions

The cost of the TFP is supposed to represent the amount of money needed to purchase a minimal cost but nutritious diet and is used as the basis for SNAP benefits. (For more information on how this is estimated and applied to SNAP benefits, see box “The Thrifty Food Plan and SNAP Benefits.”) In reality, however, USDA’s periodic updates to the TFP have started by assuming that its cost must stay fixed at existing levels, adjusted only for inflation.[9] Having adopted this fixed cost constraint, USDA then sought to meet nutrient standards, food group recommendations, and other dietary requirements without deviating too far from low-income Americans’ current consumption patterns.

None of the TFP revisions since the 1970s have addressed the fundamental question of how much a nutritious diet actually costs most households, taking into account typical food consumption patterns and the dietary needs and preferences of people in the United States. Past TFP revisions have instead demonstrated the feasibility of purchasing a healthy diet that is as similar as possible to what low-income families typically consume at a cost commensurate with maximum SNAP benefit levels. The TFP model falls short of even this more modest goal as it generates unrealistic market baskets that fail to meet some key nutrition and dietary recommendations.[10] Compared to the 1970s, scientific evidence now emphasizes the importance of eating a broad range of somewhat more costly foods, including more whole grains, leafy green and orange vegetables, lean proteins, and fish. To stay within the 1970s cost constraint, however, the current TFP relies on a narrow range of foods — assuming, for example, that a family of four each week consumes several pounds of beans and several gallons of milk.

The TFP could be improved by basing it on a healthy food consumption pattern that mirrors, to the greatest extent possible, standard U.S. consumption preferences instead of the current consumption patterns of only low-income households. If we think of the TFP as a nutritious food pattern that a low-income consumer could choose to achieve a healthy diet, then constraining the plan to conform to what low-income people currently eat makes little sense. USDA’s own Healthy Eating Index (HEI), a measure of diet quality used to assess how well a set of foods aligns with key recommendations of the Dietary Guidelines for Americans, reveals that, in fact, the diets of most people in the United States need improvement.[11] And current food consumption among people with low incomes is known to be associated with comparatively high rates of obesity, heart disease, and other chronic diseases. The contradiction here is clear: most people, including those with low incomes, need to improve their diet, yet the TFP uses the constrained current consumption patterns among low-income households — households with the fewest choices because of their constrained budgets — as the starting point.

The Thrifty Food Plan and SNAP Benefits

The TFP is intended to reflect market baskets of foods representative of those consumed by low-income households and aligned with the Dietary Guidelines for Americans. Past USDA revisions of the TFP have held the overall cost at the same level for over 40 years, only adjusting for inflation. It is derived from a mathematical technique that searches for the unique combination of foods that minimizes the difference from observed diets within a set of constraints imposed by cost, nutritional requirements, and dietary guidelines.

The most recent revision of the TFP is not a shopping list that guides a consumer along the path toward a healthy diet, but rather thousands of individual food items consolidated into 29 categories grouped under six broad food types: grains, vegetables, fruits, milk products, meat and beans, and other foods. Foods within categories are assigned an average price based on national data, then combined to achieve the dietary recommendations in the 2005 Dietary Guidelines and MyPyramid while straying as little as possible from current consumption patterns and holding overall costs constant. The requirement that the TFP meet dietary guidelines at constant cost over time implies that its value today is the same as it was 40 years ago when the TFP was introduced, once food-price inflation is accounted for. Separate plans are generated for 15 groups of men, women, and children of different ages, reflecting differences in their dietary requirements.

In principle, the TFP suggests that a family of four, consisting of two adults and two school-aged children, should be able to buy a nutritious diet for $157 per week in June 2020 based on average food prices across the nation.a Maximum SNAP benefits are based on this four-person reference family, with adjustments for smaller and larger households to reflect economies of scale. Maximum benefits in Alaska, Hawaiʻi, Guam, and the Virgin Islands are higher to reflect the higher cost of food in those locations. To account for food price inflation, maximum benefits are adjusted each October based on the cost of the TFP the previous June. In response to the hardships imposed by the pandemic, Congress temporarily raised maximum benefit allotments to 115 percent of the June 2020 value of the TFP. The maximum monthly benefit for a family of four in the 48 states and D.C. between January and September 2021 is $782.

SNAP targets its benefits according to need: households with less income receive larger benefits than households with more income since they need more help to afford an adequate diet. The standard benefit formula assumes that families will spend 30 percent of their net income on food; SNAP makes up the difference between that 30 percent contribution and the maximum benefit. To receive the maximum SNAP benefit, a household must have no net income to contribute to food purchases. During the coronavirus public health emergency, most household benefits were raised to the maximum by the emergency SNAP allotments under the Families First Coronavirus Response Act.

a Center for Nutrition Policy and Promotion, “Official USDA Food Plans: Cost of Food at Home at Four Levels, U.S. Average, June 2020,” July 2020, https://fns-prod.azureedge.net/sites/default/files/media/file/CostofFoodJun2020.pdf

In addition, current food consumption is a flawed proxy for low-income households’ food preferences. Benchmarking the TFP to current consumption assumes that low-income households have full choice in a free market and adequate resources, and that their current consumption represents the food preferences they would have if they had more resources to put toward food. But low-income households’ current consumption patterns are shaped by many factors, some of which may restrict choice, and may not reflect the food they need, prefer, or find culturally acceptable. Some may find the cost of healthy foods a barrier to a healthy diet. Some may have limited access to supermarkets with fresh, affordable produce. And the foods that many low-income households acquire from food pantries and soup kitchens may reflect what’s available rather than what they’d prefer.

The restrictive cost constraint and other factors result in TFP market baskets that do not reflect the variety of foods most people consume, including low-income consumers. The TFP has grown increasingly unrealistic over the course of nearly 50 years. Held to a very low cost constraint, the TFP relies on a narrow range of foods that do not reflect the variety of healthy foods recommended in science-based dietary guidelines or what most households would find a reasonable variety of foods to eat each month. As a result, the TFP market baskets deviate, sometimes dramatically, from the consumption patterns that people might reasonably be expected to follow.

For example, the TFP market basket representing the food purchases of the SNAP reference family of four for a week includes 40 pounds of lower fat and skim milk and yogurt (equal to about 4.5 gallons of milk or 20 32-ounce tubs of yogurt — a very large amount for four people to eat in a week) and nearly 5 pounds of legumes (beans) but only 0.13 pounds of cheese (amounting to about two to three slices of cheese) and less than a pound of egg and egg mixtures (amounting to about seven large eggs) for the entire family.[12] Some research shows that the TFP assumes a household will consume certain foods in quantities up to 20 times the national average and largely omits other commonly consumed foods. For example, whole grain rice and pasta account for 0.5 percent of food energy for all females aged 20 to 50 (on average), but under the 2006 TFP, they account for more than 10 percent of the food energy in the TFP.[13]

The TFP assumes that households have an unlimited amount of time to purchase and prepare a healthy diet,[14] allowing the TFP to include a large amount of low-cost raw ingredients that households can use to prepare most meals at home, from scratch. This makes the cost of a basic diet look less costly than it is for most households. Preparing healthy meals requires both money and time. In a recent study, lack of time was the most common individual or household-level barrier SNAP participants identified to preparing meals that are part of a healthy diet.[15] To prepare a healthy diet, families must have enough money to buy ingredients, as well as the time needed to plan meals, buy and prepare food, consume meals, and clean up.[16] With the increase in women’s labor force participation since the 1970s, and with many parents working multiple jobs, many families lack this time for food preparation.

Ignoring the time that it would take to make meals under the current TFP means that the food plan includes foods that take relatively longer to prepare and doesn’t provide adequate resources to purchase healthy foods that take less time. When families can’t spend as much time making food as the TFP assumes, benefits may be inadequate to cover the cost of healthy foods that can be prepared more quickly. For example, a can of beans typically costs more than dry beans, but it takes more time to sort, rinse, soak, and boil dry beans. Substituting more time-saving versions of foods may not be possible if families do not have enough resources to purchase them.[17] Shopping for ingredients also takes time.[18] The value of time may be more important than the cost of food when preparing meals at home, accounting for as much as 50 to 65 percent of the total time-and-money cost of food and meal preparation among SNAP households.[19]

Since the TFP model does not explicitly account for the time required to purchase and prepare food, it implicitly assumes that people have unlimited time to prepare meals with the ingredients selected for the TFP. But households have constraints on their time — think of the time available to a single parent with two children who works, must pick up children from child care, and must purchase groceries and prepare meals. Faced with these very real time constraints, families will not be able to purchase foods that are time-intensive to prepare, will need to purchase foods that take less time to prepare, and then will run short of resources because those foods such as peeled and pre-sliced vegetables, canned beans rather than dried, or ready-to-cook cuts of skinless and boneless meat, are more expensive. Although the 2006 TFP allows for some convenience foods, it still relies heavily on meals prepared mostly from scratch to meet its cost constraints.[20]

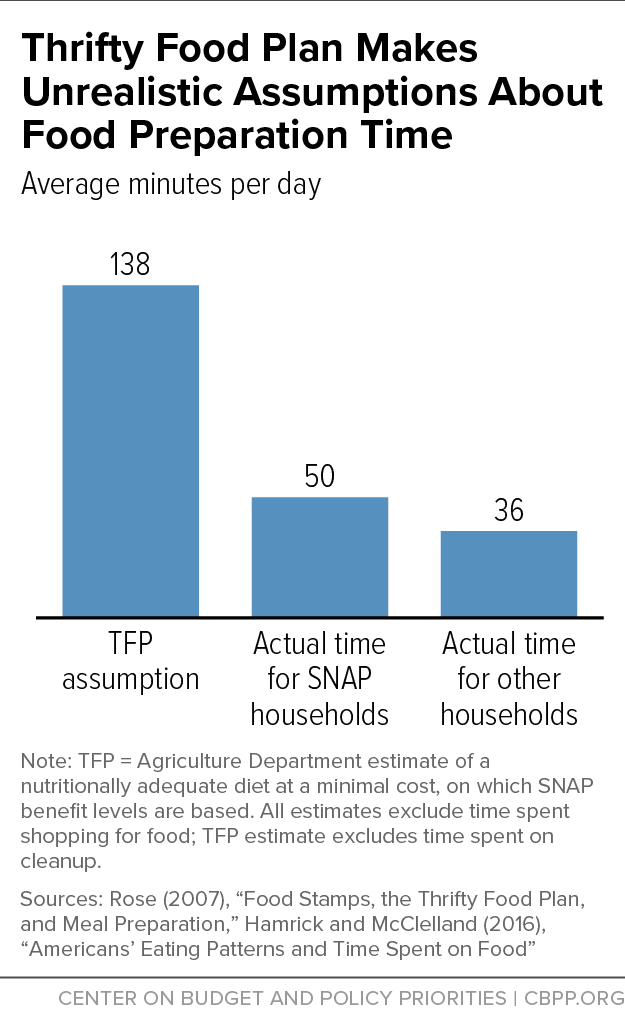
While there are few estimates of the time required to prepare a nutritious diet at the cost determined by the TFP, existing estimates suggest it takes 13 to 16 hours per week, or roughly two hours per day.[21] This is much more than most American households spend preparing meals: an average American adult typically spends just over 35 minutes each day on food preparation and cleanup. The figure for SNAP participants is higher (around 50 to 65 minutes), but it still falls well short of the actual effort that the TFP requires (see Figure 1).[22]

The TFP does not meet all key dietary standards or account for varying family types and dietary needs. It meets many science-based recommendations of nutritional need but fails to meet nutritional guidelines for vitamin E, potassium, and sodium.[23] To reach a feasible solution within the TFP’s cost constraint, the 2006 TFP includes several ad hoc adjustments to constraints and consumption parameters. For example, the vitamin E requirements for several age-gender groups are set below the Recommended Daily Allowance.

The TFP for a family of four is based on the dietary needs for a family consisting of two adults and two children under age 12 and thus is likely not well-suited for four-person families with teenagers, since dietary guidelines suggest they have similar nutritional needs as adults.[24] Furthermore, the TFP does not account for a range of dietary restrictions and is insufficient to cover medically necessary dietary needs for relatively common conditions such as lactose intolerance or diabetes.[25]

Some simplifications are important to allow the TFP to be useful for setting SNAP benefits. But if the TFP is too low for the reference family, then it falls even further behind for other family types that have higher nutritional needs.

Finally, a revised TFP should incorporate the most up-to-date dietary guidelines. Since the TFP was last revised in 2006, USDA and the Department of Health and Human Services (HHS) updated the Dietary Guidelines in 2010, 2015, and 2020. Dietary guidance changes over time to reflect the latest evidence about dietary patterns that support healthy outcomes.

Many Families Struggle Once SNAP Benefits Run Out

Food purchases among SNAP households follow a pronounced, well-documented cyclical pattern. Households redeem over half of their SNAP benefits within a week of receiving them, over three-quarters by the end of the second week, and nearly 90 percent by the end of the third. Benefits normally run out for most households before the end of the month. About one-quarter of households exhaust virtually all their monthly benefits within a week of issuance, and more than half within two weeks.[26]

Given the program’s design, running out of SNAP benefits before the end of the month is not entirely unexpected. SNAP benefits are meant to supplement other sources of household income that can be used to purchase food, not to cover the full monthly cost of food for most households. Only those households with no net income after taking allowable deductions — over one-third of participating households in 2018 — receive the maximum SNAP benefit. The other two-thirds are expected to contribute 30 percent of their disposable income to purchase food.

Most households do, in fact, contribute their own earnings or other cash assistance benefits to pay for food. Almost 75 percent spend cash on food in addition to their SNAP benefits. SNAP benefits account for about half of participants’ total food spending and 63 percent of their spending on food at home.[27] In theory, therefore, the decline in the use of SNAP benefits over the course of a month might simply reflect participants spending down benefits before turning to cash or cost-cutting by purchasing in bulk or getting volume discounts, rather than participants running out of resources for food.

Numerous studies have found, however, that late in the benefit cycle, SNAP participants not only spend less on food but also consume fewer calories, are likelier to experience food insecurity, and may be likelier to visit emergency rooms or be admitted to a hospital because of low blood sugar. In addition, children score lower on basic achievement tests and disciplinary problems in school increase. These adverse consequences suggest that households’ overall resources for food — their SNAP benefits plus their own income — may not be enough to meet their needs.

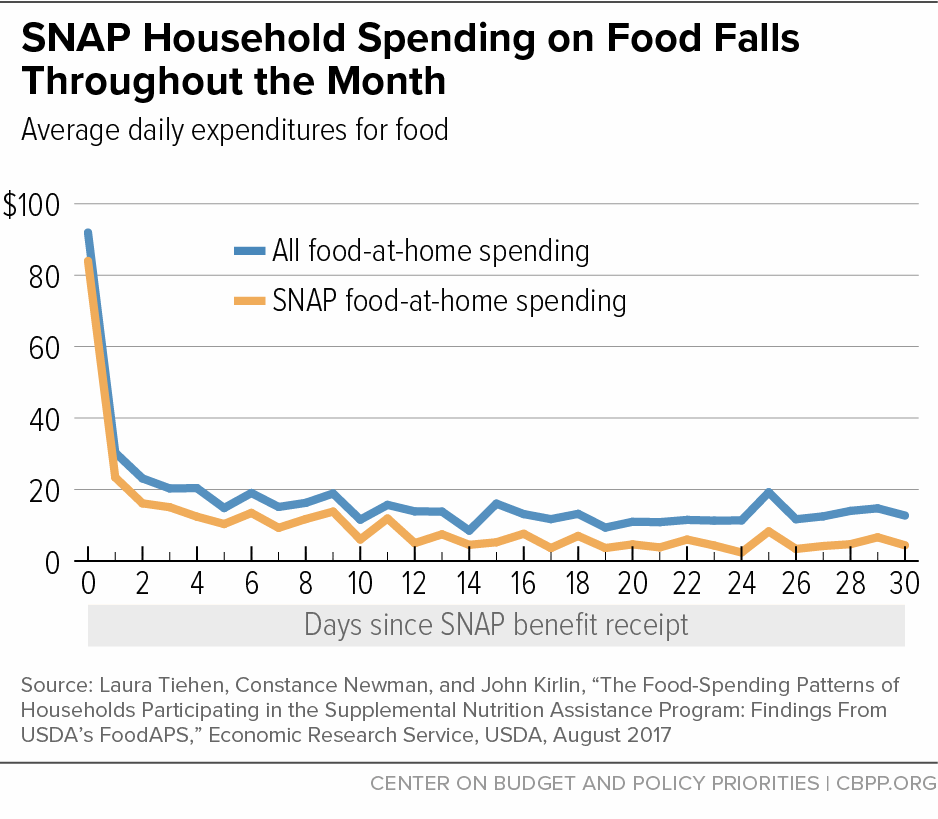
  • Food spending falls rapidly throughout the month. Multiple studies document significant reductions in overall food expenditures as a month unfolds and SNAP benefits are exhausted.[28] (See Figure 2 for the findings of one such study.) Among SNAP households, average daily food spending falls from an average of $66 on the day of and the day after receiving benefits to less than $18 for the rest of the month — from $63 in the first week of the benefit month to $37 on average in the last three weeks, and from $94 to $19 from the first day to the last day of the benefit month.[29] Detailed scanner data from a national grocery retailer in one state show that SNAP households reduce their food expenditures by 34 percent between the first and last weeks of the month after benefit issuance. Similar data from another state show SNAP participants’ food spending falling by 37 percent from the first half of the month to the second compared to only a 3 percent drop among non-participants.[30]

    Recent research has asked whether the price of food, and how participants respond to those prices, may explain some of the change in food expenditures over the benefit cycle. The question is whether SNAP recipients pay more for food at the beginning of the benefit cycle and shift spending toward otherwise similar but less costly food further into the cycle. Constraints on a household’s food budget toward the end of the month could push it to find lower-priced options to increase the real value of their benefits and reduce the probability of eating less or skipping meals later in the month.

  • In theory, if participants mistakenly feel “flush” after receiving their monthly issuance of SNAP benefits, they may be less sensitive to the prices they pay for food early in the benefit cycle. Similarly, if participants place more value on current spending over future spending, they may put off burdensome price-saving efforts — such as shopping more frequently to find lower prices, taking advantage of bulk purchase discounts, switching from premium to generic brands, using coupons, or traveling to more distant discount stores — when food shopping early in the cycle. Alternatively, participants could determine that the future returns from cost-conscious shopping at the beginning of the benefit cycle outweigh any immediate costs, leading to food purchases at relatively lower prices early in the month. The limited research available offers contradictory evidence on the behavior of low-income consumers.[31]

    One study suggests that the foods purchased by SNAP households are less expensive at the beginning of the benefit cycle and that SNAP recipients are most price-conscious and engage in their most successful cost-cutting efforts soon after receiving their benefits.[32] Another study, however, found a declining trend in food prices paid after the first week until they rose in the final three days of the benefit cycle. It found little evidence that the observed decline was associated with changes in shopping behaviors but indirect evidence that some households substitute lower-quality products for higher-quality products as they exhaust their food resources.[33] A third study found that SNAP households tend to purchase higher-cost food right after they receive benefits, and select progressively less expensive food as they approach the end of the benefit cycle.[34] Although all three studies rely on the same data set, their distinctly different analytic approaches make it difficult to reconcile the conflicting results.

  • Food consumption falls throughout the month. Food intake, most often measured as the number of calories consumed, falls off at the end of the benefit month, probably by as much as 10 to 25 percent.

    In one of the earliest studies on this issue, participants who do their major grocery shopping infrequently (about 40 percent of households receiving food stamps) consumed fewer calories four weeks after receiving benefits than in the each of the first three weeks. Another study from the same period estimates that consumption (again measured by calorie intake) fell by roughly 9 to 12 percent over the course of a month.[35]

    More recent studies affirm these results. Adults participating in SNAP consume about 38 percent fewer calories per day in the last two days of the month than in the rest of the month, and about 25 percent less relative to their estimated energy requirement.[36] Working-age adults are also much more likely to skip meals or go without eating by the end of the month.[37] While SNAP participants may consume as many as 12 fewer meals, children — especially very young children — are less likely to skip meals, as parents shelter them from the effects of the benefit cycle. Elementary school children, however, may eat less during summer months when school is out of session, as described below.[38]

  • Hunger and food insecurity increase throughout the month. While going an entire day without eating is rare (only about 1 percent of SNAP participants do so, according to time use surveys), the probability of a day without eating roughly triples from the first to the last day of the month. The probability of eating less than usual is nearly 17 percentage points higher in the final days of the benefit cycle.[39] Similarly, a SNAP household is 11 percentage points likelier to be classified as food insecure near the end of or at the beginning of the benefit month than in the rest of the month.[40] In one mid-sized city, the chances of SNAP participants experiencing food insecurity rose by at least five times in the last third of a month.[41] And parents in a Midwestern city who were able to stretch benefits further into the month were less likely to experience very low food security or physiological symptoms of hunger, such as dizziness.[42]
  • Diet quality may be impaired by the end of the month. Research exploring changes in dietary quality over the benefit cycle is limited and offers mixed evidence that quality falls as benefits run out. Three studies found three- to five-point reductions in the Healthy Eating Index for foods purchased later in the month.[43] Another found that household purchases of perishable and healthier foods associated with higher HEI scores fell over the month, while purchases of non-perishable and less healthy foods were more constant.[44] In contrast, at least one study found no pattern in the amount of fruit and vegetables consumed, and HEI scores of African American people in low-income neighborhoods in Baltimore did not change based on the time since they received benefits.[45]
  • Some families may rely on numerous coping strategies to get through the month. Participants often manage the SNAP cycle through adjustments to shopping and eating patterns, emotional resilience, and social support. A little more than half of the participants in one study reported borrowing money for food, with the need to borrow increasing 37 percent over the month; 38 percent reported using a food bank.[46] Another study, however, found no relationship between reliance on coping strategies and the time until SNAP benefits ran out.[47]

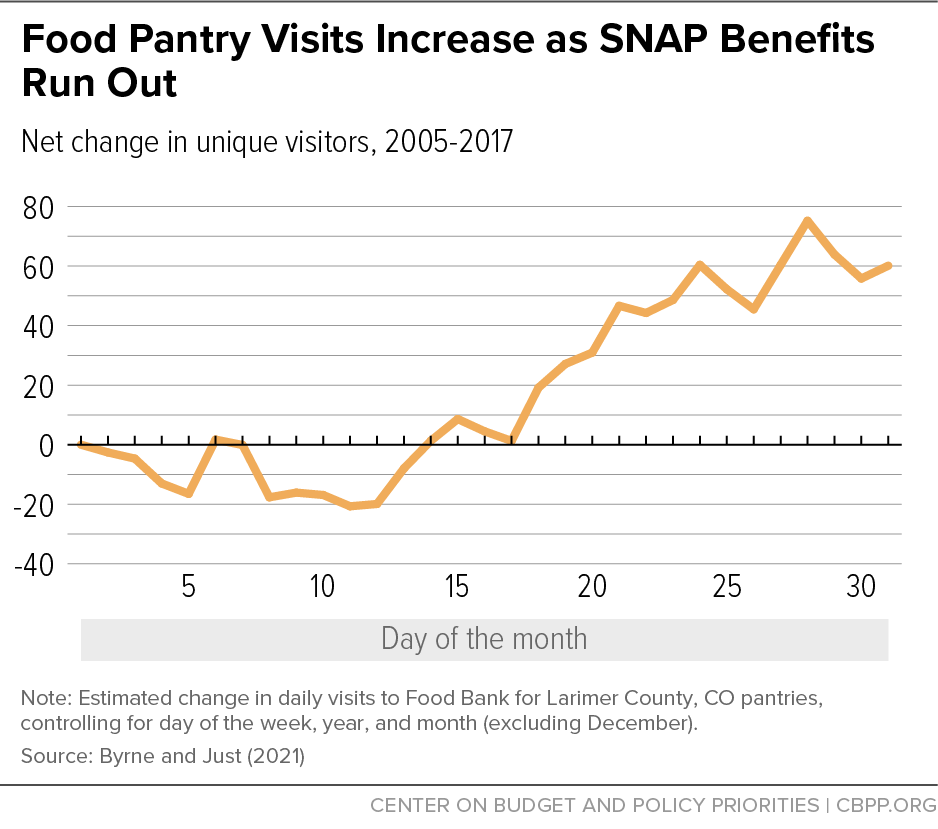
    Recent evidence also points to a relationship between the SNAP benefit cycle and reliance on other sources of food assistance (such as school meal programs and food pantries).[48] There is some evidence that SNAP households, especially those with older children in middle or high school, are more likely to participate in the school lunch and breakfast programs toward the end of the SNAP month. Similarly, visitation at food pantries in northern Colorado is relatively constant during the first ten days of the month as SNAP benefits are issued and then increases substantially toward the end of the month, suggesting that SNAP participants may turn to food pantries as they exhaust their SNAP benefits. (See Figure 3.) An analysis of national survey data also found evidence of greater reliance on community food assistance later in the month, when SNAP benefits were likely to run low.[49]

  • Running out of benefits may harm educational achievement and health. Recent research highlights various behavioral consequences of the monthly cycle in food consumption. For example, at the end of the benefit month, children’s test scores are lower, children are more likely to misbehave in school, and low-income high school students score lower on the SAT.[50] Non-white male middle-school students feel worse about themselves, feel as though they have less control over their lives, and have higher incidence of anxious and depressed thoughts late in the benefit cycle compared to white male students.[51]

    Food and financial shortfalls at the end of the benefit cycle may have negative impacts on health care use and chronic disease self-management.[52] The frequency of emergency room trips and hospital admissions may be related to the size and timing of SNAP benefits, research suggests. Emergency room visits and hospital admissions to treat low blood sugar (which can occur when people with diabetes reduce their food intake) were 27 percent higher in California’s low-income communities in the last week of the month than the first, and 7 percent higher nationally among people with incomes below the national median.[53] Emergency room visits for pregnancy-related conditions, childhood injuries, and older adults also appear to be associated with the SNAP benefit cycle.[54]

    Other research suggests the amount of a household’s SNAP benefit may be at least as important as its timing. Several studies focused on claims for treatment of hypoglycemia, hypertension, and childhood asthma found that larger benefit levels among a sample of SNAP households with very low incomes were associated with a modest reduction in emergency room visits and hospital admissions but showed no link to the timing of benefits. A $50 increase in monthly benefits, for example, is estimated to reduce the average number of hypoglycemia claims by 12 to 15 percent.[55] These results suggest that more generous SNAP benefits might help households avoid fluctuations in the quality and quantity of food that may result in low blood sugar and other diet-related conditions, thus reducing emergency room visits.

  • Increasing benefits lessens the benefit cycle. Recognizing SNAP’s effectiveness at providing economic stimulus and reducing hardship in a weak economy, the 2009 Recovery Act made several changes to SNAP, most notably a temporary, across-the-board benefit increase for all participants.[56] The Recovery Act raised SNAP’s maximum monthly benefit by 13.6 percent beginning in April 2009. SNAP benefits were expected to continue at the new, higher level until the program’s regular annual inflation adjustments to the maximum benefit overtook the Recovery Act adjustment. Food price inflation was lower than expected between 2009 and 2013, which delayed the date that the TFP would exceed the Recovery Act level. Congress ultimately accelerated the sunset of the temporary benefit increase, and as a result, every SNAP recipient except those in Hawai’i experienced a benefit cut in November 2013.[57]

    Before the Recovery Act’s benefit increase, SNAP participants’ daily calorie consumption fell by 38 percent in the last two days of the month; after those increases took effect, however, consumption in the last two days of the month was 14 percent higher compared with the same period before the Recovery Act.[58] Calorie intake as a percentage of estimated energy requirements and the probability of eating less both followed a similar pattern. Similarly, the declining value of SNAP benefits as inflation eroded the Recovery Act increase contributed to the re-emergence of the decline in food consumption over the benefit month.[59] This evidence suggests that increased benefits can help smooth food intake over the course of a month. It may also suggest that benefits’ adequacy might be more important than their timing in smoothing the cycle of consumption.

Families Report Tradeoffs, Struggles Due to Inadequate Benefits

The research reviewed in this paper demonstrates that for many families, SNAP benefits in conjunction with the other income they spend on food do not cover the cost of a nutritious diet throughout the month for all family members. Qualitative research shows how falling short on money for food each month affects families and how they try to cope with inadequate benefits.

In these qualitative studies, families describe the tradeoffs they must make between food and other necessities:

  • “I had to do without buying food in order to put gas in the truck to go to work the next day. . . . I get Food Stamps on the 5th. . . . Three weeks later, the food stamps are gone so at that point, the food’s coming out of my pocket and if I have money, I have to make that choice, you know? I have to have gas in order to work to make more money.”a
  • “[The] last week of the month is horrible because . . . if that week, anything happens, [you are going to have to go without]. For example, my son got mono four months ago [during that last week of the month], and he had to be seen and he had to have medication and so you think, ‘Okay, I’ve got $200 for food.’ [If] you go spend $88 on that and now what are you going to do? Food or medication?”b

Families also describe their struggle to afford an adequate, nutritious diet:

  • “We are surviving, yes. Do I think [SNAP benefits] provide all of the fruits and vegetables that we require for our diets? No. I mean, if you were just buying ramen noodles and packets of cheap noodles and bags of rice [it does].”c
  • “[S]ometimes you be wanting to eat healthy, but it’s very — food is expensive. Period. But it’s more expensive when you’re trying to eat healthy. . . . And you can’t eat healthy off of $169. So it’s like you gotta get what you can so you can get enough of it.”d
  • “Oh yeah, [SNAP] doesn’t cover a month. There is no way. It doesn’t cover a month, not with a growing ten-year-old. There is no way. Half the time I don’t eat. I’ll live on coffee and pain medication. That sounds awful but I can go without food. . . . That’s not the way to do it, I know, but when it comes to [him] eating or me, it’s going to be [him] every time.”e

a Kathryn Edin et al., “SNAP Food Security In-Depth Interview Study,” U.S. Department of Agriculture, March 2013, https://fns-prod.azureedge.net/sites/default/files/SNAPFoodSec.pdf.

b Ibid.

c Alethea Chiappone et al., “Perceptions and Experiences with SNAP and Potential Policies: Viewpoint from SNAP Participants,” Journal of Hunger & Environmental Nutrition, 14:1-2, 98-109, https://www.tandfonline.com/doi/full/10.1080/19320248.2018.1512927.

d Eliza Whiteman Kinsey et al., “Food and financial coping strategies during the monthly Supplemental Nutrition Assistance Program cycle,” Population Health, Vol. 7, April 2019, https://www.sciencedirect.com/science/article/pii/S2352827319300114.

e Edin et al.

SNAP Benefits Have Less Purchasing Power in Higher-Cost Areas

While SNAP benefits are adjusted each year to account for rising food prices, maximum benefits are the same across all states (except Alaska and Hawai’i) and D.C. This ensures that poor households with similar circumstances are eligible for the same SNAP benefits regardless of where they live. This uniformity is an important feature of SNAP and can reduce differences across the states in their overall financial support for low-income people, as some states where benefits stretch farther may have lower wages, lower cash assistance benefits, and higher poverty.

Food prices, however, are not the same across the country, and evidence suggests that the inadequacy of SNAP benefits is greater in areas where food prices are higher. Researchers estimated the cost of a meal in every county and concluded that low-income, food-secure households spend an average amount on food that is 27 percent higher than the maximum SNAP benefit per meal. While these households spend more on food, on average, than the per-meal value of the TFP in 99 percent of U.S. continental counties — suggesting that the TFP’s inadequacy is geographically widespread — there is substantial variation in the size of the gap.

The average low-income meal cost 45 percent more than the maximum per-meal SNAP benefit in the 310 U.S. counties (10 percent of continental U.S. counties) with the largest gap between average low-income meal costs and the SNAP maximum per-meal benefit. For some counties with especially high costs, the gap is even greater: in the 20 counties with the largest gap, the average low-income meal costs 68 to 136 percent more.[60] Another study found that adjusting for geographical price differences, which include not only regional differences in food prices but also region-specific seasonal effects and regional variations in household composition, would increase the value of the TFP by about 10 percent in the Northeast, Midwest, and South, and by 20 percent in the West.[61]

Other researchers estimate that 20 to 30 percent of SNAP households may not be able to purchase the TFP market basket because they live in areas with higher food prices, based on prices from stores where SNAP participants do most of their grocery shopping and from nearby stores where participants could also shop. (As discussed elsewhere, the TFP is a flawed measure of the cost of a healthy diet, so this figure does not represent the share of households that cannot afford a healthy diet.) The average shortfall among these households could be at least $50 and perhaps as much as $150 per month.[62] The difference among states in the real value of SNAP benefits ranges between 7 to 16 percentage points, or about $45 to $85 dollars per month for a family of four, another study estimates.[63]

The reduced purchasing power of SNAP benefits due to higher local food prices affects more than just the affordability of a nutritious diet. SNAP participants in high-priced areas are nearly 20 percent more likely to be food insecure than those in low-priced areas.[64]

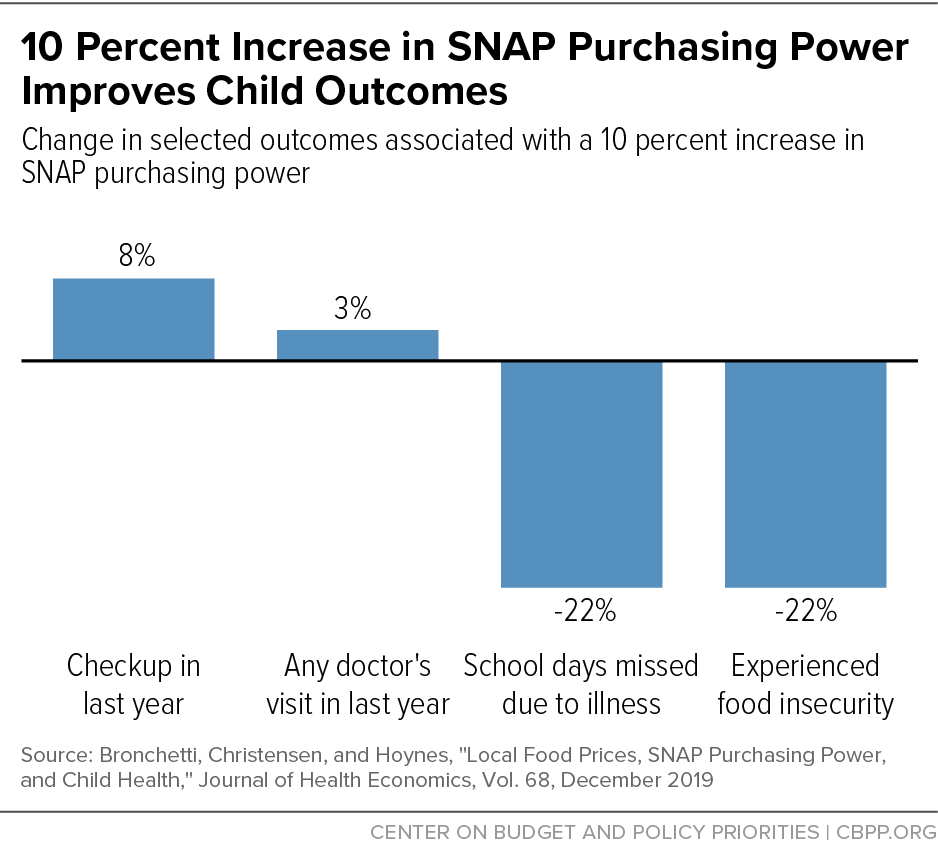
Modest increases in SNAP purchasing power are associated with improved use of health care (such as a greater likelihood of doctor’s visits), reduced food insecurity, and better school attendance (see Figure 4).[65] Higher SNAP purchasing power may improve children’s health and other outcomes if it leads to better diets, enables families to spend more on health care (by reducing pressure on their limited budgets), or reduces family stress, making it easier to get children to school or to the doctor for annual exams.

Differences in local and regional housing prices can also affect the adequacy of SNAP benefits. Housing accounts for about 40 percent of SNAP participants’ overall spending; food accounts for less than 25 percent. Families in areas with high housing costs may have less disposable income to spend on food. SNAP offers a deduction for excess shelter costs (including utilities) that exceed half of a participant’s net income after all other deductions (up to a cap for most households) when determining benefits. In principle, this deduction should help families in areas with high shelter costs, but the cap may limit its effectiveness.[66] Moreover, for households that receive the maximum SNAP benefit, higher housing costs can’t raise their benefits above this maximum.

Additional Benefits Increase Food Expenditures and Food Security

Recent research, much of it derived from natural or designed experiments, offers strong evidence that increasing SNAP benefits would make a meaningful difference for many participants’ food expenditures and food security.[67]

Notably, several researchers took advantage of the natural experiment presented by the 2009 Recovery Act’s temporary across-the-board benefit increase for all SNAP participants, along with other analytical methods, to analyze the impact of benefit increases and cuts on food expenditures, food security, diet quality, and other outcomes.

Increasing Benefits Raises — and Cutting Benefits Reduces — Food Expenditures

Basic economic theory predicts that raising SNAP benefits will increase spending on food at home for most households and that cutting benefits will reduce it. Even though SNAP benefits can only be spent on food, added benefits should also enable households to redirect funds they would otherwise have spent on food to other needs.

As expected, low-income households did increase their overall food expenditures (by about 5 to 10 percent) after implementation of the Recovery Act.[68] They also increased spending on housing, education, and transportation, which suggests that increasing SNAP benefits allows participants to better meet both food and other essential needs.[69]

As inflation eroded the real value of the Recovery Act increase, SNAP households’ food spending fell by 4 percent, or by about $26 per month for a family of four.[70] While food spending among SNAP households and eligible non-participating households decreased between 2012 and 2014 (after benefits were finally cut in November 2013), SNAP households lowered their food spending by 12 percent more than eligible non-participants even after controlling for other differences between the two groups.[71] Among SNAP participants enrolled in store loyalty programs in three major cities (Los Angeles, Atlanta, and Columbus), food spending fell by 30 percent when the benefit increase ended.[72]

Increasing Benefits Improves — and Cutting Benefits Reduces — Food Security

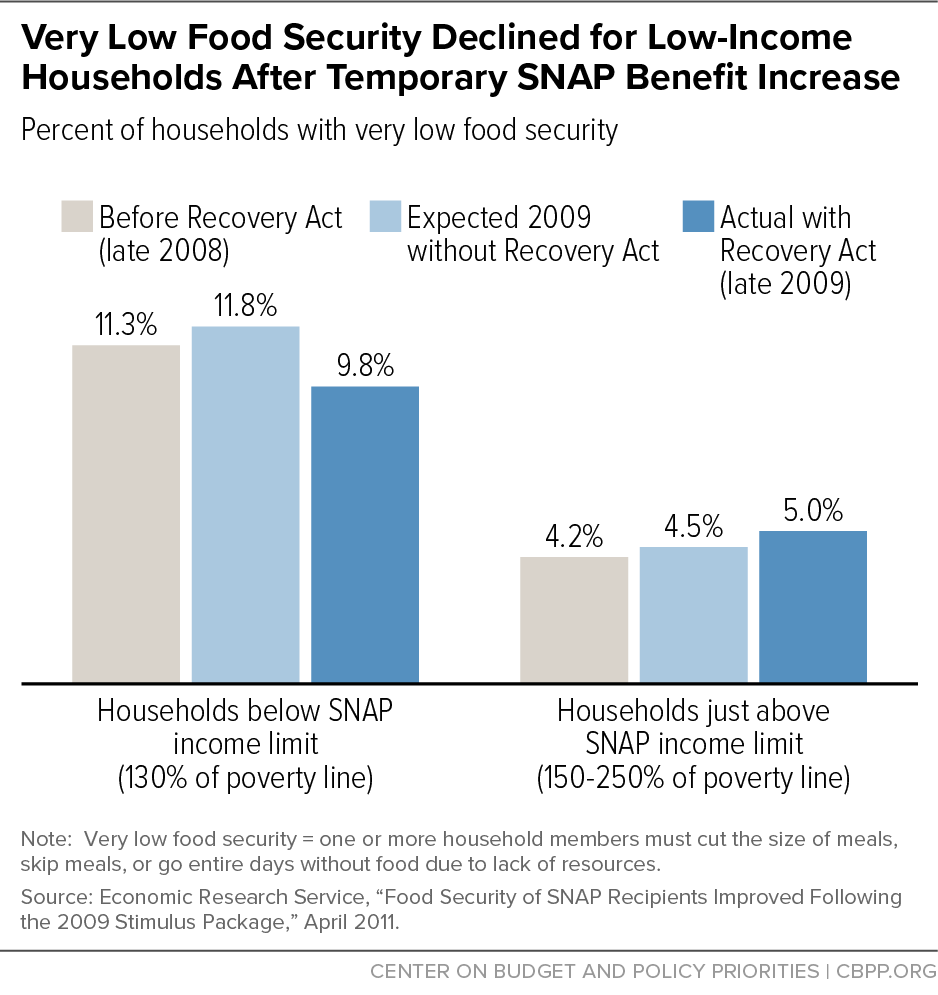
The share of households with very low food security was expected to rise in 2009 due to the Great Recession’s impact on income and employment. Yet very low food security fell that year — the year the benefit increase took effect — among households with incomes low enough to qualify for SNAP (130 percent of the poverty line or less). Among households with somewhat higher incomes, in contrast, very low food security rose in 2009, as expected (see Figure 5).[73] This evidence suggests the Recovery Act increase had a sizeable impact on reducing very low food security among SNAP participants, helping to cushion the blow of the recession by providing more resources for families to purchase food.[74]

As inflation eroded the value of the additional Recovery Act benefits between 2009 and 2011, the number of SNAP households with very low food security increased 17 percent, erasing nearly half of the improvement associated with the Recovery Act’s benefit increase. Very low food security did not rise among low-income households not receiving SNAP.[75] This, too, suggests a strong relationship between SNAP benefit levels and recipients’ food insecurity.

When benefits were cut in November 2013, food insecurity among households that consistently participated in SNAP rose by 8 percent more — and very low food security rose by 14 percent more — compared to other low-income households, after controlling for differences between the two groups.[76] A more recent analysis found that, among SNAP participants living in high-cost areas, the prevalence of low food security fell by 11 percentage points following the benefit increase, while the prevalence of very low food security increased by nearly 9 percentage points after benefits were reduced.[77]

USDA’s large-scale experiment with additional summer benefits for children provides additional evidence of the beneficial impact of SNAP benefit increases. Many low-income families cannot easily absorb gaps or reductions in nutrition assistance such as those that occur during summer months when children have no access to free or reduced-price meals at school. Households with school-aged children, limited income, and tight budgets increase their summer food spending by far less (just $2 per child per week, on average) than needed to fully offset the lost school meals.[78]

To help fill this gap, the Summer Electronic Benefit Transfer for Children demonstration (Summer EBT) gave participating households an extra $60 in SNAP benefits each month for each school-aged child. The results were striking: food expenditures rose by 10 percent, food insecurity fell by 21 to 34 percent, and three of eight measures of child nutrition outcomes improved modestly, including an increase in children’s fruit, vegetable, and dairy consumption (see Figure 6).[79]

In response to the impacts of the pandemic, Congress enacted P-EBT, which provided benefits for children receiving free- and reduced-price meals to replace lost school meals when schools are closed. Recently, policymakers extended this program to provide P-EBT benefits in the summer of 2021 (and states with P-EBT approved for the 2021-2022 school year may offer P-EBT in summer 2022 as well). President Biden has proposed making Summer EBT permanent in his American Families Plan.[80]

The beneficial impact on food security of an increase in benefits may depend in part on the size of the increase, evidence from two USDA-commissioned randomized control trials suggests. Kentucky’s Ticket to Healthy Food increased average monthly SNAP benefits for families with children in persistently poor rural counties by $21 (about 7 percent) to account for the cost of transportation to shop for groceries and commute to work. Nevada’s Healthy, Hunger Free Kids project increased average monthly SNAP benefits by $44 (roughly 10 percent) for families with young children and incomes well below the poverty line in selected Las Vegas neighborhoods with high rates of food insecurity and unemployment.

The benefit increases in both projects were substantially smaller than the increase provided in the Summer EBT demonstrations (up to $60 per month for each school-aged child) and the 2009 Recovery Act (under which half of all participating households received increases of at least 16 percent). As expected, the increased benefits led to more spending on food in both projects. Households in Kentucky spent an average of $20 out of the $21 in additional SNAP benefits on food purchases. Half of the families in Nevada increased their food spending by at least $23. SNAP benefits also lasted further into the month as households in Kentucky were more likely to report that benefits lasted at least three weeks. In neither instance, however, was the increase in food spending large enough to reduce the prevalence of food insecurity, at least in these targeted families and locales.[81]

More recently, the Families First Coronavirus Response Act provided temporary new authority and broad flexibility for USDA and states to address rising food needs during the public health emergency and economic shock from the pandemic. Brookings Institution researchers used the variation in when states issued P-EBT benefits to SNAP recipients to examine the impact of those benefits on food hardship. They used three measures from the Census Bureau’s Household Pulse Survey: food insecurity, the share of households reporting sometimes or often not having enough to eat, and the share reporting very low food security among children in their households. They found that P-EBT reduced food hardship among the lowest-income children by 30 percent in the week following its disbursement (based on the share reporting very low food security among children in their households) and prevented hunger for an estimated 2.7 to 3.9 million children.[82]

Evidence Is Mixed on Whether Benefit Increases Improve Diet Quality

In general, research on the relationship between income and diet quality, and the effect of benefit increases on diet quality, have been mixed. For example, the natural experiment offered by the Recovery Act SNAP benefit increase did not reveal consistent improvements in nutrient intake and diet quality.[83]

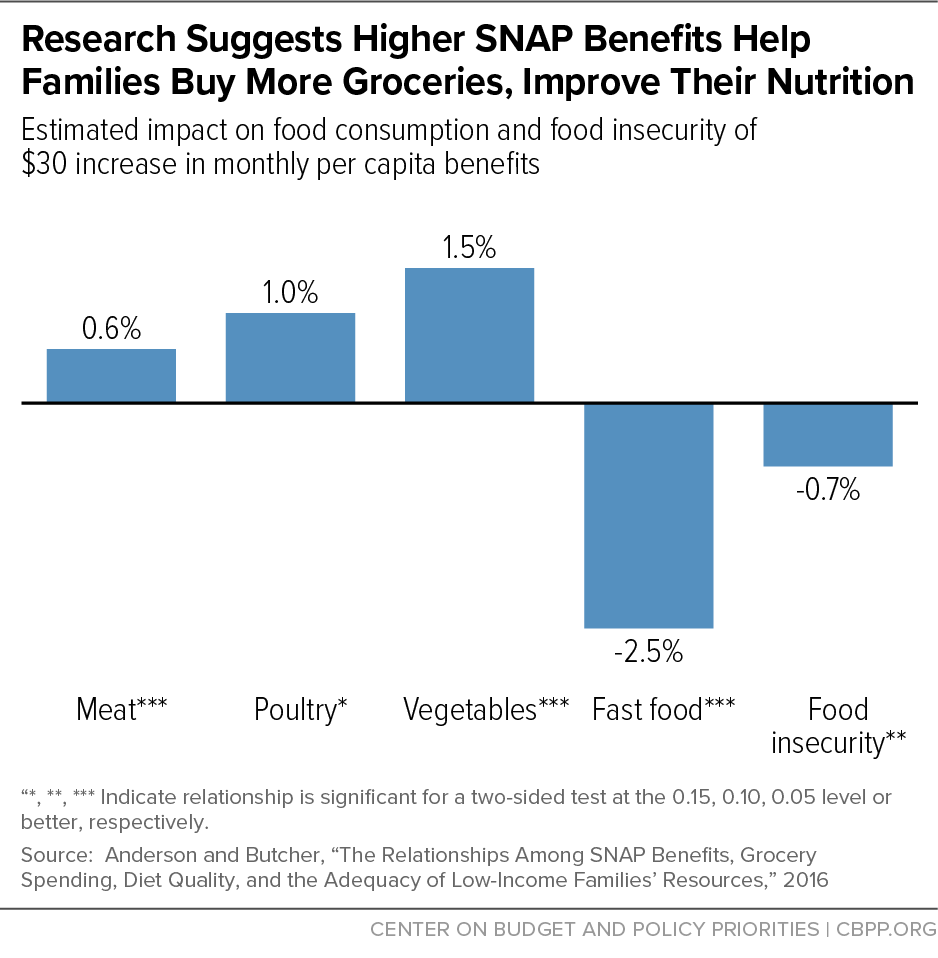
But other research using alternative methods to estimate the impact of a benefit increase on diet quality suggests raising SNAP benefits could improve the nutritional quality of participants’ diets. An additional $30 per person of monthly SNAP benefits could raise monthly food spending by $19 per person, based on the estimated associations between SNAP benefits, food spending, and diet quality, according to one analysis. Such an increase is associated with increases in the purchase of more nutritious foods. Most notably, overall consumption of vegetables could increase by 1.5 percent, with even larger increases in tomatoes and yellow vegetables (see Figure 7).[84]

Other research analyzing the relationship between SNAP benefit levels and diet quality among SNAP participants suggests that increasing benefits by about one-third could raise the HEI scores for SNAP households by about 34 to 42 percent, depending on household size.[85] In addition, increases in food spending among those who spend the least on food have the most potential to improve diet quality, research shows. Among those who consumed lower-cost diets, a $100-per-month increase (from, for example, $150 to $250), was associated with a 20 percent increase in the HEI while the estimated return on additional spending was smaller among those with higher diet costs.[86] In a recent study, cost was the most common environmental barrier SNAP participants identified to a healthy diet, suggesting that increasing benefits could enable many participants to afford healthier food.[87]

Benefit Increases May Improve Health and Reduce Health Care Costs

Studies suggest that health care use and costs respond to changes in SNAP benefits. Research suggests that the Recovery Act’s benefit increases were associated with a small reduction in the chances that a child with low income would forgo needed medication because the family could not afford its cost, a small reduction in the chances that children in single-parent families were unable to afford needed health care, and somewhat healthier weight outcomes among toddlers and adolescents.[88] In addition, the number and cost of hospital admissions covered by Medicaid grew more slowly after the increases took effect and accelerated when those benefits were cut.[89] Other research found that young children in SNAP households were as likely to be “well” as children from non-participating low-income households in the years before implementation of the Recovery Act, but more likely to be “well” in the years after. This suggests a possible link between benefit adequacy and child health.[90]

Research using other methods to analyze SNAP benefit adequacy similarly finds that benefit changes can affect health. One analysis, for example, concluded that a 10 percent increase in SNAP purchasing power (in places where SNAP benefits can purchase more food because food prices are lower) increased the likelihood a child had a check-up in the past year by 8 percent and that children had any doctor’s visit in the past 12 months by 3 percent. The authors suggested that increased SNAP purchasing power may indirectly affect health care usage, such as increased purchasing power reducing parental stress, thereby freeing up bandwidth for activities such as taking children to the doctor. These findings aren’t driven by children lacking health insurance, as children in households participating in SNAP are likely eligible for Medicaid or CHIP, and the authors found no relationship between SNAP purchasing power and the likelihood a child has no insurance, ruling out health insurance coverage as a factor explaining the relationship between SNAP and health care use and health.[91]

Increased SNAP Benefits Would Help Reduce Child Poverty

Children growing up in families with incomes below the poverty line typically fare worse — in physical and mental health, educational attainment and labor market success, and engagement in risky behaviors and delinquency — than children from wealthier families. Recognizing these harmful consequences, Congress directed the National Academies in 2015 to identify evidence-based programs and policies that could reduce the number of children living in poverty by half within ten years.

The expert panel found compelling evidence of SNAP’s importance in the lives of children and their families. SNAP is second only to the combined effects of the Earned Income Tax Credit (EITC) and the refundable portion of the Child Tax Credit in lifting children’s incomes above the poverty line, and no program is more effective than SNAP in lifting children out of deep poverty (with income less than half of the poverty line). SNAP also improves food security and health outcomes for children and their families.

The panel concluded that while no single program or policy could achieve the goal of cutting child poverty in half, a combination of expanded work supports and increases in selected means-tested benefits — including SNAP — could. Specifically, raising the maximum SNAP benefit by 35 percent, increasing benefits for older children, and expanding Summer EBT demonstration nationwide, when coupled with increases in the EITC and Child Tax Credit and an expansion of housing vouchers, could reduce the number of children in poverty and in deep poverty by half. Policy options focused on work alone would fall far short of this goal, the panel found.[92] The American Rescue Plan included temporary expansions of both programs that will result in historic child poverty reductions; this impact would be even greater if Congress permanently adopts these expansions.[93]

Increased SNAP Benefits Could Address Disproportionate Impacts of Benefit Inadequacy on People of Color

Barriers to opportunity, including past and present discrimination in private markets and public policies and disparities in access to employment, education, and health care, remain significant. They have kept poverty and food insecurity rates more than twice as high for Black and Latino households than for white households (published reports on poverty rates and food insecurity rates do not report separate data for American Indians, Alaska Natives, Native Hawaiians, and other Pacific Islanders).[94] While white households made up the majority of SNAP-participating households, Black, Latino, American Indian and Alaska Native, and Native Hawaiian and other Pacific Islander households were disproportionately represented among SNAP participants in 2019.[95]

Because of SNAP’s role in addressing higher food insecurity among people of color, ensuring benefits are adequate is especially important for those communities. For example, in a study analyzing low-income households and SNAP participants’ responses to a question of how much more income the household needs to afford adequate food — an amount that rises among lower-income households and households with more severe levels of food insecurity — food-insecure Black households participating in SNAP reported needing an average of about $49 more per week to become food secure, substantially more than the $38 white households reported they would need.[96]

Moreover, evidence suggests that the current SNAP benefit calculation may be especially inaccurate at estimating food needs for people of color. For example, the TFP, reflecting dietary guidelines, includes a significant number of dairy products (which can be a low-cost way to meet the dietary guidelines), even though at least 25 percent of the U.S. population is lactose intolerant and cannot easily digest dairy products. Lactose intolerance is disproportionately prevalent among people of color, affecting nearly all Native Americans, large majorities of Asian American and Pacific Islander and Black individuals, and most Latino individuals.[97] Yet, while people in the United States have consumed, on average, less than one serving of milk per day since the 1970s, the TFP includes more than three servings per day.[98]

How Much More Is Needed?

The research summarized here indicates that current SNAP benefits are not sufficient to meet the nutrition needs of many households struggling to afford food with low incomes: food insecurity persists, even among current SNAP participants; many households lack the combination of time and money needed to purchase and prepare a nutritious diet; and the monthly benefit cycle as families exhaust their SNAP benefits adversely affects consumption, food security, dietary quality, and a host of other outcomes.

Research on how much more is needed to eliminate hunger and food insecurity and mitigate other adverse consequences is limited but offers some useful insights. When asked directly, food-insecure participants say they need roughly $10 to $20 more per person each week to buy just enough food to meet their needs.[99] While some may underreport and others may exaggerate their need, these responses roughly indicate participants’ perceptions. Other researchers estimate the cost of an average low-income meal in every county, finding that maximum monthly SNAP benefits fall short of the cost of the average low-income meal by roughly $11 per person per week.[100]

The potential reduction in food insecurity among low-income individuals and families would, of course, depend on how much SNAP benefits are increased. Evidence from evaluations of the Recovery Act and Summer EBT experiences described above suggest that relatively modest increases in benefits could reduce food insecurity among participants by at least 10 to 20 percent — and reduce the most severe form of food insecurity among children by 30 percent, a good start but well below fully addressing food insecurity.

Other researchers have simulated the potential impacts of larger increases. One analysis suggests that increasing maximum benefits by 20 percent — to what is roughly the value of USDA’s Low-Cost Food Plan, one of four food plans including the TFP — would reduce the prevalence of food insecurity among SNAP participants by 46 percent. Another suggests that increasing maximum benefits by about 24 percent on average to reflect average food spending per meal by low-income, food-secure households would reduce the prevalence of food insecurity among SNAP recipients by 51 percent. And a third analysis estimates that based on what participants say they need to be food secure, a $42 increase in SNAP benefits per household per week — a roughly 42 percent increase in maximum SNAP benefits — would reduce the prevalence of food insecurity by 62 percent.[101]

Topics:

End Notes

[1] Fiscal year 2019 is the last full year prior to the onset of the COVID-19 pandemic and provides a better measure of the structural adequacy of SNAP benefits than more recent years. Because of temporary increases in SNAP benefits enacted in response to the pandemic, the average benefit in fiscal year 2020 ($1.75) includes emergency SNAP allotments provided under the Families First Coronavirus Response Act.

[2] Dottie Rosenbaum et al., “Food Assistance in American Rescue Plan Act Will Reduce Hardship, Provide Economic Stimulus,” Center on Budget and Policy Priorities, May 7, 2021, https://www.cbpp.org/research/food-assistance/food-assistance-in-american-rescue-plan-act-will-reduce-hardship-provide; CBPP, “Tracking the COVID-19 Recession’s Effects on Food, Housing, and Employment Hardships,” updated July 12, 2021, https://www.cbpp.org/research/poverty-and-inequality/tracking-the-covid-19-recessions-effects-on-food-housing-and; Brynne Keith-Jennings et al., “Number of Families Struggling to Afford Food Rose Steeply in Pandemic and Remains High, Especially Among Children and Households of Color,” Center on Budget and Policy Priorities, April 27, 2021, https://www.cbpp.org/research/food-assistance/number-of-families-struggling-to-afford-food-rose-steeply-in-pandemic-and.

[3] Most of this research was conducted prior to the onset of the COVID-19 pandemic. While the response to the pandemic included significant investments in food assistance programs to mitigate the extraordinarily high levels of hunger and hardship, the relief is temporary and does not address more fundamental shortcomings in the adequacy of SNAP benefits. Thus, the research cited in this paper remains highly relevant and reflects the adequacy of SNAP benefits when temporary nutrition assistance measures end if action isn’t taken to update the Thrifty Food Plan.

[4] Laura Castner et al., “Benefit Redemption Patterns in the Supplemental Nutrition Assistance Program in Fiscal Year 2017,” Insight Policy Research, September 2020, https://www.fns.usda.gov/snap/benefit-redemption-patterns-snap-fy-2017#:~:text=On%20average%2C%20SNAP%20households%20had,before%20receiving%20their%20next%20issuance.

[5] Erin Bronchetti, Garret Christensen, and Benjamin Hansen, “Variation in Food Prices and SNAP Adequacy for Purchasing the Thrifty Food Plan,” University of Kentucky Center for Poverty Research Discussion Paper Series, 2016, https://uknowledge.uky.edu/cgi/viewcontent.cgi?referer=https://scholar.google.com/&httpsredir=1&article=1117&context=ukcpr_papers.

[6] Julie Caswell and Ann Yaktine, eds., Supplemental Nutrition Assistance Program: Examining the Evidence to Define Benefit Adequacy, Institute of Medicine and National Research Council, Washington, D.C.: National Academies Press, 2013, https://fns-prod.azureedge.net/sites/default/files/ops/IOMSNAPAllotments.pdf.

[7] While all these factors are potentially important, we focus this research review on the adequacy of SNAP’s maximum allotments and on the TFP on which those allotments are based, largely because existing research offers evidence on both the adequacy of the TFP and the consequences of increasing SNAP benefits. Other features of the program’s basic design, such as its benefit reduction rate, deductions from gross income, and nutrition education, can also affect adequacy, but less is known about how well these features align with the circumstances of low-income households in the 21st century and the consequences of potential alternatives.

A notable exception is Joshua Leftin et al., “Examination of the Effect of SNAP Benefit and Eligibility Parameters on Low-Income Households,” Decision Demographics and Mathematica Policy Research, October 2017, https://fns-prod.azureedge.net/sites/default/files/ops/SNAPBEP.pdf. It concludes that SNAP deductions generally reflect the actual expenditures of low-income households eligible for those deductions, but many other households have large expenses that current rules do not allow them to claim. For example, while households may deduct out-of-pocket medical expenses exceeding $35 per month for health care for elderly or disabled members, data from the Consumer Expenditure Survey show that low-income households with no elderly or disabled members who report health care expenditures (about 47 percent of such households) incur nearly $225 per month in non-reimbursed medical expenses, on average.

[8] The Food Research and Action Center (FRAC) has also reviewed the research on SNAP benefit adequacy. See “Initiatives to Make SNAP Benefits More Adequate Significantly Improve Food Security, Nutrition, and Health,” February 2019, http://frac.org/wp-content/uploads/snap-initiatives-to-make-snap-benefits-more-adequate.pdf; and “Replacing the Thrifty Food Plan in Order to Provide Adequate Allotments for SNAP Beneficiaries,” December 2012, http://frac.org/wp-content/uploads/thrifty_food_plan_2012.pdf.

[9] The TFP market basket for each age-gender group (such as female adults aged 19-50) consists of food amounts for 29 food categories. The cost of each TFP market basket is adjusted for inflation by applying the consumer price index (CPI) that corresponds to each of the food categories that make up the TFP. For example, the CPI for breakfast cereals is applied to the cost of the TFP food category “whole grain cereals.” The updated costs of the food categories are then added up to arrive at the new cost of the TFP market basket.

[10] While the technical details of the TFP’s mathematical approach have received relatively little scrutiny by outside experts, some critics have proposed simpler theoretical models that are arguably easier to interpret than the USDA formulation. See Parke Wilde and Joseph Llobrera, “Using the Thrifty Food Plan to assess the cost of a nutritious diet,” Journal of Consumer Affairs, 43(2): 274-304, 2009, https://onlinelibrary.wiley.com/doi/pdf/10.1111/j.1745-6606.2009.01140.x; Angela Babb, Daniel Knudsen, and Scott Robeson, “A critique of the objective function utilized in calculating the Thrifty Food Plan,” PloS One, 14(7): e0219895, 2019, https://journals.plos.org/plosone/article?id=10.1371/journal.pone.0219895; and Angela Babb, “America’s ‘Thrifty Food Plan’: Hunger, mathematics, and the valuation of nutrition assistance,” Annals of the American Association of Geographers, 110(4): 983-1004, 2020, https://www.tandfonline.com/doi/abs/10.1080/24694452.2019.1664889.

[11] “HEI Scores for Americans,” Food and Nutrition Service, USDA, January 2019, https://www.fns.usda.gov/hei-scores-americans.

[12] Andrea Carlson et al., “Thrifty Food Plan, 2006,” Center for Nutrition Policy and Promotion, USDA, April 2007, https://fns-prod.azureedge.net/sites/default/files/usda_food_plans_cost_of_food/TFP2006Report.pdf.

[13] Adam Drewnowski and Petra Eichelsdoerfer, “Can low-income Americans afford a healthy diet?” Nutrition Today, 44(6): 246-249, https://www.ncbi.nlm.nih.gov/pmc/articles/PMC2847733/; and Wilde and Llobrera, op. cit. While whole milk is largely omitted, lower-fat milk products are overrepresented.

[14] James P. Ziliak, “Modernizing SNAP Benefits,” The Hamilton Project, Brookings Institution, May 2016, http://www.hamiltonproject.org/assets/files/ziliak_modernizing_snap_benefits.pdf.

[15] Maeve Gearing, Sujata Dixit-Joshi, and Laurie May, “Barriers That Constrain the Adequacy of Supplemental Nutrition Assistance Program (SNAP) Allotments: Survey Findings, USDA, Food and Nutrition Service, June 2021, https://www.fns.usda.gov/snap/barriers-constrain-adequacy-snap-allotments.

[16] Households make decisions on what to produce and what to consume within the constraints of their budget and available time. See Gary Becker, “A Theory of the Allocation of Time,” Economic Journal, 75(299): 493-517, 1965, https://www.jstor.org/stable/2228949 for an economic model of household production that formalizes the cost of time.

[17] The average retail price for canned black beans as purchased in a grocery store is lower than the price of dried beans ($0.95 vs $1.40 per pound in 2016), but the average cost of canned beans “as consumed” after discarding the liquid content is double that of dried beans after rehydrating and cooking ($0.56/cup vs $0.24/cup). See USDA Economic Research Service, Fruit and Vegetable Prices, https://www.ers.usda.gov/data-products/fruit-and-vegetable-prices/fruit-and-vegetable-prices/#Vegetables.

[18] Michelle Ver Ploeg et al., “Access to Affordable and Nutritious Food — Measuring and Understanding Food Deserts and Their Consequences: Report to Congress,” USDA Economic Research Service, June 2009, https://www.ers.usda.gov/publications/pub-details/?pubid=42729; Karen Hamrick et al., “How Much Time Do Americans Spend on Food?” USDA Economic Research Service, November 2011, https://www.ers.usda.gov/publications/pub-details/?pubid=44609.

[19] George Davis and Wen You, “The Time Cost of Food at Home: General and Food Stamp Participant Profiles,” Applied Economics, 42(20): 2537-2552, 2010, https://www.tandfonline.com/doi/abs/10.1080/00036840801964468; George Davis and Wen You, “The Thrifty Food Plan Is Not Thrifty When Labor Cost Is Considered,” Journal of Nutrition, 140(4): 854-857, 2010, https://academic.oup.com/jn/article/140/4/854/4743306; and Christian Raschke, “Food stamps and the time cost of food preparation,” Review of Economics of the Household, 10(2): 259-275, 2012, https://link.springer.com/article/10.1007/s11150-011-9128-3.

[20] Ziliak, op. cit.

[21] These estimates were calculated for the 1999 TFP; estimates for the 2006 TFP have yet to be calculated, in large part because USDA did not develop comparable recipes for the last update. See Diego Rose, “Food Stamps, the Thrifty Food Plan, and Meal Preparation: The Importance of the Time Dimension for US Nutrition Policy,” Journal of Nutrition Education and Behavior, 39(4): 226–232, 2007, https://www.sciencedirect.com/science/article/pii/S1499404607004708; George Davis and Wen You, “Not enough money or not enough time to satisfy the Thrifty Food Plan? A cost difference approach for estimating a money-time threshold,” Food Policy, 36(2):101-107, 2011, https://www.sciencedirect.com/science/article/pii/S0306919210000941.

[22] Karen Hamrick and Ket McClelland, “Americans’ Eating Patterns and Time Spent on Food: The 2014 Eating & Health Module Data,” USDA Economic Research Service, July 2016, https://www.ers.usda.gov/publications/pub-details/?pubid=80503; and Raschke, op. cit. SNAP participants, on average, also spend 55 minutes grocery stopping once every seven days. The authors do not discuss reasons why SNAP participants spend more time preparing food. One potential factor may be that a greater share of food purchases among SNAP participants are for foods to be prepared at home, which require more time preparing. For example, a 2017 study found that 74 percent of SNAP households’ food purchasing is for food-at-home spending, compared to 65 percent for eligible non-participant households and 62 percent for all U.S. households. Laura Tiehen, Constance Newman, and John Kirlin, “The Food-Spending Patterns of Households Participating in the Supplemental Nutrition Assistance Program: Findings From USDA’s FoodAPS,” USDA Economic Research Service, August 2017, https://www.ers.usda.gov/webdocs/publications/84780/eib-176.pdf?v=42962.

[23] The 2006 TFP market baskets did not meet the recommendations for vitamin E and potassium for some age-gender groups and did not meet the recommendations for sodium for most age-gender groups. See “Thrifty Food Plan, 2006,” Center for Nutrition Policy and Promotion, USDA, April 2007, https://www.fns.usda.gov/thrifty-food-plan-2006-report.

[24] Ziliak, op. cit.

[25] Angela M. Babb et al., “An examination of medically necessary diets within the framework of the Thrifty Food Plan,” Ecology of Food and Nutrition, 58(3): 236-246, 2019, https://doi.org/10.1080/03670244.2019.1598978.

[26] According to the most recent USDA data, 28 percent of households redeem at least 90 percent of their benefits within 7 days of issuance; 53 percent redeem at least 90 percent within 14 days. See Laura Castner et al., op. cit. The cyclical pattern may vary considerably across SNAP households. One study attributes the benefit cycle to a minority (39 percent) of SNAP households that spend two-thirds of their monthly benefits within the first four days. The larger remaining group of SNAP participants, in contrast, spend only one-sixth early in the month. See Jeffrey Dorfman et al., “Re-examining the SNAP benefit cycle allowing for heterogeneity,” Applied Economic Perspectives and Policy, 41(3): 404-433, 2019, https://onlinelibrary.wiley.com/doi/10.1093/aepp/ppy013. Another study found a cyclical pattern of weekly food spending in a sample of low-income households in Minneapolis-St. Paul shortly after they enrolled in a nutrition assistance program modeled after SNAP but not before. See Sruthi Valluri et al., “Trends in cyclical food expenditures among low-income households receiving monthly nutrition assistance: results from a prospective study,” Public Health Nutrition, 24(3): 1-8, 2020, https://www.cambridge.org/core/journals/public-health-nutrition/article/abs/trends-in-cyclical-food-expenditures-among-lowincome-households-receiving-monthly-nutrition-assistance-results-from-a-prospective-study/517FA05377A2A86C4612A5BA5A961A96.

[27] Carole Trippe and Daisy Ewell, “An Analysis of Cash Food Expenditures of Food Stamp Households,” Memorandum 466 prepared for the USDA Food and Nutrition Service under contract FNS-02-030-TNN / 43-3198-3-3724, August 15, 2007; Tiehen, Newman, and Kirlin, op. cit.

[28] Many states stagger the issuance of SNAP benefits over multiple days at the beginning of the month. As a result, the SNAP “benefit month” does not always coincide with the calendar month. It is important that researchers control for this difference to separate the impacts of the SNAP benefit cycle from the impacts of other monthly cycles (such as the receipt of Social Security, cash assistance payments, or earned income). The strongest studies capture the length of time since the most recent SNAP issuance rather than time since the beginning of the month.

[29] Tiehen, Newman, and Kirlin, op. cit.; Travis Smith et al., “The Effects of Benefit Timing and Income Fungibility on Food Purchasing Decisions Among Supplemental Nutrition Assistance Program Households,” American Journal of Agricultural Economics, 98(2): 564–80, 2016, https://onlinelibrary.wiley.com/doi/10.1093/ajae/aav072; Michael Kuhn, “Causes and Consequences of the Calorie Crunch,” University of Kentucky Center for Poverty Research Discussion Paper Series, DP2016-11, 2016, https://uknowledge.uky.edu/ukcpr_papers/112/. Related research suggests that introducing EBT substantially reduced the expenditure cycle among households with children. Food expenditures for a household with one adult and two children, for example, were $19 higher in the fourth week of the benefit cycle after EBT was implemented; this increase was made possible by a reduction in the large spending spike in the first week. See Michael Kuhn, “Cyclical Food Insecurity and Electronic Benefit Transfer,” unpublished manuscript, April 2018, https://pages.uoregon.edu/mkuhn/pdfs/k_comb.pdf.

[30] Justine S. Hastings and Ebonya L. Washington, “The first of the month effect: consumer behavior and store responses,” American Economic Journal: Economic Policy, 2(2): 142-162, 2010, https://www.aeaweb.org/articles?id=10.1257/pol.2.2.142; and Rebecca Franckle et al., “Supermarket purchases over the Supplemental Nutrition Assistance Program benefit month: a comparison between participants and nonparticipants,” American Journal of Preventive Medicine, 57(6): 800-807, 2019, https://www.sciencedirect.com/science/article/abs/pii/S0749379719303496.

[31] In general, this research deals with prices “generated” by households due to changes in shopping behavior, financial constraints, or quality substitutions. It does not deal directly with changes in prices set by retailers.

[32] Mary Zaki and Jessica Todd, “Price consciousness at the peak of ‘impatience’,” Journal of Human Resources, February 10, 2021, http://jhr.uwpress.org/content/early/2021/02/03/jhr.59.1.0121-11411.abstract.

[33] Purya Valizadeh, Travis Smith, and Michele Ver Ploeg, “Do SNAP households pay different prices throughout the benefit month?” Applied Economic Perspectives and Policy, October 2020, https://onlinelibrary.wiley.com/doi/abs/10.1002/aepp.13094.

[34] Timothy Beatty and Xinzhe Cheng, “Food price variation over the SNAP benefit cycle,” prepared for presentation at the Annual Meeting Agricultural and Applied Economics Association, July 31-August 2, 2016, https://ageconsearch.umn.edu/record/236012/.

[35] Parke Wilde and Christine Ranney, “The monthly Food Stamp cycle: shopping frequency and food intake decisions in an endogenous switching regression framework,” American Journal of Agricultural Economics, 82(1): 200–213, 2000, https://onlinelibrary.wiley.com/doi/abs/10.1111/0002-9092.00016. Wilde and Ranney found that 42 percent of households receiving food stamps conducted a major grocery shopping trip once per month or less frequently. These households were more likely than other low-income households to be infrequent shoppers due to transportation difficulties, time constraints, or stigma associated with food stamps. Jesse Shapiro, “Is there a Daily Discount Rate? Evidence from the Food Stamp Nutrition Cycle, Journal of Public Economics, 89(2-3): 303-325, 2005, http://www.brown.edu/Research/Shapiro/pdfs/highfreq111703.pdf.

[36] Jessica Todd, “Revisiting the Supplemental Nutrition Assistance Program cycle of food intake: Investigating heterogeneity, diet quality, and a large boost in benefit amounts,” Applied Economic Perspectives and Policy, 37(3): 437-458, 2015, https://academic.oup.com/aepp/article-abstract/37/3/437/8261.

[37] Jessica Todd and Christian Gregory, “Changes in Supplemental Nutrition Assistance Program real benefits and daily caloric intake among adults,” Food Policy, August 2018, https://onlinelibrary.wiley.com/doi/10.1093/aepp/ppu039.

[38] Kuhn, 2016, op. cit.

[39] Karen Hamrick and Margaret Andrews, “SNAP participants’ eating patterns over the benefit month: a time use perspective,” PloS One, 11(7): e0158422, 2016, http://journals.plos.org/plosone/article?id=10.1371/journal.pone.0158422; Todd, op. cit.

[40] Christian Gregory and Travis Smith, “Salience, food security, and SNAP receipt,” Journal of Policy Analysis and Management, 38(1): 124-154, 2019, https://onlinelibrary.wiley.com/doi/epdf/10.1002/pam.22093. Gregory and Smith’s finding that SNAP households have a higher propensity to report food hardships at the end of the benefit month is consistent with existing literature on the benefit cycle, but they also found that the propensity to report food hardships was higher at the beginning of the month as well. They suggest that recent experiences of hardships at the end of the month may still be fresh in recipients’ minds even after they have received benefits, or that SNAP households may feel they need to justify receiving SNAP benefits.

[41] James Weinstein, Katie Martin, and Ann Ferris, “Household food security varies within month and is related to childhood anemia,” Journal of Hunger & Environmental Nutrition, 4(1): 48-61, 2009, https://www.tandfonline.com/doi/abs/10.1080/19320240802706833.

[42] Eric Calloway et al., “Monthly SNAP benefit duration and its association with food security, hunger-coping, and physiological hunger symptoms among low-income families,” Journal of Applied Research on Children, 6(2), 2015, https://digitalcommons.library.tmc.edu/childrenatrisk/vol6/iss2/5/.

[43] The HEI is a measure of diet quality used to assess how well a set of foods aligns with key recommendations of the Dietary Guidelines for Americans. The maximum possible score is 100, though the typical American diet falls well short of the ideal. See Eliza Whiteman, Benjamin Chrisinger, and Amy Hillier, “Diet quality over the monthly Supplemental Nutrition Assistance Program cycle,” American Journal of Preventive Medicine, 55(2): 205-212, 2018, https://www.sciencedirect.com/science/article/pii/S0749379718317343; Amy Hillier et al., “The Influence of SNAP Participation and Food Environment on Nutritional Quality of Food at Home Purchases,” University of Kentucky Center for Poverty Research Discussion Paper Series, DP2016-10, 2016, https://uknowledge.uky.edu/ukcpr_papers/111/; and Michael Kuhn, “Who feels the calorie crunch and when? The impact of school meals on cyclical food insecurity,” Journal of Public Economics 166: 27-38, 2018, https://www.sciencedirect.com/science/article/abs/pii/S0047272718301452. All three studies use national data on food purchases. A third study, based on a small sample of women receiving SNAP benefits in Texas, found even larger reductions in the HEI four weeks after benefit receipt. See Namrata Sanjeevi and Jeanne Freeland-Graves, “Monthly variations in dietary intake of women participating in the Supplemental Nutrition Assistance Program,” Journal of the Academy of Nutrition and Dietetics, 119(2): 261-271, 2019, https://www.sciencedirect.com/science/article/pii/S221226721830755X.

[44] Smith et al., op. cit.

[45] Todd, op. cit. and Anna Kharmats et al., “Relation between the Supplemental Nutritional Assistance Program cycle and dietary quality in low-income African Americans in Baltimore, Maryland,” American Journal of Clinical Nutrition, 99(5): 1006-1014, 2014, https://www.ncbi.nlm.nih.gov/pmc/articles/PMC3985207/. The latter study is based on a small, non-random sample that is not easily generalized to a larger population.

[46] Anika Schenck-Fontaine, Anna Gassman-Pines, and Zoelene Hill, “Use of informal safety nets during the Supplemental Nutrition Assistance Program benefit cycle: how poor families cope with within-month economic instability,” Social Service Review, 91(3): 456-487, September 2017, https://www.journals.uchicago.edu/doi/pdfplus/10.1086/694091. This study is based on a small, non-random sample of predominately African American families that is not easily generalized to a larger population.

[47] Calloway et al., op. cit.

[48] Agustina Laurito and Amy Ellen Schwartz, “Does school lunch fill the ‘SNAP gap’ at the end of the month?” Southern Economic Journal, 86(1): 49-82, 2019, https://onlinelibrary.wiley.com/doi/abs/10.1002/soej.12370.

[49] Anne Byrne and David Just, “The other half: an examination of monthly food pantry cycles in the context of SNAP benefits,” Applied Economic Perspectives and Policy, January 2021, https://onlinelibrary.wiley.com/doi/abs/10.1002/aepp.13150; and Linlin Fan et al., “The use of charitable food assistance among low‐income households in the United States,” Journal of the Academy of Nutrition and Dietetics, 121(1): 27–35, 2020, https://jandonline.org/article/S2212-2672(20)30995-3/fulltext.

[50] Anna Gassman-Pines and Laura Bellows, “Food instability and academic achievement: a quasi-experiment using SNAP benefit timing,” American Educational Research Journal, 55(5): 897-927, 2018, http://journals.sagepub.com/doi/10.3102/0002831218761337; Chad Cotti, John Gordanier, and Orgul Ozturk, “When does it count? The timing of food stamp receipt and educational performance,” Economics of Education Review, 66: 40-50, 2018, https://www.sciencedirect.com/science/article/abs/pii/S0272775718303649; Lisa Gennetian et al., “Supplemental Nutrition Assistance Program (SNAP) benefit cycles and student disciplinary infractions,” Social Service Review, 90(3): 403-33, 2016, https://www.journals.uchicago.edu/doi/abs/10.1086/688074; and Timothy Bond et al., “Hungry for Success? SNAP Timing, High-Stakes Exam Performance, and College Attendance,” National Bureau of Economic Research, January 2021, https://www.nber.org/papers/w28386.

[51] Keenan Marchesi, “The Impact of the SNAP Distribution Cycle on Student Non-Cognitive Outcomes,” unpublished manuscript, December 2019, https://www.clarku.edu/departments/economics/wp-content/blogs.dir/5/files/sites/130/2019/12/KMarchesi_JMP_ForPosting.pdf.

[52] Bita Farkhad, Chad Meyerhoefer, and James Dearden, “The within-month pattern of medical care utilization among SNAP households,” prepared for Agricultural & Applied Economics Association Annual Meeting, July 2017, https://ageconsearch.umn.edu/record/258361/files/Abstracts_17_05_24_11_45_07_15__128_180_43_235_0.pdf. This study, which looked at SNAP benefits and health care consumption among one- and two-parent households, found that the decline in medical care use occurs mainly in two-parent households; and Eliza Kinsey et al., “Chronic disease self-management during the monthly SNAP cycle,” Current Developments in Nutrition, 3(Supplement 1): nzz051-P04, 2019, https://academic.oup.com/cdn/article/3/Supplement_1/nzz051.P04-193-19/5517923. This study is based on a small, non-random sample of African American women that is not easily generalized to a larger population.

[53] Hilary Seligman et al., “Exhaustion of food budgets at month’s end and hospital admissions for hypoglycemia,” Health Affairs, 33(1): 116-123, 2014, https://www.healthaffairs.org/doi/full/10.1377/hlthaff.2013.0096; and Sanjay Basu, Seth Berkowitz, and Hilary Seligman, “The monthly cycle of hypoglycemia: an observational claims-based study of emergency room visits, hospital admissions, and costs in a commercially insured population,” Medical Care, 55(7): 639-645, 2017, https://journals.lww.com/lww-medicalcare/fulltext/2017/07000/The_Monthly_Cycle_of_Hypoglycemia__An.1.aspx. Neither study accounts for differences between the calendar month and the SNAP issuance cycle (most states stagger issuance of SNAP benefits over several days of each month), so it is difficult to attribute the results solely to the timing of SNAP benefits; other factors — such as receipt of monthly paychecks — may also be at work.

[54] Irma Arteaga, Colleen Heflin, and Leslie Hodges, “SNAP benefits and pregnancy-related emergency room visits,” Population Research and Policy Review, 37(6): 1031-1052, 2018, https://link.springer.com/article/10.1007/s11113-018-9481-5; Colleen Heflin et al., “Childhood injuries and food stamp benefits: an examination of administrative data in one US state,” BMC Pediatrics, 20(1): 1-8, 2020, https://bmcpediatr.biomedcentral.com/articles/10.1186/s12887-020-02084-y#citeas; and Chad Cotti, John Gordanier, and Orgul Ozturk, “Hunger pains? SNAP timing and emergency room visits,” Journal of Health Economics, 71, 102313, 2020, https://www.sciencedirect.com/science/article/abs/pii/S0167629619301316.

[55] While the study did not control for household income or expenses, the study sample was limited to SNAP households also participating in Medicaid in Missouri, which had very stringent household income limits (in most cases, households had incomes below 33 percent of the poverty line). The authors explain that their results are biased downward (households with larger benefits, after adjusting for household size, have lower levels of income or higher expenses, along with other unobserved factors correlated with health disadvantage). The protective effect of larger SNAP benefits compensated for the negative selection among households with higher SNAP benefits. See Colleen Heflin, Leslie Hodges, and Peter Mueser, “Supplemental Nutrition Assistance Program benefits and emergency room visits for hypoglycaemia,” Public Health Nutrition, 20(7): 1314-1321, 2017, https://www.cambridge.org/core/journals/public-health-nutrition/article/supplemental-nutrition-assistance-progam-benefits-and-emergency-room-visits-for-hypoglycaemia/D8A24285B12FC9B6C03069CAE62DC90A; Chinedum Ojinnaka and Colleen Heflin, “Supplemental Nutrition Assistance Program size and timing and hypertension-related emergency department claims among Medicaid enrollees,” Journal of the American Society of Hypertension (2018), https://doi.org/10.1016/j.jash.2018.10.001; and Colleen Heflin et al., “SNAP benefits and childhood asthma,” Social Science & Medicine, 220: 203-211, 2019, https://www.sciencedirect.com/science/article/abs/pii/S0277953618306294.

[56] The Families First Coronavirus Response Act enacted in March 2020 allows states to issue temporary emergency allotments up to the maximum benefit that a SNAP household can receive. More recently, Congress temporarily raised maximum allotments for all households to 115 percent of the June 2020 value of the TFP between January and September 2021. There are no assessments of the impact of these changes yet.

[57] As noted above, USDA sets SNAP benefits for Alaska, Hawaiʻi, Guam, and the Virgin Islands differently from the rest of the country because the cost of food is different in these areas. Thus, these areas experienced different benefit increases than the rest of the United States. Because Hawaiʻi’s Thrifty Food Plan exceeded Recovery Act levels beginning in fiscal year 2013, its SNAP benefits were already set higher than Recovery Act levels, so its residents did not experience a cut when the Recovery Act provision expired in November 2013. SNAP households in Alaska, Guam, and the Virgin Islands experienced a benefit cut in November 2013 that was the same in proportional terms, but slightly different in dollar terms, from the cut in the 48 other states and the District of Columbia.

[58] Todd, op. cit.

[59] Todd and Gregory, op. cit.

[60] Elaine Waxman, Craig Gundersen, and Megan Thompson, “How Far Do SNAP Benefits Fall Short of Covering the Cost of a Meal?” Urban Institute, February 2018, https://www.urban.org/sites/default/files/publication/96661/how_far_do_snap_benefits_fall_short_of_covering_the_cost_of_a_meal_2.pdf.

[61] George Davis, Wen You, and Yangliang Yang, “Are SNAP benefits adequate? A geographical and food expenditure decomposition,” Food Policy, 95: 101917, 2020, https://www.sciencedirect.com/science/article/abs/pii/S0306919220301214.

[62] If SNAP households can identify and shop at the store with the lowest food cost in their area, the fraction that can afford the TFP rises above 90 percent. This assumption, however, is unlikely to hold for many SNAP households. The median size of the counties in this study is over 600 square miles, making it extremely unlikely that shoppers could identify and travel to the lowest-cost store. Even if they could, they would incur significant travel costs, which may outweigh their savings on food. See Bronchetti, Christensen, and Hansen, op. cit. See also Garret Christensen and Erin Bronchetti, “Local food prices and the purchasing power of SNAP benefits,” Food Policy, 95: 101937, 2020, https://www.swarthmore.edu/sites/default/files/assets/documents/user_profiles/ebronch1/FoodAPSPaper_Revision_2019.12.17_compiled.pdf.

[63] Qingxiao Li and Metin Çakır, “Thrifty Food Plan panel price index and the real value of SNAP benefits,” prepared for presentation at the 2020 Agricultural & Applied Economics Association Annual Meeting, Kansas City, Missouri, July 26-28, 2020, https://ssrn.com/abstract=3669951.

[64] Christian Gregory and Alisha Coleman-Jensen, “Do high food prices increase food insecurity in the United States?” Applied Economic Perspectives and Policy, 35(4): 679-701, 2013, https://onlinelibrary.wiley.com/doi/10.1093/aepp/ppt024.

[65] These studies are based on survey data that predate the Affordable Care Act’s Medicaid expansion for adults. In Erin Bronchetti, Garret Christensen, and Hilary Hoynes, “Local food prices, SNAP purchasing power, and child health,” Journal of Health Economics, 68: 102231, 2019, https://www.sciencedirect.com/science/article/abs/pii/S0167629619304151, the authors use National Health Interview Survey data from 1999 to 2010, while Bronchetti, Christensen, and Hansen, op. cit. use National Household Food Acquisition and Purchase Survey data from 2012.

[66] Laura Castner and James Mabli, “Low-Income Household Spending Patterns and Measures of Poverty,” Mathematica Policy Research, April 2010, https://fns-prod.azureedge.net/sites/default/files/SpendingPatterns.pdf.

[67] Increasing SNAP benefits would have different effects depending on participants’ current spending on food and their outstanding needs. Many households would increase overall food spending, some could buy a similar quantity of food but shift toward buying more nutritious products, and others could shift non-SNAP income currently spent on food to other basic needs. An estimated 15 to 30 percent of SNAP households may be “extra-marginal,” meaning their SNAP benefits equal or exceed what they report spending on food at home. Households may be extra-marginal if they do not need more food than what they can purchase with SNAP benefits, or if they do need more food than what they can purchase with their SNAP benefits but their income is so low that they must spend all of it meeting other basic needs and have no income available for food. See David Johnson et al., “Assessing the effectiveness of SNAP by examining extramarginal participants,” University of Michigan Institute for Social Research Population Studies Center, April 2018, https://www.psc.isr.umich.edu/pubs/abs/14834. Research shows high rates of food insecurity for SNAP households with the lowest incomes, suggesting that current benefits are inadequate for these households. A benefit increase would likely make a meaningful difference in the lives of most participating households.

[68] Mark Nord and Mark Prell, “Food Security Improved Following the 2009 ARRA Increase in SNAP Benefits,” USDA Economic Research Service, April 2011, https://www.ers.usda.gov/webdocs/publications/44837/7469_err116.pdf?v=7982.4; Charlotte Tuttle, “The stimulus act of 2009 and its effect on food-at-home spending by SNAP participants,” USDA Economic Research Service, August 2016, https://www.ers.usda.gov/publications/pub-details/?pubid=74689; Pourya Valizadeh and Travis Smith, “How did the American Recovery and Reinvestment Act affect the material well-being of SNAP participants? A distributional approach,” Applied Economic Perspectives and Policy, 42(3): 455-476, 2019, https://onlinelibrary.wiley.com/doi/abs/10.1093/aepp/ppy039.

[69] Jiyoon Kim, “Do SNAP participants expand non-food spending when they receive more SNAP benefits? — Evidence from the 2009 SNAP benefits increase,” Food Policy 65(64): 9-20, 2016, https://www.sciencedirect.com/science/article/pii/S0306919216304341. These results are similar to research showing that participating in SNAP substantially increases spending on housing and utilities, education and other enrichment activities, and transportation. See Lorenzo Almada and Jaehyun Nam, “The effects of SNAP on non-food expenditure: an instrumental variables approach,” unpublished manuscript, 2016, https://data.ers.usda.gov/FANRP-ridge-project-summaries.aspx?type=2&summaryId=270.

[70] Mark Nord, “Effects of the decline in the real value of SNAP benefits from 2009 to 2011,” USDA Economic Research Service, August 2013, https://www.ers.usda.gov/publications/pub-details/?pubid=45102.

[71] Jiyoon Kim, Matthew Rabbitt, and Charlotte Tuttle, “Changes in Low-income households’ spending and time use patterns in response to the 2013 sunset of the ARRA-SNAP benefit,” Applied Economic Perspectives and Policy, 42(4): 2020, https://onlinelibrary.wiley.com/doi/abs/10.1093/aepp/ppz007.

[72] Gregory Bruich, “The effect of SNAP benefits on expenditures: New evidence from scanner data and the November 2013 benefit cuts,” Harvard University, unpublished manuscript, 2014, http://scholar.harvard.edu/files/bruich/files/bruich_2014b.pdf.

[73] Nord and Prell, op. cit.

[74] Nord and Prell, op. cit. This study concluded that the SNAP benefit increase “played a substantial role in the improvement” of low-income households’ food security improvements from 2008 to 2009. During this time, the odds of low food security among this population declined by about 20 percent, and the odds of food insecurity declined by about 11 percent among all low-income households. Because these improvements are concentrated among SNAP households, which make up about half of low-income households, these effects were likely much greater.

The data available at this time so far suggests that food insecurity increased markedly during the COVID-19 pandemic and economic fallout. The additional nutritional benefits appeared to have helped, but not enough to reverse the trend toward higher levels of food insecurity. This may be in part because the initial increase in food assistance provided was not well targeted and the poorest households didn’t get additional assistance, some of the benefits took a long time to roll out, and the nature of the crisis — which affected a very large group of households and disrupted school as well as employment — may have taken a larger toll. There are also questions about the comparability of the survey data. Additional data and research in the coming years will help to understand the nature of hardship during the pandemic. See Brynne Keith-Jennings et al., op cit.

[75] Nord, op. cit.

[76] Among households that participated less frequently in the prior 12 months, food insecurity increased by 7 percent and very low food security increased by 9 percent. Bhagyashree Katare and Jiyoon Kim, “Effects of the 2013 SNAP benefit cut on food security,” Applied Economic Perspectives and Policy, 39(4): 662–681, 2017, https://onlinelibrary.wiley.com/doi/10.1093/aepp/ppx025.

[77] These researchers found no significant difference in the prevalence of food insecurity among participants in low-cost areas. See Xinzhe Cheng, Young Jo, and Jiyoon Kim, “Heterogeneous impact of supplemental nutrition assistance program benefit changes on food security by local prices,” American Journal of Preventive Medicine, 58(3): e97-e103, 2020, https://www.sciencedirect.com/science/article/abs/pii/S0749379719304787.

[78] Lorenzo Almada and Ian McCarthy, “It’s a cruel summer: Household responses to reductions in government nutrition assistance,” Journal of Economic Behavior & Organization, 143(11): 45-57, 2017, http://www.sciencedirect.com/science/article/pii/S0167268117302330.

[79] The demonstration initially provided a monthly benefit of $60 in the summer of 2012 and then compared the relative effectiveness of a smaller benefit ($30) in the summers of 2013 and 2014. The results suggested that both increases produced similar improvement in the most severe form of food insecurity among children. See Ann Collins and Jacob Klerman, “Improving nutrition by increasing Supplemental Nutrition Assistance Program benefits,” American Journal of Preventive Medicine, 52(2S2): S179-S185, 2017, https://www.sciencedirect.com/science/article/pii/S0749379716303890.

[80] Zoë Neuberger, “Recovery Legislation Could Help End Summer Childhood Hunger,” CBPP, June 30, 2021, https://www.cbpp.org/research/food-assistance/recovery-legislation-could-help-end-summer-childhood-hunger.

[81] Gregory Chojnacki et al., “A randomized controlled trial measuring effects of extra Supplemental Nutrition Assistance Program (SNAP) benefits on child food security in low-income families in rural Kentucky,” Journal of the Academy of Nutrition and Dietetics, 121(1): S9-S21, 2021, https://www.sciencedirect.com/science/article/pii/S2212267220305426; and Phillip Gleason et al., “Measuring the effects of a demonstration to reduce childhood food insecurity: A randomized controlled trial of the Nevada Healthy, Hunger Free Kids project,” Journal of the Academy of Nutrition and Dietetics, 121(1): S22-S33, 2021, https://www.sciencedirect.com/science/article/pii/S2212267220302094.

The research teams identified several reasons why these demonstrations did not find the expected improvements in food security status comparable to previous research. Improving local economies may have made it easier for some households to meet their food needs even without the projects’ benefits. In addition, the benefit increase may have been targeted to households that were less likely to face food insecurity to begin with. Families typically address the nutritional needs of very young children before those of older children and adults, for example, so modest increases in food assistance may be unlikely to translate into further improvements in food security among these children. In addition, some have noted that the standard measure of food security, where a household is either food secure or not, does not capture the effects of improvements that lessen food hardship even if they fall short of completely lifting households out of food insecurity. Incorporating measures of the depth and severity of food insecurity would allow for a more nuanced assessment of potential improvements in food insecurity status due to higher benefits. See Craig Gundersen, “A consideration of the Evaluation of Demonstration Projects to End Childhood Hunger (EDECH),” Journal of the Academy of Nutrition and Dietetics, 121(1): S78-S80, 2021, https://jandonline.org/article/S2212-2672(20)30547-5/fulltext.

[82] Lauren Bauer et al., “The Effect of Pandemic EBT on Measures of Food Hardship,” Hamilton Project, July 2020, https://www.hamiltonproject.org/assets/files/P-EBT_LO_7.30.pdf. The American Rescue Plan of 2021 ensures that states can provide P-EBT benefits for the full duration of the public health emergency, including during the summer.

[83] Geetha Waehrer, Partha Deb, and Sandra L. Decker, “Did the 2009 American Recovery and Reinvestment Act affect dietary intake of low-income individuals?” Economics & Human Biology, 19: 170-183, 2015, https://www.sciencedirect.com/science/article/pii/S1570677X1500060X; and Katelin Hudak, Elizabeth Racine, and Lisa Schulkind, “An increase in SNAP benefits did not impact food security or diet quality in youth,” Journal of the Academy of Nutrition and Dietetics. 121(3): 507-519, 2020, https://www.sciencedirect.com/science/article/abs/pii/S2212267220313198.

[84] Patricia Anderson and Kristin Butcher, “The Relationships Among SNAP Benefits, Grocery Spending, Diet Quality, and the Adequacy of Low-Income Families’ Resources,” CBPP, June 14, 2016, https://www.cbpp.org/research/food-assistance/the-relationships-among-snap-benefits-grocery-spending-diet-quality-and#:~:text=Despite%20SNAP's%20reach%2C%20questions%20remain,per%20month%20among%20SNAP%20recipients. There is also some evidence that raising food expenditures — both out of pocket and from SNAP benefits — is associated with increases in fruit and vegetable consumption. See Namrata Sanjeevi and Jeanne Freeland-Graves, “Association of grocery expenditure relative to Thrifty Food Plan Cost with diet quality of women participating in the Supplemental Nutrition Assistance Program,” Journal of the Academy of Nutrition and Dietetics, 118(12): 2315-2323, 2018, https://www.sciencedirect.com/science/article/pii/S2212267218307640. This study is based on a small, non-random sample of primarily Hispanic women in central Texas that is not easily generalized to a larger population.

[85] Rebecca Cleary, Clare Cho, and Becca Jablonski, “SNAP Benefit Allotments and Dietary Quality,” prepared for presentation at the 2018 Agricultural & Economics Association Annual Meeting, August 2018.

[86] Chelsea Rose et al., “Small increments in diet cost can improve compliance with the Dietary Guidelines for Americans,” Social Science & Medicine, 266: 113359, 2020, https://www.sciencedirect.com/science/article/abs/pii/S0277953620305785.

[87] Maeve Gearing, Sujata Dixit-Joshi, and Laurie May, “Barriers That Constrain the Adequacy of Supplemental Nutrition Assistance Program (SNAP) Allotments: Survey Findings,” USDA, Food and Nutrition Service, June 2021, https://www.fns.usda.gov/snap/barriers-constrain-adequacy-snap-allotments.

[88] Most children in families with low incomes were eligible for Medicaid and the Children’s Health Insurance Program (CHIP) even before the Affordable Care Act. In the study sample, approximately 6 percent of low-income children had delayed care due to cost. Three percent and 4 percent of children in low-income households and low-income single-parent households, respectively, reported needing health care but not being able to afford it. Taryn Morrissey and Daniel Miller, “Supplemental Nutrition Assistance Program participation improves children’s health care use: an analysis of the American Recovery and Reinvestment Act's natural experiment,” Academic Pediatrics, 20(6): 863-870, 2020, https://www.sciencedirect.com/science/article/abs/pii/S1876285919304619; and Katelin Hudak and Elizabeth Racine, “Do additional SNAP benefits matter for child weight? Evidence from the 2009 benefit increase,” Economics & Human Biology, 41: 100966, 2020, https://www.sciencedirect.com/science/article/pii/S1570677X20302367.

[89] Rajan Sonik, Susan Parish, and Monika Mitra, “Inpatient Medicaid usage and expenditure patterns after changes in Supplemental Nutrition Assistance Program benefit levels,” Preventing Chronic Disease, 15: e120, 2018, https://europepmc.org/articles/pmc6178899. These results, based on national data on hospital admissions, are consistent with earlier research based on admissions in Massachusetts following the Recovery Act increases. See Rajan Sonik, “Massachusetts inpatient Medicaid cost response to increased Supplemental Nutrition Assistance Program benefits,” American Journal of Public Health, 106(3): 443–448, 2016, https://ajph.aphapublications.org/doi/full/10.2105/AJPH.2015.302990.

[90] Elizabeth March et al., “Boost to SNAP Benefits Protected Young Children’s Health,” Children’s HealthWatch, October 2011, https://childrenshealthwatch.org/wp-content/uploads/SNAPincrease_brief_October2011.pdf. A child was considered “well” if she was not overweight or underweight and her parents reported her to be in good health, developing normally for her age, and never hospitalized.

[91] The authors hypothesize that parental stress and bandwidth may explain the relationship between SNAP and child check-ups, but cannot directly test this in the study. See Bronchetti, Christensen, and Hoynes, op. cit.

[92] National Academies of Sciences, Engineering, and Medicine, A Roadmap to Reducing Child Poverty. Washington, D.C.: The National Academies Press, February 2019, http://sites.nationalacademies.org/dbasse/bcyf/reducing_child_poverty/index.htm. While the authors discuss two SNAP expansions (which would expand the maximum benefit by 20 and 30 percent), they also propose a 35 percent benefit increase as part of a package that would reduce child poverty by 50 percent (which they term the “means-tested supports and work poverty reduction package”).

[93] Chuck Marr et al., “American Rescue Plan Act Includes Critical Expansions of Child Tax Credit and EITC, CBPP, March 12, 2021, https://www.cbpp.org/research/federal-tax/american-rescue-plan-act-includes-critical-expansions-of-child-tax-credit-and; CBPP, “Make Child Tax Credit Improvements Permanent in Upcoming Recovery Legislation,” June 21, 2021, https://www.cbpp.org/blog/make-child-tax-credit-improvements-permanent-in-upcoming-recovery-legislation.

[94] For example, poverty rates were twice as high for Black (18.8 percent) and Hispanic people (15.7 percent) as non-Hispanic white people (7.3 percent) in 2019; the poverty rate among Asian Americans and Pacific Islanders (10.2 percent) was 40 percent higher. Jessica Semega et al., Income and Poverty in the United States: 2019, U.S. Census Bureau, September 2020, https://www.census.gov/library/publications/2020/demo/p60-270.html. Non-Hispanic Black households were more than twice as likely — and Hispanic households twice as likely — to be food insecure in 2019 (19.1 percent and 15.6 percent, respectively) as non-Hispanic white households (7.9 percent). Very low food security among children, while rare, is five times more likely among non-Hispanic Black households than among non-Hispanic white households (1.7 vs 0.3 percent). Coleman-Jensen et al., op. cit.

[95] SNAP households with a Black head of household accounted for 12.4 percent of U.S. households in 2018 but 26.6 percent of households participating in SNAP. Similarly, households headed by a Hispanic or Latino (of any race) individual accounted for 13.5 percent of households and 22.3 percent of SNAP households. Households headed by an American Indian or Alaska Native individual made up 0.7 percent of households but 1.5 percent of SNAP households. Households with a white head of household, in contrast, accounted for 76.0 percent of households but only 59.3 percent of SNAP households. Households headed by an Asian individual made up 4.9 percent of U.S. households but 2.9 percent of SNAP households. See Tracy Loveless, “Supplemental Nutrition Assistance Program (SNAP) Receipt for Households: 2018,” U.S. Census Bureau, June 2020, https://www.census.gov/library/publications/2020/demo/acsbr20-01.html.

[96] Craig Gundersen, Brent Kreider, and John V. Pepper, “Reconstructing the Supplemental Nutrition Assistance Program to more effectively alleviate food insecurity in the United States,” Russell Sage Foundation Journal of the Social Sciences, 4(2): 113–130, 2018, https://www.jstor.org/stable/pdf/10.7758/rsf.2018.4.2.06.pdf.

[97] Andrea Wiley, Re-imagining Milk: Cultural and Biological Perspectives, London and New York: Routledge 2015 as cited in Angela Babb, “America’s ‘Thrifty Food Plan’: hunger, mathematics, and the valuation of nutrition assistance,” Annals of the American Association of Geographers, 110(4): 983-1004, 2020, https://www.tandfonline.com/doi/abs/10.1080/24694452.2019.1664889.

[98] Hayden Stewart, Diansheng Dong, and Andrea Carlson, “Why Are Americans Consuming Less Fluid Milk? A Look at Generational Differences in Intake Frequency,” Economic Research Service, USDA, May 2013, https://ageconsearch.umn.edu/record/262223/; and Andrea Carlson et al., op. cit.

[99] Gundersen, Kreider, and Pepper, op. cit.; Anderson and Butcher, op. cit. For comparison, the average SNAP benefit per person in fiscal year 2018 was $125 per month or $29 per week.

[100] The authors estimate a national average cost of a low-income meal by using the food spending reported by low-income but food-secure households in the Current Population Survey. This national cost of a meal is then adjusted at the county level using the county-level cost of a TFP market basket. See Waxman, Gundersen, and Thompson, op. cit.

[101] Ziliak, op. cit.; Craig Gundersen, Elaine Waxman, and Amy Crumbaugh, “An examination of the adequacy of supplemental nutrition assistance program (SNAP) benefit levels: impacts on food insecurity,” Agricultural and Resource Economics Review, 48(3): 433-447, 2019, https://www.cambridge.org/core/journals/agricultural-and-resource-economics-review/article/an-examination-of-the-adequacy-of-supplemental-nutrition-assistance-program-snap-benefit-levels-impacts-on-food-insecurity/59160A1F2A28CFA2DB686516C144B388; and Gundersen, Kreider, and Pepper., op. cit.