Charges Against SNAP Miss the Mark
With some in Congress on record as favoring large cuts in SNAP (the Supplemental Nutrition Assistance Program, formerly food stamps) and many states reimposing the austere three-month time limit on SNAP benefits for unemployed childless adults, the American Enterprise Institute’s Robert Doar has issued a highly critical blog post on SNAP. [1] Unfortunately, the post is marred by inaccurate information and the incomplete (and sometimes misleading) presentation of data. Doar contends that SNAP participation today is much higher than it should be because SNAP “is not responding properly to improving economic conditions, promoting work successfully, or maintaining its focus on the poor.” We examine each of these claims.
SNAP’s Response to Changes in Poverty and the Economy
SNAP expanded considerably when the severe recession hit. That is what it is designed to do — expand and contract in response to changes in the number of people with incomes below or modestly above the poverty line. “[T]he primary reason for the increase in the number of participants was the deep recession . . . and the subsequent slow recovery,” the Congressional Budget Office (CBO) concluded in 2012.[2]
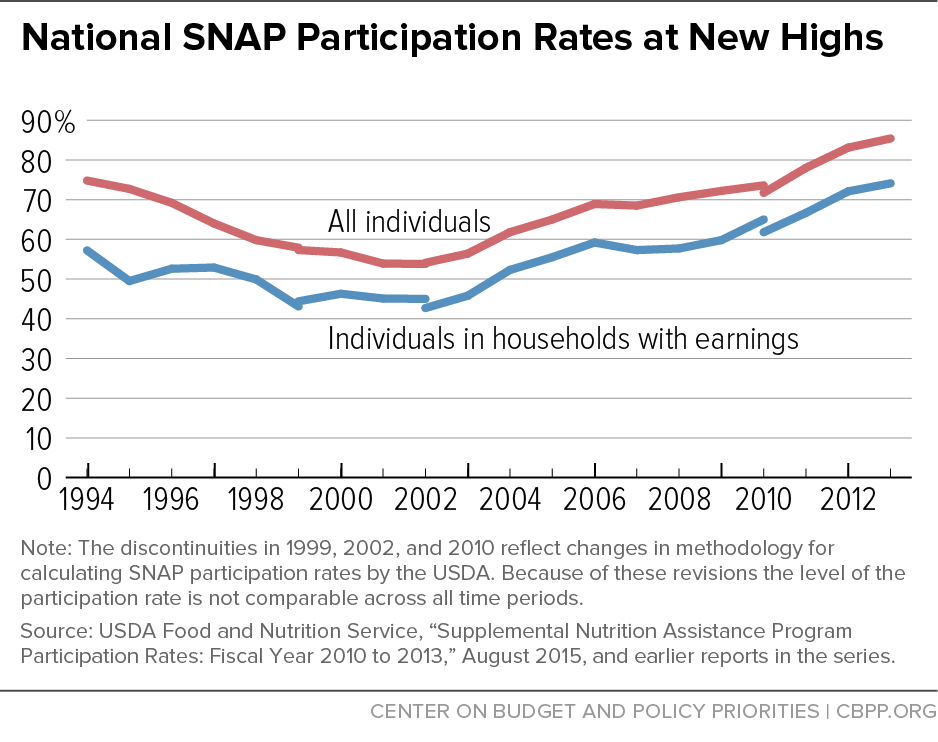
The other primary driver of SNAP growth was increased participation among eligible households, particularly among eligible working families. SNAP’s participation rate overall rose from 69 percent to 85 percent between 2007 and 2013 (the latest year for which participation rate estimates are available) — and from 57 percent to 74 percent for people in households with earnings. (See Figure 1.) These increases likely reflect, in part, the widespread and prolonged effects of the recession, as many poor households became poorer and may have been in greater need of help. They also likely reflect federal and state efforts begun before the recession to reach more of the eligible households — primarily working families and seniors — by simplifying SNAP policies and procedures.
Two policy changes to many states’ SNAP eligibility rules also contributed modestly to caseload growth. First, more states adopted “broad-based categorical eligibility,” a state option that allows them to provide food assistance to households — primarily working families and seniors — with gross incomes or assets modestly above federal SNAP limits but disposable incomes in most cases below the poverty line. Second, because of the recession, more areas of the country qualified for temporary waivers from the severe three-month time limit on SNAP benefits for unemployed childless adults.[3]
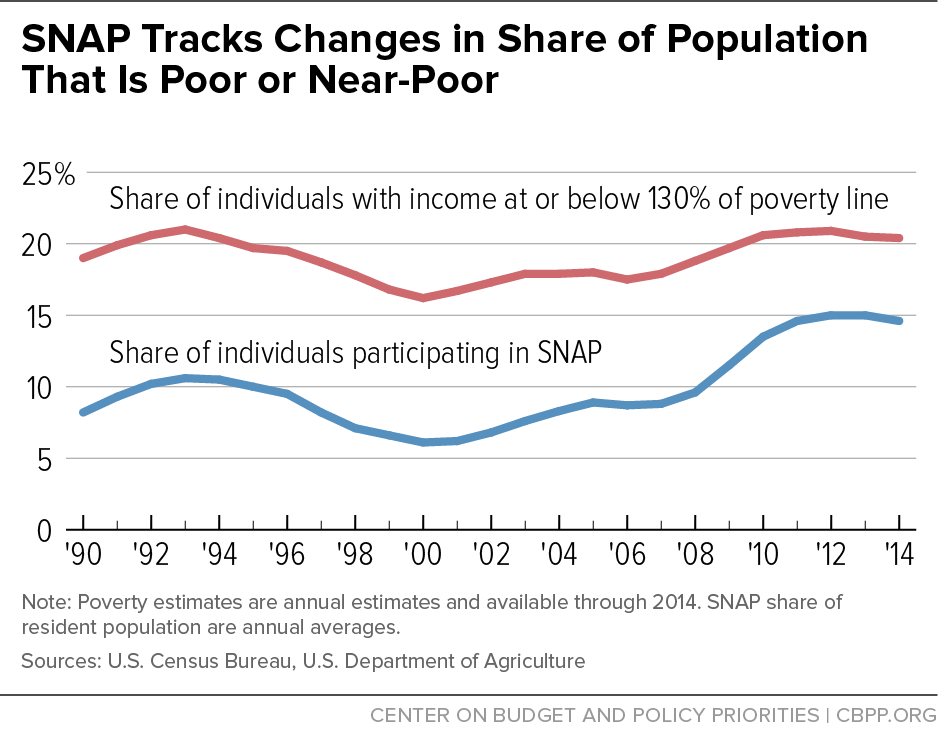
Doar argues that recent SNAP participation trends primarily reflect these two policy changes as well as states’ adoption of simplified reporting requirements — rather than economic conditions. He cites as evidence the fact that SNAP caseloads haven’t fallen nearly as much as the unemployment rate since the recession. But SNAP participation in recent years is consistent with trends in the share of Americans who are poor or near poor and therefore likely to qualify for SNAP. The poverty rate is a much better indication of need for SNAP than the unemployment rate. And the percentage of Americans who are either poor or near-poor remains well above pre-recession levels and has declined only modestly from its post-recession peak. (See Figure 2.)
The policy changes Doar cites account for 18 to 30 percent of the increase in SNAP enrollment during and after the recession, according to recent research.[4] Nevertheless, the fact that poverty hasn’t fallen significantly since the recession is the larger factor in explaining why SNAP participation has not come down as much as the unemployment rate.
Moreover, Doar fails to mention that the broader waivers from the three-month time limit are largely ending as the economy improves, with 1 million low-income childless adults slated to be terminated from SNAP in 2016 as waivers in their areas expire.[5] He also glosses over the fact that the Department of Agriculture (USDA) and states adopted categorical eligibility and simplified reporting requirements to help SNAP reach more low-income working families.
Doar also inappropriately cherry picks data to support his argument:
- He calls SNAP’s current caseload of roughly 45.5 million people “unexpected,” citing CBO’s 2010 forecast that participation would drop to 39.6 million by 2015. Since 2012, however, CBO has predicted a caseload in 2015 of about 46 million. With the actual 2015 figure likely to be about 45.8 million, SNAP has now declined almost exactly as CBO has predicted since 2012. Moreover, CBO’s 2010 forecast assumed, as most experts expected at the time, that the economy would rebound more quickly from the Great Recession, similarly to the “V-shaped” recovery from the deep 1981-82 recession, with high labor force participation and low unemployment in 2015. The economic recovery has proved much slower than those predictions.
- He cites research from James Ziliak, a leading SNAP researcher at the University of Kentucky, finding that the downturn only explains part of SNAP’s increase. But in 2015 congressional testimony, Dr. Ziliak wrote that “the weak U.S. economy was the main reason the number of Americans on SNAP grew since 2000” and that SNAP participation and cost will automatically decline as the economy improves.[6]
SNAP Is Targeted to the Poor
In 2013, 92 percent of SNAP benefits went to households with incomes below the poverty line in the months they were receiving SNAP.
Doar, noting that roughly 40 percent of SNAP recipients have annual incomes over 130 percent of poverty, charges that SNAP “is not . . . maintaining its focus on the poor.” That, however, is not a logical conclusion: the fact that some people have incomes above 130 percent of poverty for the year as a whole, yet receive SNAP for part of the year when their incomes are much lower, indicates that SNAP is working as intended. Some people lose their job during the year and turn to SNAP for the months when they have less income. Others receive SNAP at the beginning of the year while out of work but then find a job, no longer need help, and leave the program.[7]
Only about 5 percent of SNAP households in 2013 had gross income over 130 percent of poverty in the months while receiving SNAP, and they include households with elderly or disabled members, who are not subject to SNAP’s income limit of 130 percent of poverty.
The broad-based categorical eligibility option, which Doar sharply criticizes and recommends eliminating, does not lead to substantial SNAP benefits going to non-needy families. Under this option, which allows states to provide SNAP benefits to families with gross incomes modestly above the SNAP limit but high rent and/or child care expenses that leave less money for food, only about 2 percent of SNAP households had monthly disposable income (i.e., net income after deductions) above the poverty line while receiving SNAP in 2013, and those households received only about 0.2 percent of SNAP benefits.
Doar also criticizes SNAP for not promoting work sufficiently. But our analysis of Census data shows that 98 percent of the non-elderly, non-disabled households Doar identifies as having annual income above 130 percent of poverty included a worker.[8] As a result, ending broad-based categorical eligibility would overwhelmingly hurt working households, which seems inconsistent with Doar’s call for SNAP to do more to promote work.
SNAP Supports Work
Work rates are high among SNAP households that can work. More than 80 percent of SNAP households with at least one working-age, non-disabled adult work in the year before or after receiving SNAP, Census data show.[9]
Doar writes that “increasingly [SNAP] recipients who could be working are not,” claiming that the share of recipients who aren’t elderly or disabled who work has dropped by almost 13 percentage points since 2000. But that figure is marred by inaccuracy and selective presentation of data.
- First, the 13 percent figure is incorrect. The share of adult recipients who aren’t elderly or disabled who are working while receiving SNAP dropped by six percentage points between 2000 and 2011, not 13, and then rose by two percentage points from 2011 to 2013.[10]
- Second, that modest decline between 2000 and 2013 reflects the fact that more unemployed childless individuals who are not elderly or disabled received SNAP in 2011 (and 2013) than in 2000 because of the extensive waivers granted during and after the Great Recession from the three-month time limit for this group.[11] As explained above, this increase is temporary: the more extensive waivers are now ending in most states, with large numbers of these unemployed individuals slated to be removed from the program in 2016.
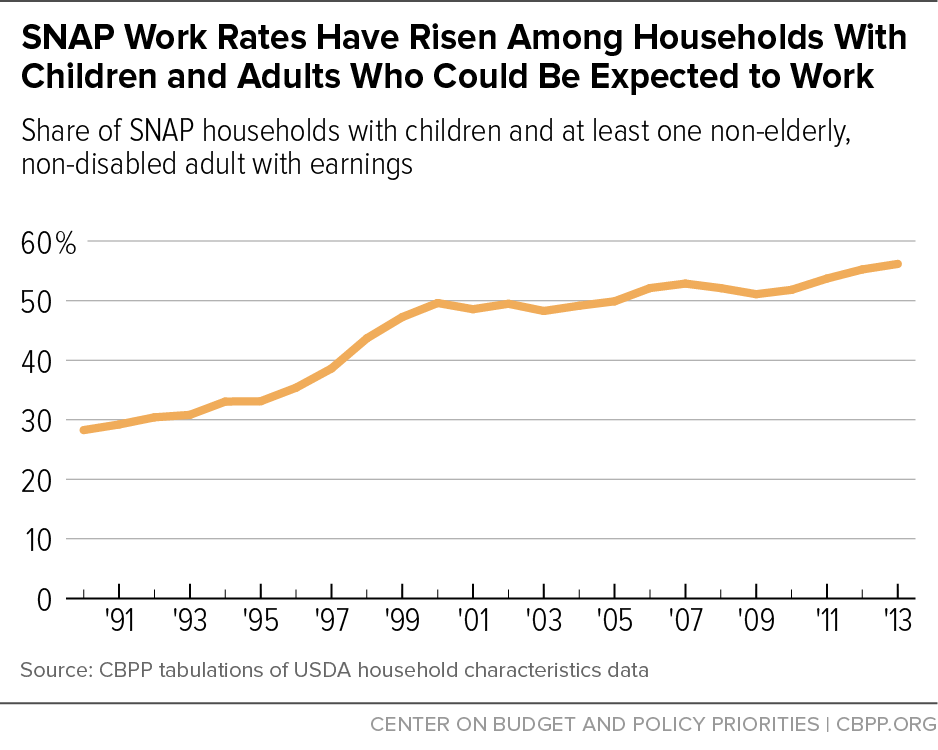
- Third, the share of households with a non-elderly, non-disabled adult that work while receiving SNAP (a measure less strongly affected by the waivers) did not decline between 2000 and 2013. And, the share of households with children with a non-elderly, non-disabled adult that work while receiving SNAP actually increased, climbing from 50 percent in 2000 to 56 percent in 2013. (See Figure 3.)
- The fact that the share of households with a non-elderly, non-disabled adult that had earnings while receiving SNAP did not decline during and after the deepest recession in decades ¾ despite the fact that 2000 was a year with one of the hottest labor markets and lowest unemployment rates in the last half century ¾ suggests that SNAP’s connection to work has strengthened rather than weakened. The fact that the share of households with children that had earnings while receiving SNAP rose significantly between 2000 and 2013 despite the much-weaker economy in 2013 buttresses the conclusion that SNAP’s connection to work has grown more robust.
- SNAP should serve more unemployed workers when jobs are scarce; that is one of its fundamental functions as a safety net program. But SNAP has also helped a growing number of working households to make ends meet despite low earnings. In fact, the number of households that have earnings while receiving SNAP has more than tripled since 2000, from about 2 million that year to more than 7 million in 2013. SNAP has become more effective as a work support.
To make his case about what he terms “SNAP’s fading work requirements,” Doar also cites the aforementioned waivers that most states received during the recession and slow recovery from SNAP’s austere three-month limit on benefits for unemployed childless adults. He doesn’t explain that, as noted, the broader waivers that states received during and after the recession will largely expire in 2016, eliminating SNAP benefits for roughly 1 million people, most of whom live far below the poverty line. Indeed, the incomes of these individuals while on SNAP average only about 19 percent of the poverty line.[12] The individuals who face the three-month cutoff are among the poorest of the poor.
Moreover, the three-month limit isn’t a true “work requirement,” because it denies basic food assistance to people who are looking for work and will accept any job or work program slot offered but can’t find jobs. Ending all such waivers irrespective of the condition of the local or state economy, as Doar favors, would deny food assistance to extremely poor people who live in the areas of the country with the worst unemployment, including some areas where unemployment remains at double-digit levels.
Simplified Reporting
Finally, Doar criticizes simplified reporting, a policy specifically designed to help working-poor families with fluctuating income maintain their SNAP benefits. Congress expanded and improved this state option, with bipartisan support, in the 2002 and 2008 farm bills. Simplified reporting allows states to provide six months of continuous SNAP eligibility at a constant benefit level so long as a household’s income does not rise above 130 percent of poverty. As a result, this option, which every state has adopted because it reduces administrative costs as well as paperwork burdens on both states and SNAP households, should not materially affect the number of households with gross income above 130 percent of poverty.
End Notes
[1] Robert Doar, “SNAP’s Fading Work Requirements,” American Enterprise Institute, September 8, 2015, https://www.aei.org/publication/snaps-fading-work-requirements/. For proposed SNAP cuts, see Dorothy Rosenbaum and Brynne Keith-Jennings, “House Budget Would Slash SNAP by $125 Billion Over Ten Years,” Center on Budget and Policy Priorities, March 20, 2015, https://www.cbpp.org/research/food-assistance/house-budget-would-slash-snap-by-125-billion-over-ten-years. For reimposition of the time limit, see Ed Bolen, “Approximately 1 Million Unemployed Childless Adults Will Lose SNAP Benefits in 2016 as State Waivers Expire,” Center on Budget and Policy Priorities, January 5, 2015, https://www.cbpp.org/research/food-assistance/approximately-1-million-unemployed-childless-adults-will-lose-snap-benefits.
[2] Congressional Budget Office, “The Supplemental Nutrition Assistance Program,” April 2012.
[3] Neither of these two changes resulted from recent legislation; both are state options from the 1996 welfare law. For more, see Dorothy Rosenbaum, Stacy Dean, and Robert Greenstein, “Cuts Contained in SNAP Bill Coming to the House Floor Would Affect Millions of Low-Income Americans,” Center on Budget and Policy Priorities, September 17, 2013, https://www.cbpp.org/research/cuts-contained-in-snap-bill-coming-to-the-house-floor-would-affect-millions-of-low-income.
[4] Peter Ganong and Jeffrey B. Liebman found that two policy changes accounted for less than one fifth of the participation increase between 2007 and 2011. (Increased adoption of broad-based categorical eligibility accounted for 8 percent of the increase, while the growth in temporary waivers accounted for another 10 percent.) James P. Ziliak found that changes in federal and state SNAP policy accounted for less than 30 percent of SNAP participation growth. See Peter Ganong and Jeffrey B. Liebman, “The Decline, Rebound, and Further Rise in SNAP Enrollment,” National Bureau of Economic Research, Working Paper 19363, August 2013, http://www.nber.org/papers/w19363.pdf?new_window and James P. Ziliak, “Understanding the Growth of SNAP,” testimony before the Subcommittee on Nutrition of the U.S. House Committee on Agriculture, February 26, 2015.
[5] Bolen, op. cit.
[6] Ziliak, op. cit.
[7] Doar uses the Public Use Microdata Sample (PUMS) from the Census Bureau’s American Community Survey for this analysis. For more detail on the methodological reasons that this survey may overstate SNAP receipt among higher income individuals, see Dottie Rosenbaum, “The False Claim That Higher-Income People Are Driving SNAP Costs, Part 2,” Center on Budget and Policy Priorities, November 21, 2012, https://www.cbpp.org/blog/the-false-claim-that-higher-income-people-are-driving-snap-costs-part-2.
[8] CBPP analysis of the Census Bureau’s American Community Survey for 2013. We found that 95 percent of these households included someone who worked at least half-time for at least half of the year, demonstrating significant attachment to the labor force. SNAP households with earnings tend to have higher incomes than those without earnings, as well as work-related costs such as child care and thus higher deductible expenses.
[9] Dottie Rosenbaum, “The Relationship Between SNAP and Work Among Low-Income Households,” Center on Budget and Policy Priorities, January 30, 2013, https://www.cbpp.org/research/the-relationship-between-snap-and-work-among-low-income-households.
[10] Doar provides no methodology for his figures and the only source he cites is “Characteristics of SNAP Recipients,” an annual USDA report. Doar’s chart is missing data for the 2003 through 2007 period and we were not able to reproduce his figures for 2000-2002 due to changes in USDA’s methodology. The figures we present here are based on CBPP analysis of the same public use data set that underlies the published USDA report he cites, but with consistent definitions applied throughout the 2000-2013 period. Our analysis shows that the share of such recipients who work while receiving SNAP declined from 37 percent to 31 percent between the very low unemployment year of 2000 and the high unemployment year of 2011, and then rose by two percentage points, to 33 percent, between 2011 and 2013 as the labor market began to recover. The share of households with a non-elderly/non-disabled adult that had earnings while receiving SAP edged up from 43 percent in 2000 to 44 percent in 2013.
[11] More areas received waivers in recent years because widespread high unemployment made more areas eligible for a waiver, not because of any change in federal waiver policy. The authority for temporary waivers for areas with insufficient jobs due to high unemployment originated in the 1996 welfare law at the time the Congress enacted the three-month time limit. The U.S. Department of Agriculture has approved states’ requests for waivers under a consistent and fixed set of rules and regulations for almost 20 years.
[12] Bolen, op. cit.
More from the Authors