How Tax Reform Can Raise Working-Class Incomes
Federal policies — including tax reform — should help those who need it most, including low- and modest-income working-class families that have been hard hit by the economic trends of recent decades. President Trump embraced this narrative as a candidate, saying: “These are the forgotten men and women of America. People who work hard but don’t have a voice. . . . Too many of our leaders have forgotten that it’s their duty to protect the jobs, wages and well-being of American workers before any other consideration.”[2]
In his inaugural address, President Trump stated “every decision” on taxes would “be made to benefit American workers and American families.” And his National Economic Council Director, Gary Cohn, said that the President’s tax plan will focus on “helping the low- and middle-income families who have been left behind by this economy.”[3] The tax plan President Trump released in April, however, betrays those promises.
Based on the scant details that the Administration provided, the tax cuts specified in its April plan would reduce federal revenues by $7.8 trillion over ten years, the Tax Policy Center (TPC) has estimated, with the revenue-raising provisions the Administration has specified offsetting only a fraction of that cost. The tax cuts would flow largely to the wealthy and to profitable corporations. Households with incomes above $1 million would receive annual tax cuts averaging more than $400,000 apiece,[4] while most working-class families would receive little or no benefit.[5] At least 17 million working families and individuals, including at least 12 million in the working class — a racially, ethnically, and geographically diverse group that we define as families with working-age adults in which no one has a college degree — would be excluded from any tax benefit, and some may even face tax increases.[6] In fact, the working class would likely be worse off in the end because policymakers eventually would likely pay for the large tax cuts for the wealthy, at least in part, by cutting programs on which working-class households rely.
Trump’s tax plan does so little for the working class in large part because it ignores the parts of the tax code that are best designed to support that group.Trump’s tax plan does so little for the working class in large part because it ignores the parts of the tax code that are best designed to support that group: refundable tax credits like the Earned Income Tax Credit (EITC) and Child Tax Credit (CTC). The EITC and CTC, which have long enjoyed bipartisan support, are pro-work success stories that currently deliver an average of $2,700 to 25 million working-class families and individuals. Together, they reach roughly three-quarters of working-class families with children. But they could do more. The EITC, for instance, provides a much smaller credit for “childless workers” and non-custodial adults, even though they currently face many of the same challenges in today’s economy as workers in households with children. And the CTC excludes the poorest families, including those with young children, which receive either no credit at all or only a small, partial credit.
For substantially less than the cost of the Trump tax plan, tax reform could deliver meaningful help to the working class by closing these gaps in the EITC and CTC — or more ambitious expansions. For example, a major EITC expansion proposed by Representative Ro Khanna and Senator Sherrod Brown would fix the flaw for workers not raising children and then roughly double the maximum EITC amount for all groups.[7] That would be a well-targeted way to help working-class households, increasing the number of working-class EITC recipients by roughly 15 million families and individuals and boosting working-class incomes much more than the Trump plan. Overall, roughly 47 million families and individuals — including more than 35 million in the working class — would receive a tax benefit averaging $2,800 from the EITC expansion.[8] And, particularly for lower-income working-class households, such an expansion would help narrow the widening gap between their income and that of households with more education. A married couple with one child that earns $31,300 would, for example, receive an EITC boost of just over $3,100.
Similarly, on the Child Tax Credit side, Rep. Rosa DeLauro and Senators Sherrod Brown and Michael Bennet have introduced proposals to increase the refundability of the Child Tax Credit and to increase its size for young children. These proposals would have large poverty-reducing effects. For example, the DeLauro proposal — which would phase in the credit at a 45 percent rate from the first dollar of earnings and increase the maximum credit to $3,600 for young children under age 6 — would lift 11 million people, including 6 million children, above or closer to the poverty line.
Such EITC and CTC expansions could provide other economic benefits as well. Strengthening the EITC would encourage work, especially among less-educated young adults who aren’t raising children — a group whose labor-force participation has fallen in recent years. Moreover, substantial research suggests that the EITC, CTC, and other income supports for families improve the health and educational outcomes of children in families that receive it and even increase children’s earnings as adults, helping to push against the harsh economic headwinds that these future generations may face.
The EITC and CTC expansions above would be expensive, but their cost pales in comparison to the tax cuts that the President’s plan would shower on the wealthy. And unlike the President’s massive high-income tax cuts, policymakers could realistically pay for the EITC and CTC expansions by closing loopholes and broadening the tax base, while also raising additional revenue to meet other national needs.
Strengthening the EITC and CTC presents a clear, plausible way to boost working-class incomes through tax reform, something that the Trump tax plan fails to accomplish. Without significant revisions, the Trump plan represents a false promise for the working class and a massive giveaway to the most well-off. Despite the President’s repeated pronouncements during the campaign that the working class has too long been forgotten, his tax plan ignores those people.
Working Class Has Struggled Economically in Recent Decades
Like many others, we define the “working class” as adults aged 18 to 64 (excluding students) who live in families in which no one has a bachelor’s degree.[9] (For further discussion, see Appendix A.) Working-class families, which have struggled economically in recent decades, are predominately low and middle income.[10] Their median incomes are more than 20 percent below the national median. About 19 percent of working-class adults have incomes below the federal poverty line, 69 percent have incomes below 250 percent of the poverty line, and 84 percent have incomes below 350 percent of the poverty line (compared with 6, 35, and 56 percent of adults, respectively, in more educated households).
| TABLE 1 | |||
|---|---|---|---|
| Top Occupations Among Workers in Working-Class Households | |||
| Median annual wage | Working-class workers (millions) | Working-class share of workers in occupation | |
| Office and administrative support | $34,050 | 9.9 | 55% |
| Sales | $26,590 | 7.1 | 45% |
| Transportation and warehousing | $30,730 | 6.7 | 70% |
| Manufacturing | $33,130 | 6.4 | 73% |
| Construction & oil, gas, and mining | $43,610 | 6.0 | 75% |
The common occupations among working-class households pay modest wages. (See Table 1.) For example, manufacturing jobs, often the focus of public debate about the working class, now provide a median annual income of about $33,000. The most common set of occupations for working-class individuals, which are office and administrative support jobs, provide a similar median annual income.
To support the working class meaningfully, tax reform thus must be sure to target assistance to low- and moderate-income households.
Working-class families have enjoyed only small income gains in recent decades, after accounting for taxes and government transfer payments and adjusting for inflation. Real working-class median income rose by only about 3 percent from 1979, the earliest year for which comparable data are available, to 2015.
Though much recent commentary about the 2016 election has focused on the “white working class,” the working class is diverse. Working-class households of different races and ethnicities have secured only modest gains over the 1979-2015 period. (See Figure 1.) (For more detail, see Appendix Table 1.)
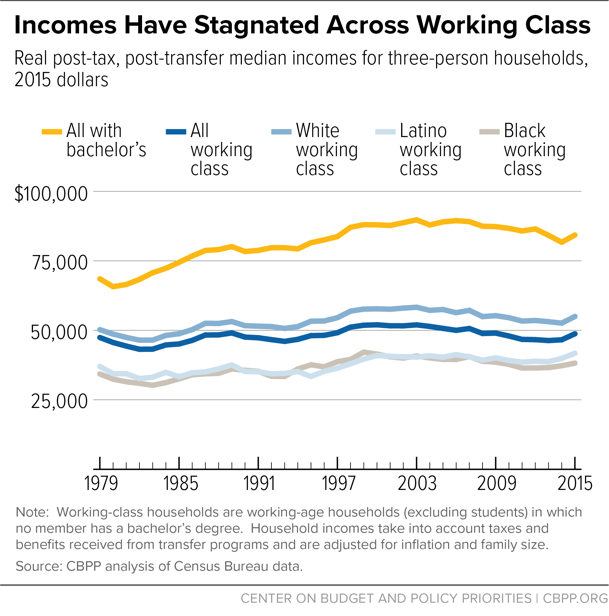
While working-class incomes have largely stagnated over the past three decades, households with more education have enjoyed more income growth, thus widening the income gap based on education. The median real income among households with a college degree has risen by 23 percent since 1979 and, in 2015, was 73 percent higher than median income among working-class households. In 1979, the median income of more educated households was 45 percent greater than the median income of working-class households.[11]
Slower working-class income growth has created a substantial gap between their current income and what it would be if it had grown at the same rate as the income of more educated households. For example, the median working-class couple with one child — that is, at the midway point (or 50th percentile) of such households — now earns about $48,700. If their income had grown at the same rate as that of similar households with a bachelor’s degree since 1979, their income would have been roughly $9,600 higher in 2015.
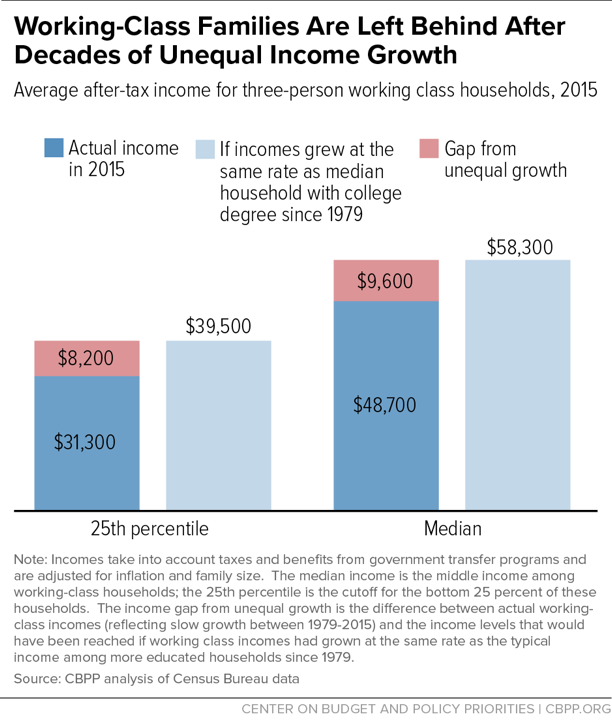
Similarly, the income of a three-person working-class household at the 25th percentile for such households is now $31,300, which is slightly below its 1979 level in real terms and $8,200 below what it would be if it had grown at the median rate for similar households with a bachelor’s degree. (See Figure 2.)
EITC and CTC Are Crucial to the Working Class
The EITC and CTC boost working-class incomes, partially mitigating these harsh income trends. Both tax credits are well-targeted to working-class families with children. A household’s EITC amount depends on its income and earnings, marital status, and number of children; families with children and incomes up to $39,600 to $53,900 in 2017 are eligible, depending on these factors. And the credit is “refundable,” meaning that if the credit amount exceeds a low-wage worker’s federal income tax liability, the government provides the balance as a tax refund. (While many such tax filers do not earn enough to owe federal income tax, they pay federal payroll and excise taxes as well as state and local sales, property, and other taxes.)[12]
Similarly, the CTC supports the working class by providing up to $1,000 for each dependent child under age 17 to help families offset some child-rearing costs. Unlike the EITC, the CTC is available to middle-income and most upper-middle-income families as well, because it phases out at considerably higher income levels than the EITC. While it’s partially refundable, it isn’t available — or is available only in limited, partial form — to many working-poor families.
More than three-quarters of working-class families with children receive either the EITC and CTC or both in a given year, with the combined tax credits averaging more than $3,000 among these families. Together, the EITC and CTC lift roughly 4 million working-class adults, and over 4 million children in their families, out of poverty.[13]
Moreover, the EITC and CTC encourage work. Substantial research over the past two decades shows that the EITC significantly increases beneficiaries’ work effort and is particularly effective at encouraging work among single mothers who are paid low wages. In addition, research indicates that the increased work effort and earnings extend into the next generation. Children whose families receive more income from the EITC and CTC do better in school, on average, are likelier to attend college, and will likely earn more as adults; they’re also likelier to avoid the early onset of disabilities and other illnesses associated with child poverty, which further enhances their earnings ability as adults. The EITC and CTC not only support the working class in the near term, but may also help to push against harsh economic trends and boost work for future generations.[14]
Nevertheless, the EITC and CTC both have glaring gaps that exclude many working-class households from eligibility. Working “childless” adults, including non-custodial parents, are largely excluded from the EITC even though, like workers with children, they also face labor-market challenges. Those eligible “childless” adults who qualify receive an average EITC of about $300 (about one-tenth of the average for families with children), and childless workers who are younger than 25 or have incomes above $15,010 ($20,600 for couples) aren’t eligible at all. Less than 10 percent of working-class households without children receive the EITC, versus nearly two-thirds of working-class households with children. Largely as a result, working childless adults are the lone group that the federal tax code actually taxes into, or deeper into, poverty.[15]
The CTC, meanwhile, excludes many very low-income families from receiving all or part of the credit.[16] To determine the CTC’s value, the would-be recipient excludes the first $3,000 of earnings, and the credit phases in at a rate of 15 cents per dollar of earnings above the $3,000 threshold until it reaches the full credit amount of $1,000 per child. As a result, working families with little earnings get no credit, and many more receive only a fraction of the full $1,000 per-child credit amount. A family with two children, for example, must earn more than $16,300 to receive the full credit.
That’s likely particularly harmful for children under age 6, who have higher poverty rates than older children or adults. Research suggests that the first six years of life are a crucial window of development and that the poorest children are especially vulnerable to poverty-related “toxic stress,” which can inhibit their brain development. Yet, more than 4 million children under age 6 live in families with at least one working parent who earns too little to qualify for the full credit and, in some cases, too little to qualify for any credit.[17]
Trump Tax Plan Fails the Working Class
The Trump tax plan issued in April fails the working class for two critical reasons. First, based on the information on its plan the Administration has provided, the tax cuts in its plan would reduce revenues by $7.8 trillion over ten years, with the biggest tax cuts going to wealthy households and profitable corporations, TPC estimates.[18] Millionaires would receive annual tax cuts from these provisions averaging more than $400,000 apiece.[19] (The Administration has specified only a few potential offsets for these tax cuts, which could modestly reduce their cost and the tax cuts millionaires would receive.)[20] These tax cuts would ultimately come at the expense of the working class because they would create additional fiscal pressure for spending cuts to programs on which many working-class families rely.
Second, the plan would provide limited help to working-class families and leave millions of them out. That’s largely because in making changes to individual income taxes, the Trump plan focuses on significant rate cuts for individuals while doing nothing to expand the EITC, CTC, or other refundable credits.[21] Very few working-class households have enough income to place them in upper tax brackets, on which the plan’s largest rate cuts are targeted. More than five-sixths of working-class households face marginal tax rates of 15 percent or less, so they would likely receive only small benefits from the plan’s rate cuts. In addition, about one-third of working-class households had no federal income tax liability in 2015 (though most paid significant payroll taxes as well as state and local taxes).[22]
Such households wouldn’t benefit from tax-rate cuts. Nor would they benefit from other provisions in the plan — including raising the standard deduction, which the Administration touts as its main feature for working families.[23] Indeed, even under the most generous reading of the plan, it would leave out at least 17 million working families and individuals, including at least 12 million in the working class.[24]
All told, the rate cuts and other costly proposals overwhelmingly benefit the affluent.[25] TPC estimates that the tax cuts in President Trump’s plan would provide dramatic increases in the after-tax incomes of the wealthiest — a 19 percent average increase in after-tax income for millionaires, with the tax cuts they would get averaging more than $400,000 per millionaire household in 2018 — while boosting the incomes of lower- and middle-income households by about 3 percent or less.[26] Households with incomes less than $50,000, which include half all households (and the majority of working-class households), would receive tax cuts of just $400 on average in 2018 under the Trump plan.[27]
If, through tax reform, the President truly wants to help those whom the economy has most left behind, there is a clear path to do so: revenue-raising tax reform that expands the EITC and CTC, as described below.
How Tax Reform Can Help the Working Class
We need a federal tax system that provides adequate revenues to meet the needs of an aging population and ensures that the nation is on a sustainable fiscal course. As a result, any tax reform should increase overall revenues. At an absolute minimum, tax reform should be revenue-neutral — that is, it should not reduce overall federal revenues below those projected under current law. (See box.)
A tax reform that loses revenue will create additional budget pressure for spending cuts, especially in safety net programs, which provide crucial benefits to working-class people,[28] and in non-defense discretionary programs including areas like education, job training, research, and infrastructure, where sound investments can boost long-term economic growth.
Tax Reform Should Raise Revenues — And Certainly Not Lose Them
The federal government needs adequate revenues to finance critical national needs and avoid spiraling debt burdens. The long-term federal fiscal outlook has improved substantially in recent years, but policymakers still will need to take further steps to reduce projected deficits and debt. Without a change in policies, we estimate that the ratio of debt to gross domestic product (GDP) — 77 percent at the end of 2016 — will gradually grow to 102 percent by 2036 and 113 percent by 2046. Policymakers will also need additional revenues to finance new investments in key areas.
Several factors will place upward pressure on federal spending in coming years: first, Social Security, Medicare, and Medicaid will cost more as the population ages and more Americans are eligible for these programs. In addition, costs will continue to rise throughout the U.S. health care system, in both the public and private sectors, which will increase the costs of Medicare and Medicaid still more.
Recent deficit-reduction efforts have focused their cuts disproportionately on discretionary spending, including non-defense discretionary spending — the budget category that, as noted in this paper, funds research, education, job training, and other critical investments that can spur long-term economic growth and raise living standards. In the coming years, we will need to increase funding for this area to avoid shortchanging important investments and government services.
Further, we will need resources to address critical unmet needs, such as infrastructure, and to finance new initiatives that the federal government may undertake, including, for instance, proposals to make college more accessible and affordable.
To address these budget pressures, tax reform should aim to increase revenues. Otherwise, the entire burden of reducing deficits and debt to sustainable levels will fall on federal programs. Policymakers should not cut programs for low- and moderate-income households, on which many working-class people rely, to pay for tax cuts primarily for those at the top. If policymakers do not raise revenues, they also likely won’t be able to afford to invest significantly more in infrastructure, education, and other such areas.
While raising revenue is the preferred approach for tax reform, at the very least it should not lose revenues either over the first decade or in subsequent decades. A tax package that loses significant revenues will increase pressures to cut programs that support working-class households, likely leaving them worse off over the long term.
For more, see: “Tax Reform Should Raise Revenues — And Certainly Should Not Lose Them,” Center on Budget and Policy Priorities, April 26, 2017, https://www.cbpp.org/research/federal-tax/tax-reform-should-raise-revenues-and-certainly-should-not-lose-them.
Within those revenue parameters, a top tax reform priority should be raising working-class incomes. Tax reform can do so meaningfully if policymakers raise additional revenues and target them to low- and moderate-income workers through refundable tax credits like the EITC and CTC, as described below.
A Key Initial Step: Close Gaps in the EITC and CTC
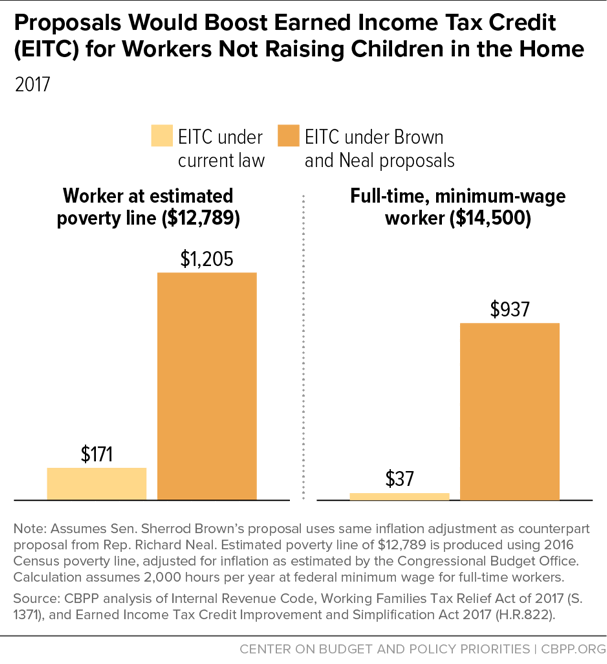
Policymakers should start by fixing two glaring gaps in the EITC and CTC. First, they should expand the EITC for working childless adults and non-custodial parents and ensure that the federal tax code doesn’t tax them into — or deeper into — poverty. Senate Finance Committee Democrat Sherrod Brown and the House Ways and Means Committee’s ranking Democrat, Richard Neal, have introduced legislation that would achieve that goal by boosting the maximum EITC to $1,400 for workers not raising children in the home and lowering the eligibility age to 21.[29] The proposal would boost the incomes of 15 million childless households, including 12 million working-class households, which would receive an average $600 boost. Currently, a single person working full time at the federal minimum wage earns around $14,500 a year and is eligible for a credit of just $37. Under this proposal, such a worker’s EITC would rise by $900. (See Figure 3.) More broadly, the proposal would lift roughly 600,000 people out of poverty and lessen the severity of poverty for an additional 8.7 million.
Fixing this EITC gap would encourage work among young adults without a college degree who aren’t raising children, a group whose labor-force participation has fallen in recent years. Some leading experts believe that an expanded EITC for these workers would also help address some of the other challenges that young people with no postsecondary education face, including low marriage rates and high incarceration rates, by raising their employment rates.[30]
As noted, the CTC also fully or partially excludes the poorest families even though research indicates that the credit would have the largest beneficial impact on poor children. Ultimately, the CTC should be accessible to all low-income children. That means it should be fully refundable so that all poor children can qualify and receive it. Policymakers should use every opportunity to start filling this gap.
Policymakers could start by strengthening the CTC for families with children under age 6 by phasing it in starting with the first dollar of earnings, rather than the $3,001st dollar of earnings, and at a rate of 45 cents per dollar of earnings (compared to 15 cents per dollar under current law). That would provide a substantial boost to many very poor families: about 1.9 million working-class families with 5.1 million children would receive a boost averaging $1,000. For example, a single mother with two children earning $7,500 would see her CTC rise from the current $675 to the full $2,000 ($1,000 per child for each of her two children). Such a CTC expansion would lift 400,000 people, including roughly 300,000 children, out of poverty and lessen the severity of poverty for another 4.3 million people, including 2.5 million children.
The cost of addressing these two shortcomings would be relatively modest compared to various other tax proposals — roughly $120 billion over ten years.
Larger EITC and CTC Expansions Could Further Mitigate Working-Class Households’ Economic Pressures
While crucial, the EITC and CTC expansions just described would not close much of the growing income gap of recent decades between working-class households and more educated households. To do that, policymakers could supplement these reforms with additional EITC and CTC expansions that they could finance by scaling back various tax breaks that primarily or exclusively benefit high-income households. Policymakers can scale EITC and CTC expansions up or down based on the revenue-raising measures available to finance them.
In an important column in December 2016, New York Times economic correspondent Neil Irwin outlined a potential major EITC expansion for working-class households.[31] House Budget Committee Democrat Ro Khanna and Senator Brown recently introduced legislation that contains an expansion along the lines that Irwin outlined. The legislation would close the gap in the EITC for childless workers similar to the Brown-Neal expansion described above, and then roughly double the maximum EITC across households, similar to the expansion that Irwin highlighted.[32] This major EITC expansion would provide a significant boost to the more than 20 million working-class families and individuals who now receive the EITC and extend it another 15 million working-class families and individuals, including those not raising children.
For a working-class couple with one child and median earnings — about $48,700 in 2015 — this EITC expansion would provide an increase of nearly $2,600 in its take-home pay in 2017. That increase would offset over one-fourth of the lower earnings that this family has experienced since 1979, relative to the earnings of comparable families with bachelor’s degrees. For working-class families with children with lower incomes, the boost would be still larger. A married couple with one child earning $31,300 (around the 25th percentile for a working-class family of that size) would receive an EITC boost of just over $3,100. That would offset nearly 40 percent of the loss in income growth for this family relative to a typical family with a bachelor’s degree (see Table 2).
Workers who aren’t raising children and currently receive little or no EITC would receive a significant boost as well. A single childless worker who is working full time at the minimum wage would become eligible for an EITC of $3,000, compared to less than $40 under current law and $940 under the Brown-Neal proposal. A married couple in which both spouses work full time at the minimum wage (and where the children are grown up) would become eligible for an EITC of $2,190.
| TABLE 2 | ||||
|---|---|---|---|---|
| EITC Expansion Would Help Narrow Gaps in Income Growth Between Working Class and More Educated Households | ||||
| Single “childless” worker | Three-person family | |||
| 25th percentile | Median | 25th percentile | Median | |
| Real income, 1979 | $18,600 | $27,400 | $32,100 | $47,400 |
| Real income, 2015 | $18,100 | $28,100 | $31,300 | $48,700 |
| 2015 income if had grown at same rate as for median household with BA | $22,800 | $33,700 | $39,600 | $58,300 |
| Difference (“gap”) | $4,800 | $5,500 | $8,200 | $9,600 |
| Additional EITC under expansion | $3,000 | $1,440 | $3,130 | $2,560 |
| Share of gap filled | 63% | 26% | 38% | 27% |
Overall, this EITC expansion would cost about $1.4 trillion over ten years.[33] It would benefit millions of families across a variety of demographic groups and occupations (see Tables 3 and 4).[34]
| TABLE 3 | ||||||
|---|---|---|---|---|---|---|
| Racial and Ethnic Breakdown of the EITC for Working-Class Families | ||||||
| White | Black | Asian | Hispanic | Other | Total | |
| Working-Class Families With Children | ||||||
| Total families in millions | 12.0 | 4.0 | 0.9 | 7.5 | 0.7 | 25.2 |
| Share receiving the EITC under current law | 60% | 85% | 62% | 57% | 75% | 64% |
| Share receiving the EITC under expansion | 77% | 91% | 79% | 65% | 85% | 76% |
| Working-Class Families Without Children | ||||||
| Total families in millions | 33.7 | 9.8 | 1.7 | 11.5 | 1.7 | 58.4 |
| Share receiving the EITC under current law | 8% | 11% | 8% | 8% | 9% | 8% |
| Share receiving the EITC under expansion | 27% | 31% | 29% | 27% | 30% | 28% |
| TABLE 4 | |
|---|---|
| Top Occupations of Working-Class EITC Expansion Beneficiaries | |
| Filers benefiting (millions) | |
| Office and administrative support (e.g., office clerks, customer service representatives, secretaries and administrative assistants) | 5.5 |
| Sales (e.g., retail salespersons, cashiers, sales representatives) | 4.0 |
| Transportation and warehousing (e.g., movers, truck drivers) | 3.6 |
| Manufacturing (e.g., assemblers, inspectors, testers, sorters, samplers, and weighers) | 3.3 |
| Food preparation and serving (e.g., fast food workers, waiters and waitresses, cooks) | 3.1 |
| Construction & oil, gas, and mining workers (e.g., construction workers, carpenters, electricians) | 2.6 |
| Building and grounds cleaning and maintenance (e.g., janitors, housekeepers, groundskeepers) | 2.3 |
| Personal care and service (e.g., personal care aides, child care workers, hairdressers) | 1.9 |
| Health care (e.g., nursing assistants, home health aides, medical assistants) | 1.6 |
Further Strengthening the Child Tax Credit
Policymakers also could further strengthen the CTC beyond the modest increase outlined above. In particular, they could make the CTC fully refundable so that all low-income children can qualify, including those of working-class families that have fallen into desperate times and have no earnings in a given year. Several policymakers have introduced legislation that would take steps in that direction by strengthening the CTC for very poor young children. Rep. Rosa DeLauro as well as Senator Brown and fellow Finance Committee Democrat Michael Bennet have authored proposals to increase the maximum CTC for younger children and begin phasing it in with first dollar of earnings and at a faster rate.[35] In addition, Senate Democrats Tammy Baldwin and Cory Booker have introduced broad anti-poverty legislation that would extend the CTC to more very poor children by eliminating the credit’s $3,000 earnings threshold, allowing the credit to phase in with the first dollar of earnings.[36] These proposals also include measures that would enlarge the CTC for most children who qualify for it (rather than just low-income children).[37]

The cost of these various proposed EITC and CTC expansions is substantial. As noted, policymakers should only consider them to the extent that they propose sufficient offsetting tax increases to pay for them. But, unlike offsetting the much larger cost of the tax cuts in the Trump tax plan, policymakers can feasibly pay for these expansions by closing tax breaks and limiting various tax deductions, credits, and other tax preferences of low priority or limited effectiveness.[38] President Obama’s fiscal year 2017 budget would have raised more than $2 trillion over ten years in net revenues from high-income households and profitable corporations by following that approach.[39] Even President Trump has said that base-broadening changes should help finance tax reforms, although he has largely declined at this point to propose specific base-broadening measures.
It’s worth noting that the EITC expansion proposals outlined here would cost roughly half as much as the tax cuts that the Trump tax plan rolled out in April would provide to millionaires alone, and would give significantly more support to households across the lower end of the income distribution, especially working-class households. (See Figure 4.) Working-class households earning between $30,000 and $40,000, for example, would receive more than twice as big a tax cut on average under these proposals than under the Trump tax plan.
With sufficient revenues to finance them, the EITC and CTC expansions would be worthwhile investments. They would largely target working-class households, significantly boosting their after-tax incomes and narrowing the growing income gap between working-class households and more educated households. Such expansions also would encourage and reward work, and research suggests that they could help improve children’s health and educational outcomes, as well as boost their future earnings.
If the President truly wants to use tax reform to help those most left behind in the economy, there is a clear path to do so: revenue-raising tax reform that includes well-designed expansions of the EITC and CTC. If left unchanged, however, his tax plan will fail to meet these standards, and it likely would ultimately harm the working class even as it provides lavish tax cuts to those at the top.
Appendix A: Income Trends for the Working Class
For the purpose of this paper, we define the “working class” as adults aged 18 to 64 (excluding students) who live in families where no one has a bachelor’s degree. Notes on methodology:
Education. Those without a bachelor’s degree might not have graduated from high school, might have completed high school but not gotten more education, or might have some college experience, such as at a community college, but not have received a four-year bachelor’s degree. This is one definition for the working class that some analysts use, though others may use other reasonable definitions for this group. For comparison, we refer to adults aged 18 to 64 who do have a bachelor’s degree or live in a family with someone else who has a bachelor’s degree as “adults with a college degree.”
Income measure. This analysis uses data from Census Bureau that include the impact both of taxes and of benefits received from transfer programs. Income is measured at the household level and is adjusted for inflation over time. A key advantage of Census data is that they allow analysis by education level and income.
Family-size adjustment. Employing a standard method used by the Congressional Budget Office (CBO) and other analysts, we adjusted for family size. Specifically, we ranked families in the income distribution by their income divided by the square root of family size, which accounts for demographic changes in average family size over the time period. (We use the term “family” to refer to all individuals that live in the same household.)
Time period. We examine the period from 1979 (the earliest year that comparable post-tax-and-transfer Census data are available for this analysis) to 2015 (the latest year for which such data are available). Note that 1979 was a peak year in the business cycle, while 2015 was not; an analysis of income growth over similar points in the business cycle might find slightly larger income gains.
Race/ethnicity. We use the terms “white,” “black,” “other race,” and “Hispanic” as shorthand to indicate individuals describing themselves as “non-Hispanic whites,” “non-Hispanic blacks,” and “non-Hispanics from another racial group or more than one race.” We use “black” and “African American” interchangeably, and use “Hispanic” interchangeably with “Latino.” Note that the percentage increase in median income for working-class households overall is lower than the percentage change for individual demographic groups because the share of the population that is from lower-earning demographic groups increased over this period.
| APPENDIX TABLE 1 | ||||||
|---|---|---|---|---|---|---|
| Real Median Household Income for Three-Person Working-Class Households | ||||||
| Working Class (No One in Family Has a Bachelor’s Degree) | At Least One Person Has a Bachelor’s Degree | |||||
| White | Black | Hispanic | Other | Total | ||
| 1979 | $50,200 | $34,300 | $37,000 | $40,500 | $47,400 | $68,500 |
| 2015 | $55,000 | $38,100 | $41,800 | $46,600 | $48,700 | $84,200 |
| Percent change | 9% | 11% | 13% | 15% | 3% | 23% |
Alternate measures of income trends
- The increase in inequality over recent decades is well established under a variety of measures.[40] CBO has time-series data across the income distribution that show slowing income gains for groups in the lower part of the income distribution over time.[41] CBO’s income series is highly regarded because it combines Census data for the bottom of the income distribution with income-tax data that provide more granularity at the top. However, CBO does not provide income data by education level. Census data are not as strong at the top due to “top-coding,” but this analysis doesn’t focus on the top of the income distribution. There are other smaller distinctions between the CBO and Census time series — for example, CBO also includes the value of health insurance as income, while Census data do not. Including the value of health insurance in this analysis would likely show bigger income gains for working-class households because health care costs — and the value of health insurance — have grown substantially in recent decades.
- The share of Americans with bachelor’s degrees was rising during this period, so another way to look at the economic trends among people with less education is to ask what happened to the least-educated two-thirds of working-age adults. (The least-educated two-thirds of working-age adults in 2015 refers to those without a four-year college degree, which includes adults with some education after high school but no more than an associate’s degree. In 1979, by contrast, the bottom two-thirds referred to those with no education at all after high school.) Their median household income rose a modest 10 percent from 1979 to 2015, adjusted for inflation.
End Notes
[1] Arloc Sherman, Vincent Palacios, Cecile Murray, and Chloe Cho provided valuable data assistance through the development of this paper.
[2] Tessa Berenson, “Read Donald Trump’s Speech on Jobs and the Economy,” Time, September 15, 2016, http://time.com/4495507/donald-trump-economy-speech-transcript/.
[3] Donald Trump, “The Inaugural Address,” The White House, January 20, 2017, https://www.whitehouse.gov/inaugural-address. Office of the Press Secretary, “Briefing by Secretary of the Treasury Steven Mnuchin and Director of the National Economic Council Gary Cohn,” The White House, April 26, 2017, https://www.whitehouse.gov/the-press-office/2017/04/26/briefing-secretary-treasury-steven-mnuchin-and-director-national.
[4] Estimate before accounting for any revenue-raising provisions. Tax Policy Center table T17-0189.
[5] President Trump’s campaign tax plan, which was similar to his plan released in April, as well as the House Republican “Better Way” tax blueprint, also would lose trillions of dollars in federal revenues and primarily benefit the wealthy.
[6] Chuck Marr, “Commentary: New Trump Tax Plan Has Specific Costly Tax Cuts at the Top, Fuzzy Promises for Everyone Else,” Center on Budget and Policy Priorities, April 27, 2017, https://www.cbpp.org/federal-tax/commentary-new-trump-tax-plan-has-specific-costly-tax-cuts-at-the-top-fuzzy-promises-for.
[7] Casey Tolan, “Progressive Democrats’ counter-argument to Trump tax plan: $1.4 trillion tax credit for the working class,” The Mercury News, September 12, 2017, http://www.mercurynews.com/2017/09/12/ro-khanna-sherrod-brown-tax-eitc-earned-income-donald-trump/.
[8] Total number of filers benefiting and average benefit calculated from TPC table T17-0201. The share of beneficiaries in the working class is estimated from March 2016 Current Population Survey data.
[9] The Brookings Institution, for example, uses a similar definition. See Cecile Murray and Elizabeth Kneebone, “The Earned Income Tax Credit and the white working class,” April 18, 2017, https://www.brookings.edu/blog/the-avenue/2017/04/18/the-earned-income-tax-credit-and-the-white-working-class/
[10] In our analysis of working-class income trends, we use the term “family” to refer to all individuals that live in the same household, with educational attainment and income measured at the household level. In our analysis of working-class EITC and CTC recipients, we use the term “family” to refer to all individuals in the same tax unit, with educational attainment and tax benefits measured at the tax-unit level.
[11] These data also include people and households without earnings, which means the data reflect the decline in labor-force participation, particularly among men, in recent years. For more on these trends, see Council of Economic Advisers, “The Long-Term Decline in Prime-Age Male Labor Force Participation,” June 2016, https://obamawhitehouse.archives.gov/sites/default/files/page/files/20160620_cea_primeage_male_lfp.pdf.
[12] See Elizabeth McNichol, “How State Tax Policies Can Stop Increasing Inequality and Start Reducing It,” Center on Budget and Policy Priorities, December 15, 2016, https://www.cbpp.org/research/state-budget-and-tax/how-state-tax-policies-can-stop-increasing-inequality-and-start
[13] CBPP analysis of March 2016 Current Population Survey data.
[14] Chuck Marr et al., “EITC and Child Tax Credit Promote Work, Reduce Poverty, and Support Children’s Development, Research Finds,” Center on Budget and Policy Priorities, updated October 1, 2015, https://www.cbpp.org/research/federal-tax/eitc-and-child-tax-credit-promote-work-reduce-poverty-and-support-childrens.
[15] Chuck Marr et al., “Strengthening the EITC for Childless Workers Would Promote Work and Reduce Poverty,” Center on Budget and Policy Priorities, April 11, 2016, https://www.cbpp.org/research/federal-tax/strengthening-the-eitc-for-childless-workers-would-promote-work-and-reduce.
[16] For more on how the CTC works, see “Policy Basics: The Child Tax Credit,” Center on Budget and Policy Priorities, updated October 21, 2016, https://www.cbpp.org/research/federal-tax/policy-basics-the-child-tax-credit.
[17] For more, see Chuck Marr, Chloe Cho, and Arloc Sherman, “A Top Priority to Address Poverty: Strengthening the Child Tax Credit for Very Poor Young Children,” Center on Budget and Policy Priorities, August 10, 2016, https://www.cbpp.org/research/federal-tax/a-top-priority-to-address-poverty-strengthening-the-child-tax-credit-for-very.
[18] Tax Policy Center table T17-0188.
[19] Tax Policy Center table T17-0189.
[20] See Tax Policy Center table T17-0191 for the impact of some of the possible revenue-raising provisions the Trump plan could consider; if included in Trump’s plan, some of these provisions would mean that millions of working-class households with children would face average tax increases.
[21] The Trump plan proposes to consolidate the current seven tax brackets into three with rates of 10, 25, and 35 percent. The top marginal tax rate would fall from 39.6 percent to 35 percent.
[22] This estimate comes before factoring in refundable tax credits. Households whose federal income tax liability refundable tax credits reduce to zero could still receive small tax benefits from rate cuts.
[23] Office of the Press Secretary.
[24] Marr, 2017.
[25] Other top-tilted policies include a special lower top tax rate on “pass-through” business income, which is heavily concentrated among the nation’s most affluent people; lower top tax rates on unearned income from wealth such as capital gains and dividends, which are highly concentrated at the top; and the elimination of the estate tax, which would benefit only the heirs of the country’s wealthiest estates. (Only estates of more than $5.49 million per individual, or effectively $10.98 million per couple, were subject to any estate tax in 2017; these thresholds rise with inflation each year.)
[26] Tax Policy Center table T17-0189.
[27] CBPP calculations based on Tax Policy Center table T17-0189. The median income for a working-class family of three is less than $50,000. The Tax Policy Center uses a somewhat different income measure, “expanded cash income,” and uses tax units rather than households, so these income levels are not identical. They should, however, be reasonably comparable.
[28] Isaac Shapiro, Danilo Trisi, and Raheem Chaudhry, “Poverty Reduction Programs Help Adults Lacking College Degrees the Most,” Center on Budget and Policy Priorities, February 16, 2017, https://www.cbpp.org/research/poverty-and-inequality/poverty-reduction-programs-help-adults-lacking-college-degrees-the.
[29] House Speaker Paul Ryan also has previously expressed support for a proposal — nearly identical to a proposal President Obama made — to roughly double the maximum EITC for this group and make workers age 21 to 24 eligible. However, House Republicans did not include such an expansion in their “Better Way” tax plan. See: Marr et al., 2016.
[30] Ibid.
[31] Neil Irwin, “What Would It Take to Replace the Pay Working-Class Americans Have Lost?,” New York Times Upshot, December 9, 2016, https://www.nytimes.com/2016/12/09/upshot/what-would-it-take-to-replace-the-pay-working-class-americans-have-lost.html?_r=0.
[32] Dylan Matthews, “Why Democrats Should Support Radically Simpler Taxes,” Vox, May 8, 2017, https://www.vox.com/policy-and-politics/2017/5/8/15442172/democrats-tax-plan-return-free-filing-trump-ambitious.
[33] Tax Policy Center table T17-0024.
[34] This EITC expansion would also benefit roughly 11 million low- and moderate-income families and individuals in which at least one person has a bachelor’s degree.
[35] H.R. 821, S. 1371, and S. 2264.
[36] S.3231.
[37] For example, all of these proposals would index the maximum credit to inflation. Indexing would increase tax-credit benefits for both working-class families receiving the CTC and families at higher income levels. (It would benefit all CTC recipients who qualify for the maximum credit.) Indexing the maximum credit would benefit substantially more working-class families if the CTC were fully refundable or started phasing in from the first dollar of earnings, as more working-class families would then qualify for the maximum credit.
[38] Moreover, some of the revenue-raising provisions President Trump may consider, like repealing personal exemptions and head of household filing status as his campaign tax plan did, would disproportionately target low- and middle-income households.
[39] “Estimated Budget Effects of the Revenue Provisions Contained in the President’s Fiscal Year 2017 Budget Proposal,” Joint Committee on Taxation, March 24, 2016, https://www.jct.gov/publications.html?func=startdown&id=4902.
[40] See Chad Stone et al., “A Guide to Statistics on Historical Trends in Income Inequality,” Center on Budget and Policy Priorities, updated November 7, 2016, https://www.cbpp.org/research/poverty-and-inequality/a-guide-to-statistics-on-historical-trends-in-income-inequality.
[41] See Congressional Budget Office, “The Distribution of Household Income and Federal Taxes, 2013,” June 2016, https://www.cbo.gov/publication/51361.