16 Million People Will Fall Into or Deeper Into Poverty if Key Provisions of Working-Family Tax Credits Expire
Congress Must Act to Save Key Provisions
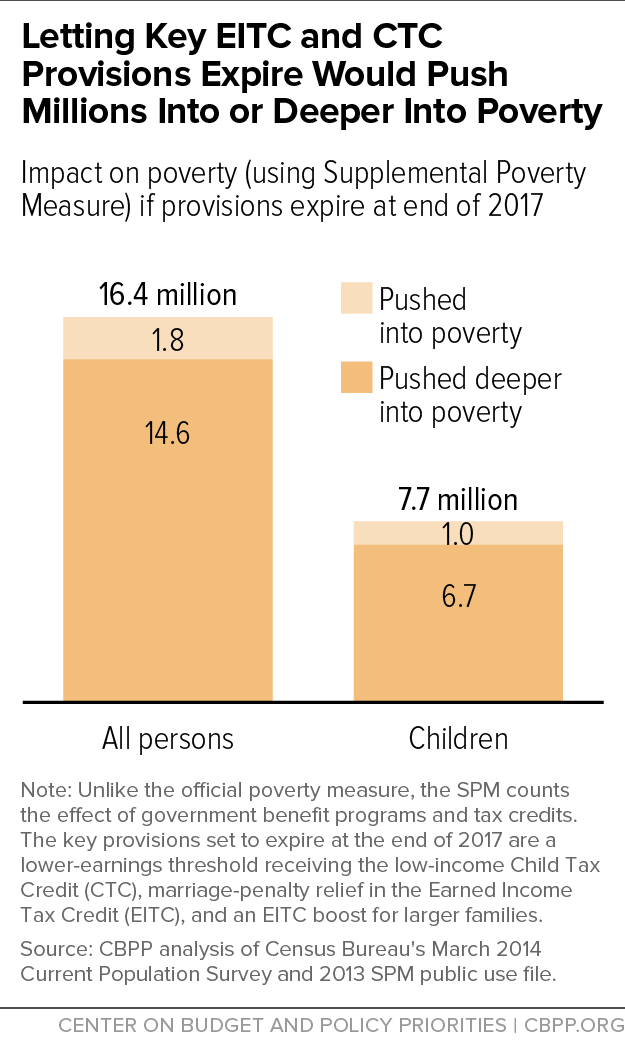
More than 16 million people in low- and modest-income working families, including 8 million children, would fall into — or deeper into — poverty in 2018 if policymakers fail to save key provisions of two important tax credits (see Figure 1). Over 50 million Americans, including 25 million children, would lose part or all of their Child Tax Credit (CTC) or Earned Income Tax Credit (EITC).[1] Table 1 in the Appendix provides state-by-state data.
The EITC and CTC encourage and reward work, and there is growing evidence that income from these tax credits leads to better maternal and infant health, improved school performance, higher college enrollment, and increased work effort and earnings in adulthood.[2] Both tax credits have enjoyed bipartisan support, and their underlying provisions are permanent parts of the tax code. But several key features of the tax credits — a lower CTC earnings exclusion (which allows millions of working families to earn a more adequate CTC and means fewer working-poor families are shut out of the credit entirely), EITC “marriage-penalty” relief, and a larger EITC for families raising more than two children — are set to expire at the end of 2017.
Saving these key provisions should be a priority for policymakers and deserves bipartisan support. The expected push this fall to permanently extend several corporate tax breaks should not take precedence over these key provisions of pro-work tax credits. When policymakers consider which expiring provisions should receive permanent status, they should accord top priority to the three important CTC and EITC provisions scheduled to expire at the end of 2017.
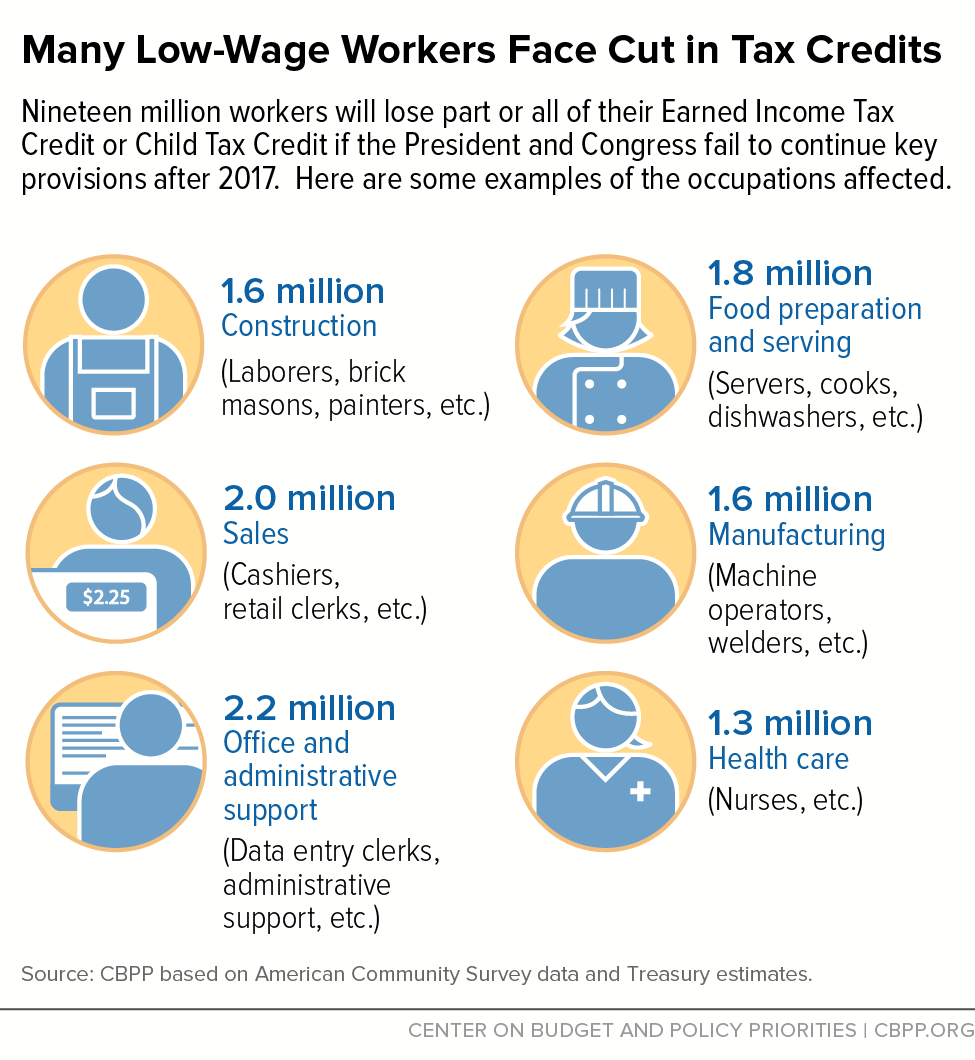
The stakes for working families are high. For example, a single mother with two children working full time in a nursing home for the federal minimum wage and earning $14,500 would lose her entire CTC of $1,725 if the CTC provision expires. This is because the CTC phases in with earnings, but if the provisions expire, not one penny of a worker’s first $14,600 in earnings would count toward the credit. Millions of other workers in low-wage jobs — from child care workers to custodians to health care workers — also face losing some or all of these tax credits.
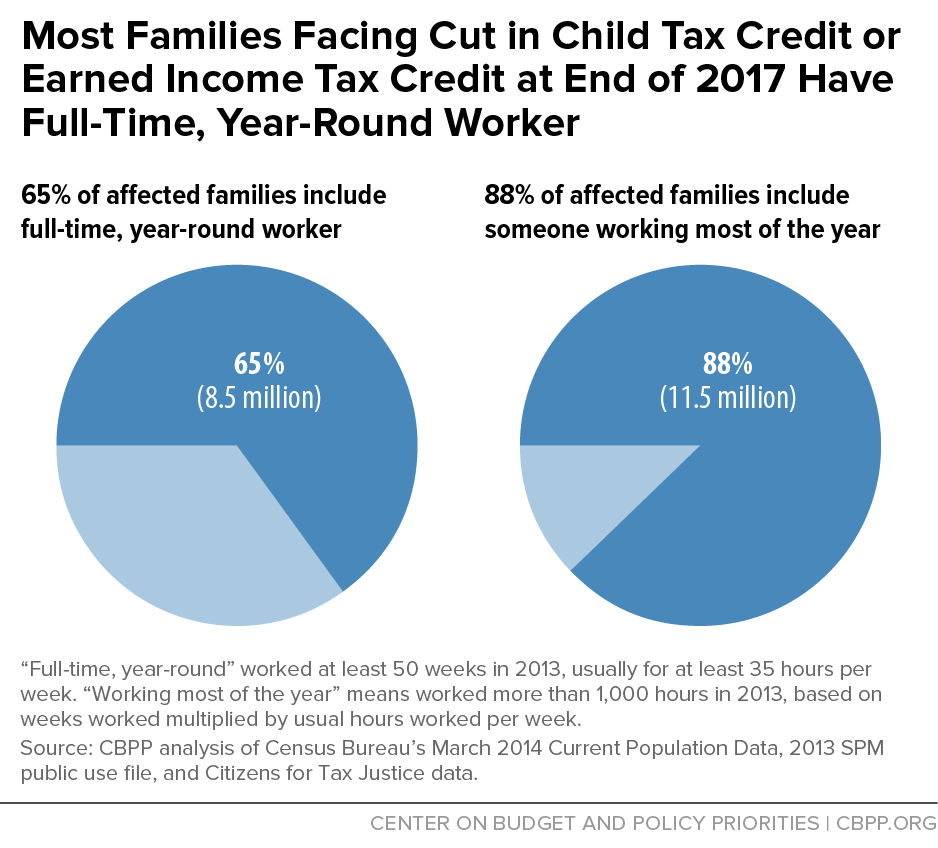
Some 65 percent of the families that would lose part or all of their tax credits include at least one full-time, year-round worker. Consider who stands to lose all or part of their CTC or EITC in 2018: about 1 million veteran and military families;[3] about 2.6 million rural families;[4] and over 6 million millennial workers.[5] Also, 15 percent of the families that would lose all or part of their tax credits include at least one member with a disability. Nearly 400,000 individuals with a self-reported disability would lose all or part of their tax credits.[6]
The Consequences if Congress Doesn’t Act
Unless Congress takes action, the key provisions of the working-family tax credits — a lower CTC earnings exclusion, EITC marriage-penalty relief, and a larger EITC for bigger families — will expire at the end of 2017.[7] (See box for the history of these provisions.) If that happens:
- Not one penny of the earnings of a full-time, minimum-wage worker would count toward the CTC, because the credit’s earnings exclusion (the amount of earnings ignored in determining a family’s eligibility for the CTC) would nearly quintuple from $3,000 to $14,600. A single mother with two children working full time at the federal minimum wage and earning $14,500 would thus lose her entire $1,725 CTC. Moreover, not only would the earnings a parent needed to qualify for even a tiny CTC jump to $14,600, but the earnings needed to qualify for the full CTC (of $1,000 per child) would rise to nearly $28,000 for a married couple with two children — up sharply from $16,330 under current policy. As a result, many low-income working families that would still qualify for the CTC after 2017 would see their credit cut dramatically. For example, the CTC for a family with two children earning $20,000 would drop from $2,000 to $810.
- Many married couples would face higher marriage penalties, due to a cut in their EITC. Currently, to reduce marriage penalties, the income level at which the EITC begins to phase out is set $5,000 higher for married couples than for single filers. After 2017, it would be set $3,000 higher, which would shrink the EITC for many low-income married filers and increase the marriage penalty for many two-earner families.
- Larger families would face a cut in their EITC. After 2017, the maximum EITC for families with more than two children would be cut more than $700, by lowering it to the level of the maximum EITC for families with two children.[8]
The millions of low-income working families affected by the expiration of these three CTC and EITC provisions would lose an average of about $1,070 a year.[9]
Millions of Americans in Working Families Would Face Cut
An estimated total of over 50 million people in low- and modest-income working families would lose all or part of their CTC or EITC if Congress fails to save the key EITC and CTC provisions set to expire at the end of 2017.[10] The vast majority of the affected families include people who work all or the majority of the year, as Figure 2 shows.
A diverse range of workers and families stands to lose nationwide. Table 2 in the Appendix has state-by-state estimates for each of these affected groups:
- Working families facing a cut to their tax credits. More than 13 million families, including 25 million children, will lose all or part of their tax credits.[11]
- Working families pushed into (or deeper into) poverty. The loss of the key EITC and CTC provisions would push 16.4 million people — including nearly 8 million children — into or deeper into poverty.[12]
- Veteran and military families. About 1 million veteran and military families would lose all or part of their tax credits.[13]
- Rural working families. About 2.6 million rural families would lose all or part of their tax credits.[14]
- Millennial workers. Over 6 million millennial workers would lose all or part of their tax credits.[15]
Estimates show that workers in a wide range of low-wage occupations would be adversely affected. Nationwide, they include:[16]
- Roughly 2.2 million office and administrative support workers, like data entry clerks;
- Roughly 1.6 million transportation and warehousing workers, like truck drivers;
- Roughly 1.3 million health care workers, like home health aides;
- And roughly 1.1 million personal care and service workers, like child care workers.
Our previous report sets out state-by-state estimates for selected occupations illustrating the wide variety of workers affected in each state.[17]
Furthermore, 15 percent of all families that would lose some or all of their EITC or CTC — more than one in every seven — include one or more people with a disability.[18] Nearly 400,000 workers with a self-reported disability would lose all or part of their tax credits.[19]
Box: History of EITC and CTC Provisions
Policymakers created the Child Tax Credit (CTC) in 1997 to help families meet the costs of raising children. The original credit was generally not refundable, meaning that working families with incomes too low to owe federal income tax — who often have the most difficulty covering child-related costs — could not receive the credit.
The 2001 Bush tax cuts doubled the maximum CTC from $500 to $1,000 per child and made the credit partially refundable, thereby enabling many working-poor families to qualify for the credit for the first time. Like the Earned Income Tax Credit (EITC), the CTC phases in with family earnings, and the Bush tax cuts made a family eligible for a refundable CTC of 15 cents for every dollar it earns, up to the full $1,000 per child. However, the first $10,000 of family earnings did not count in determining whether a family was eligible for the CTC and, if so, for what size credit; as a result, millions of working-poor families received only a partial credit or were shut out entirely. This $10,000 earnings exclusion was adjusted upward for inflation each year, so by 2007, families needed to earn close to $12,000 before qualifying for any CTC, and workers with earnings modestly above this threshold received only a very small credit.
Recognizing the challenges that child-rearing costs create for working-poor families, policymakers took important steps — in 2008 under President Bush and in 2009 under President Obama — to lower the CTC’s earnings exclusion, which now stands at $3,000. The change means that all but the first $3,000 in earnings counts when determining a family’s CTC, allowing millions of low-income working families to get a larger credit and millions more to qualify for a partial credit for the first time. This change has meant that parents who are out of work now have a more powerful incentive to look for and take even very low-paying or part-time jobs, if that is all they can find. It also encourages poor parents who are already employed to try to secure more hours of work and raise their earnings.
The 2009 legislation also strengthened the EITC by reducing its “marriage penalties” (the loss of some EITC for certain couples when they marry) and by boosting the EITC for families with more than two children to help them cover the higher costs they face in raising at least three children in their home. (Some 36 percent of all children live in families with more than two children, but 50 percent of poor children do. This reflects the fact that costs rise with family size but wages do not.a)
At the end of 2010, policymakers extended these key CTC and EITC features through 2012 in compromise legislation, where this extension was paired with a measure that shrank the estate tax for wealthy filers. Policymakers largely extended both sets of changes again in the 2012 “fiscal cliff” legislation — but not for the same duration: they made most of the estate tax cuts permanent, while extending the CTC and EITC provisions only through 2017. President Obama and key members of the House and Senate have since proposed to make these tax-credit provisions permanent.
a CBPP analysis of the Census Bureau’s March 2014 CPS and 2013 Supplemental Poverty Measure public use file.
| TABLE 1 | ||||
|---|---|---|---|---|
| Appendix Table 1 State-by-State Impact if EITC and CTC Provisions Expire at End of 2017 | ||||
| Families affected | Children affected | People pushed into or deeper into poverty | Children pushed into or deeper into poverty | |
| United States | 13,031,000 | 24,815,000 | 16,399,000 | 7,717,000 |
| Alabama | 280,000 | 480,000 | 184,000 | 90,000 |
| Alaska | 22,000 | 41,000 | 31,000 | 17,000 |
| Arizona | 283,000 | 644,000 | 488,000 | 254,000 |
| Arkansas | 159,000 | 298,000 | 130,000 | 67,000 |
| California | 1,488,000 | 3,018,000 | 3,786,000 | 1,684,000 |
| Colorado | 183,000 | 318,000 | 264,000 | 129,000 |
| Connecticut | 72,000 | 141,000 | 146,000 | 63,000 |
| Delaware | 34,000 | 55,000 | 41,000 | 20,000 |
| District of Columbia | 21,000 | 45,000 | 27,000 | 13,000 |
| Florida | 1,007,000 | 1,757,000 | 1,212,000 | 537,000 |
| Georgia | 639,000 | 1,197,000 | 626,000 | 302,000 |
| Hawaii | 52,000 | 100,000 | 89,000 | 41,000 |
| Idaho | 67,000 | 117,000 | 73,000 | 37,000 |
| Illinois | 445,000 | 904,000 | 668,000 | 322,000 |
| Indiana | 256,000 | 485,000 | 256,000 | 125,000 |
| Iowa | 84,000 | 179,000 | 84,000 | 41,000 |
| Kansas | 96,000 | 191,000 | 117,000 | 66,000 |
| Kentucky | 180,000 | 323,000 | 157,000 | 77,000 |
| Louisiana | 251,000 | 433,000 | 224,000 | 118,000 |
| Maine | 37,000 | 64,000 | 34,000 | 16,000 |
| Maryland | 158,000 | 315,000 | 243,000 | 114,000 |
| Massachusetts | 169,000 | 305,000 | 251,000 | 108,000 |
| Michigan | 415,000 | 727,000 | 357,000 | 176,000 |
| Minnesota | 111,000 | 244,000 | 173,000 | 90,000 |
| Mississippi | 201,000 | 363,000 | 132,000 | 67,000 |
| Missouri | 256,000 | 478,000 | 246,000 | 129,000 |
| Montana | 34,000 | 59,000 | 28,000 | 14,000 |
| Nebraska | 56,000 | 100,000 | 65,000 | 32,000 |
| Nevada | 107,000 | 223,000 | 215,000 | 107,000 |
| New Hampshire | 25,000 | 38,000 | 37,000 | 17,000 |
| New Jersey | 219,000 | 435,000 | 480,000 | 213,000 |
| New Mexico | 124,000 | 225,000 | 94,000 | 45,000 |
| New York | 755,000 | 1,445,000 | 1,132,000 | 506,000 |
| North Carolina | 523,000 | 1,079,000 | 429,000 | 206,000 |
| North Dakota | 16,000 | 24,000 | 15,000 | 7,000 |
| Ohio | 407,000 | 778,000 | 356,000 | 172,000 |
| Oklahoma | 200,000 | 351,000 | 162,000 | 83,000 |
| Oregon | 125,000 | 238,000 | 164,000 | 80,000 |
| Pennsylvania | 381,000 | 750,000 | 398,000 | 179,000 |
| Rhode Island | 31,000 | 56,000 | 39,000 | 18,000 |
| South Carolina | 279,000 | 510,000 | 183,000 | 86,000 |
| South Dakota | 27,000 | 59,000 | 24,000 | 12,000 |
| Tennessee | 351,000 | 610,000 | 337,000 | 156,000 |
| Texas | 1,498,000 | 2,925,000 | 1,830,000 | 915,000 |
| Utah | 115,000 | 258,000 | 143,000 | 74,000 |
| Vermont | 16,000 | 25,000 | 14,000 | 6,000 |
| Virginia | 284,000 | 486,000 | 304,000 | 148,000 |
| Washington | 242,000 | 458,000 | 271,000 | 129,000 |
| West Virginia | 81,000 | 131,000 | 40,000 | 18,000 |
| Wisconsin | 158,000 | 301,000 | 175,000 | 89,000 |
| Wyoming | 15,000 | 28,000 | 14,000 | 7,000 |
| TABLE 2 | ||||
|---|---|---|---|---|
| Appendix Table 2 State-by-State Impact if EITC and CTC Provisions Expire at End of 2017 | ||||
| Total dollars lost (millions) | Veteran and military families affected | Rural families affected | Millennial workers affected | |
| United States | 14,000 | 1,000,000 | 2,600,000 | 6,300,000 |
| Alabama | 312 | 23,000 | 83,000 | 148,000 |
| Alaska | 20 | 4,000 | 10,000 | 12,000 |
| Arizona | 329 | 23,000 | 24,000 | 125,000 |
| Arkansas | 174 | 18,000 | 81,000 | 92,000 |
| California | 1,647 | 78,000 | 36,000 | 642,000 |
| Colorado | 173 | 22,000 | 30,000 | 94,000 |
| Connecticut | 66 | 5,000 | 6,000 | 31,000 |
| Delaware | 38 | 4,000 | * | 17,000 |
| District of Columbia | 23 | 1,000 | * | 11,000 |
| Florida | 1,124 | 67,000 | 47,000 | 390,000 |
| Georgia | 698 | 48,000 | 116,000 | 351,000 |
| Hawaii | 59 | 9,000 | 13,000 | 23,000 |
| Idaho | 64 | 9,000 | 35,000 | 34,000 |
| Illinois | 482 | 29,000 | 67,000 | 226,000 |
| Indiana | 264 | 25,000 | 79,000 | 136,000 |
| Iowa | 78 | 10,000 | 60,000 | 48,000 |
| Kansas | 94 | 14,000 | 53,000 | 59,000 |
| Kentucky | 190 | 22,000 | 117,000 | 95,000 |
| Louisiana | 292 | 20,000 | 58,000 | 116,000 |
| Maine | 30 | 6,000 | 26,000 | 17,000 |
| Maryland | 189 | 13,000 | 8,000 | 79,000 |
| Massachusetts | 168 | 10,000 | 4,000 | 69,000 |
| Michigan | 428 | 32,000 | 86,000 | 195,000 |
| Minnesota | 120 | 13,000 | 58,000 | 62,000 |
| Mississippi | 225 | 14,000 | 134,000 | 104,000 |
| Missouri | 255 | 27,000 | 98,000 | 149,000 |
| Montana | 31 | 7,000 | 31,000 | 18,000 |
| Nebraska | 49 | 8,000 | 30,000 | 32,000 |
| Nevada | 141 | 10,000 | 11,000 | 50,000 |
| New Hampshire | 22 | 3,000 | 17,000 | 11,000 |
| New Jersey | 256 | 13,000 | * | 90,000 |
| New Mexico | 130 | 11,000 | 49,000 | 61,000 |
| New York | 809 | 30,000 | 61,000 | 323,000 |
| North Carolina | 591 | 54,000 | 148,000 | 269,000 |
| North Dakota | 15 | 2,000 | 13,000 | 10,000 |
| Ohio | 478 | 39,000 | 125,000 | 208,000 |
| Oklahoma | 212 | 20,000 | 83,000 | 110,000 |
| Oregon | 131 | 17,000 | 39,000 | 65,000 |
| Pennsylvania | 410 | 34,000 | 59,000 | 175,000 |
| Rhode Island | 29 | 2,000 | * | 14,000 |
| South Carolina | 319 | 23,000 | 59,000 | 148,000 |
| South Dakota | 30 | 3,000 | 20,000 | 17,000 |
| Tennessee | 340 | 32,000 | 105,000 | 190,000 |
| Texas | 1,545 | 94,000 | 193,000 | 755,000 |
| Utah | 136 | 9,000 | 15,000 | 67,000 |
| Vermont | 16 | 2,000 | 17,000 | 8,000 |
| Virginia | 247 | 34,000 | 59,000 | 127,000 |
| Washington | 236 | 28,000 | 40,000 | 123,000 |
| West Virginia | 77 | 9,000 | 37,000 | 38,000 |
| Wisconsin | 173 | 17,000 | 64,000 | 79,000 |
| Wyoming | 16 | 3,000 | 15,000 | 9,000 |
End Notes
[1] Citizens for Tax Justice, “Making the EITC and CTC Expansions Permanent Would Benefit 13 Million Working Families,” February 20, 2015, http://ctj.org/pdf/ctceitcreport2015.pdf.
[2] Chuck Marr, Chye-Ching Huang, Arloc Sherman, and Brandon DeBot, “EITC and Child Tax Credit Promote Work, Reduce Poverty, and Support Children’s Development, Research Finds,” Center on Budget and Policy Priorities, updated April 3, 2015, http://bit.ly/1NupNqR.
[3] Arloc Sherman, et al., “Pro-Work Tax Credits Help 2 Million Veteran and Military Households,” Center on Budget and Policy Priorities, June 30, 2015, http://bit.ly/1BUqj0E.
[4] Bryann DaSilva, et al., “Pro-Work Tax Credits Help 4.8 Million Rural Households,” Center on Budget and Policy Priorities, August 24, 2015, http://bit.ly/1fExYpi.
[5] Bryann DaSilva, Arloc Sherman, and Chye-Ching Huang, “14 Million Millennials Benefit From Pro-Work Tax Credits,” Center on Budget and Policy Priorities, June 12, 2015, http://bit.ly/1R0A0MF.
[6] CBPP analysis of Treasury Office of Tax Analysis estimates and the Census Bureau’s March 2014 Current Population Survey.
[7] The American Opportunity Tax Credit (which is not the subject of this paper), a partially refundable credit that helps defray college costs, is also set to expire at the end of 2017 and should be made permanent. If it expires, it will be replaced by the non-refundable Hope Credit, which has a lower maximum value ($1,800 instead of $2,500) and is available for fewer years of study (up to two years instead of four). If the AOTC expires, about 11 million mostly middle-class families will lose some or all of the tax credits they would otherwise receive to help offset college costs.
[8] In 2015, the maximum EITC for families raising more than two children is $694 larger than the maximum EITC for families with two children. These maximum credit amounts are indexed for inflation, so the nominal dollar difference will widen modestly between now and 2017.
[9] Citizens for Tax Justice, “Making the EITC and CTC Expansions Permanent Would Benefit 13 Million Working Families,” 2015. See also Chye-Ching Huang, “What Would Congress’s Inaction Cost Working Families? Find Out.” Center on Budget and Policy Priorities, October 8, 2014, http://bit.ly/1rXoOq1 for an interactive calculator of the impact if the provisions expire.
[10] CBPP analysis of Census Bureau’s March 2014 Current Population Survey and CTJ estimates.
[11] About 3.6 million families — including 5.0 million children — will lose their entire CTC, while an additional 5.6 million families — including 10.2 million children — will lose part of their CTC. About 6.3 million families, including 14.7 million children, will lose part or all of their EITC. Estimates from CBPP analysis of data from CTJ, using totals from “Making the EITC and CTC Expansions Permanent Would Benefit 13 Million Working Families,” February 20, 2015, http://ctj.org/pdf/ctceitcreport2015.pdf and the proportion of families and children losing the CTC from “The Debate over Tax Cuts: It’s not Just About the Rich,” July 19, 2012, http://ctj.org/pdf/refundablecredits2012.pdf.
[12] CBPP analysis of Census Bureau’s March 2014 Current Population Survey and 2013 SPM public use file.
[13] Arloc Sherman, et al., “Pro-Work Tax Credits Help 2 Million Veteran and Military Households.”
[14] Bryann DaSilva, et al., “Pro-Work Tax Credits Help 4.8 Million Rural Households.”
[15] Bryann DaSilva, et al., “14 Million Millennials Benefit From Pro-Work Tax Credits.”
[16] Chuck Marr, Vincent Palacios, and Bryann DaSilva, “Saving Key Provisions of Pro-Work Tax Credits Would Help Wide Range of Low-Wage Workers,” Center on Budget and Policy Priorities, August 27, 2015, http://bit.ly/1LAFvkI.
[17] Ibid.
[18] CBPP analysis of Census Bureau’s March 2014 Current Population Survey.
[19] CBPP analysis of Treasury Office of Tax Analysis estimates and the Census Bureau’s March 2014 Current Population Survey.
More from the Authors

Areas of Expertise