New Budget Deal Needed to Avert Cuts, Invest in National Priorities
Unless Congress and the President reach a new budget agreement, both non-defense and defense discretionary program areas will face deep cuts in 2020 and 2021, forced by tight funding limits and additional cuts (known as “sequestration”) mandated by the 2011 Budget Control Act (BCA). The most recent bipartisan budget agreement, which covered fiscal years 2018 and 2019, provides a model for a new agreement; it eliminated the sequestration cuts on discretionary programs and provided additional resources for new investments in key priority areas.
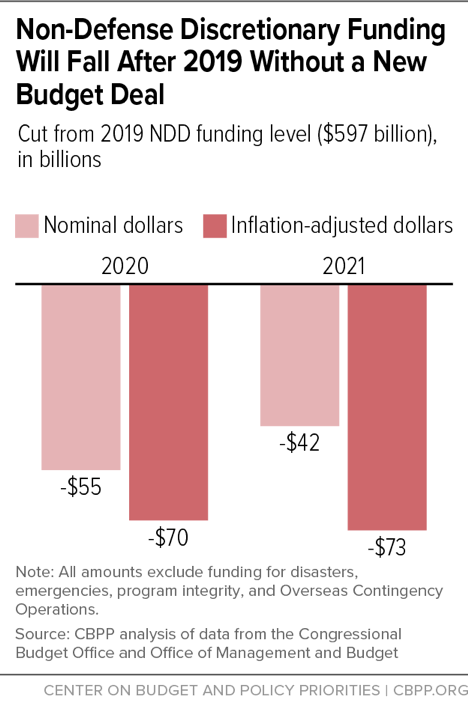
Without an agreement… NDD programs on average would have to be cut 11 percent in 2020 after adjusting for inflation.Without an agreement, overall funding would revert to the BCA levels. Under the BCA, fiscal year 2020 funding for non-defense discretionary (NDD) programs — which include a wide variety of areas such as education, scientific research, infrastructure, national parks and forests, environmental protection, law enforcement, public health, veterans’ health care, and homeland security — would be $55 billion below the 2019 level before adjusting for inflation. NDD programs on average would have to be cut 11 percent in 2020 after adjusting for inflation. Defense would be cut deeply as well: $71 billion below the 2019 level, which after accounting for inflation would mean a 13 percent cut, on average, for defense programs.
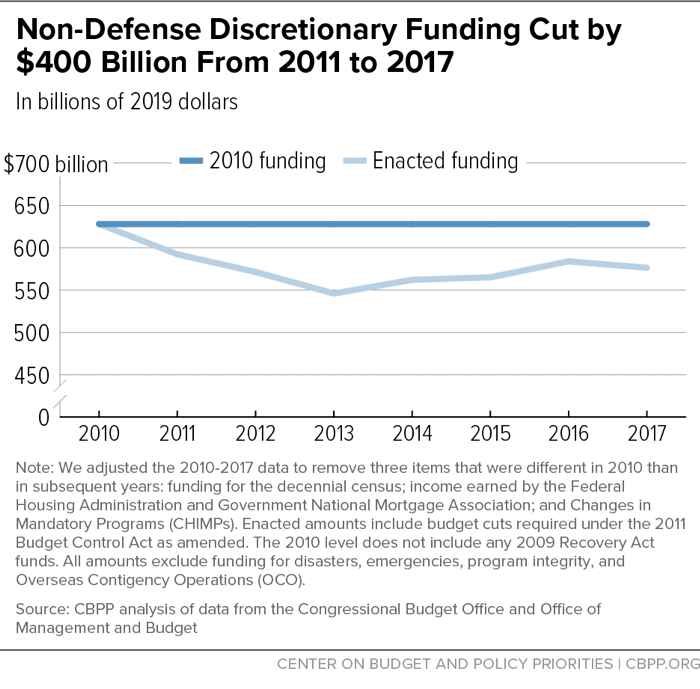
Since 2013, Congress and the President have enacted a series of temporary bipartisan budget agreements, generally covering two years at a time, that ameliorated the BCA’s sequestration cuts. The agreements reached prior to the most recent deal scaled back, but did not eliminate, the sequestration cuts. Partly as a result, funding for NDD programs for 2011-2017 was cut substantially below 2010 levels adjusted for inflation. Over that seven-year period, NDD funding was cut by roughly $400 billion compared with what these programs would have received over that period if funding had maintained its 2010 inflation-adjusted level.
The budget agreement that Congress and the President reached for 2018 and 2019 both fully eliminated the BCA’s sequestration cuts to defense and non-defense discretionary programs and provided new resources for defense and NDD, a step toward reversing the disinvestment of the prior seven years. This agreement paved the way for a significant increase for child care, new resources to address the opioid epidemic, key infrastructure needs ranging from public housing and national park modernization to clean water projects, and resources for other needs.
In setting funding levels for the next two years, policymakers should build on the progress in addressing underfunded areas they made under the most recent budget agreement and provide adequate resources for several areas that face pressing new or unique funding needs in 2020. This includes implementing the 2018 Mission Act, which expands health services provided outside of Veterans Affairs (VA) health facilities and requires increased resources, and funding the 2020 decennial census.
New Budget Agreement Needed to Avert Deep Cuts in Discretionary Programs
The 2011 Budget Control Act set caps on both non-defense and defense discretionary funding for each year through 2021. It also mandated that the already austere caps set in the statute be lowered substantially if Congress did not enact more than $1.2 trillion in deficit reduction later in 2011. The additional cuts that are required by the reduction in the caps, known as “sequestration,” were triggered because Congress didn’t pass such legislation.
Since 2013 lawmakers of both parties have broadly agreed that the BCA-mandated caps are too low to meet national priorities in both defense and non-defense areas. To address this shortfall, Congress has enacted a series of temporary budget deals, generally lasting two years, that have increased funding above the sequestration levels. Each deal increased both the defense and non-defense discretionary caps by roughly equal amounts, recognizing that the BCA’s sequestration provision cut defense and non-defense programs by equal amounts.
The most recent deal covered fiscal years 2018 and 2019. Unlike prior agreements, it fully reversed the harmful discretionary sequestration cuts and provided additional resources for new investments.[1] (See the Appendix for more details on how the BCA caps, sequestration, and prior deals affected funding levels.)
If Congress and the President fail to reach a new agreement and funding levels revert to the sequestration levels in 2020, the cuts to both non-defense and defense programs would be severe:
-
Non-defense. Funding for non-defense discretionary programs in fiscal year 2020 would be $55 billion below the 2019 level or a 9 percent cut, before adjusting for inflation. (See Figure 1.)
Inflation raises the costs of services and benefits provided through NDD programs — for example, the wages of workers providing services and the costs of materials. When adjusting for inflation, funding under the BCA in 2020 would be $70 billion below the 2019 level. This would mean that NDD-funded services would have to be cut by an average of 11 percent if funding fell to the BCA “post-sequestration” level in 2020.

-
- Some areas would have to be cut more deeply than the average funding cut to accommodate other areas that policymakers will want to protect from cuts in fiscal year 2020.
- There are also several areas that need significant additional resources in 2020, such as the 2020 decennial census, a constitutional obligation; the recently enacted Mission Act, which expands health care outside of VA medical centers for veterans who need it; and the increased costs in the regular veterans’ health care program that result from rising health care costs and other pressures. These three areas alone require an estimated $14 billion in new funding above 2019 levels (without adjusting for inflation) in the coming fiscal year.
- Defense. If funding reverts to the sequestration levels, overall defense funding would fall below 2019 levels by $71 billion (see Figure 2) or an 11 percent cut, before adjusting for inflation. After adjusting for inflation, the result would be a 13 percent ($87 billion) cut from 2019.[2]
NDD Cut Significantly Prior to Last Budget Deal
Cuts to NDD started in 2011. And, while the full sequestration cuts called for in the BCA were partially reversed over the 2013-2017 period, there were nevertheless significant cuts in non-defense discretionary funding as a result of the combination of the BCA’s funding caps and the partial sequestration cuts that were implemented. As noted, it was not until the most recent budget agreement for fiscal years 2018 and 2019 that the discretionary sequestration cuts were fully reversed and additional resources for new investments provided, following a seven-year period of disinvestment.
Between 2011 and 2017, we conservatively estimate that non-defense discretionary programs received about $400 billion less in funding than would have been the case if NDD funding had maintained its 2010 funding adjusted for inflation.[3] (See Figure 3.)
In some cases, this period of disinvestment has led to higher funding needs today. For example, underfunding over this period meant that basic maintenance, repairs, and capital improvements in national parks and public housing developments were deferred. These agencies need to catch up on this work, and in some cases, deferred projects can be more expensive than they otherwise would have been because facilities may have deteriorated to a greater degree. For instance, delays in fixing a leaky roof in a public housing development can lead to more severe structural damage that costs more to repair. In other cases, the disinvestment meant that the public received fewer — or lower-quality — services than would have been provided if funding had just kept pace with inflation.
For example, compared to the total cumulative funding that programs would have received over the 2011-2017 period if funding had been maintained at the 2010 level, adjusted for inflation:
- Job training was cut by $4.4 billion; funding in 2017 was 19 percent below 2010 funding adjusted for inflation. The funds that were cut from 2011 through 2017 would have been enough to provide job training to roughly 900,000 people.
- K-12 education was cut by $35.9 billion; funding in 2017 was 16 percent below 2010 funding adjusted for inflation. These cuts came at a time when states were digging out of the education funding cuts they made as a result of the Great Recession; state and local K-12 funding in 2017 remained below pre-recession levels in about 20 states.[4] And in 42 states, teacher salaries in 2017 were below 2010 levels adjusted for inflation, one result of the education cuts states made during the recession and its aftermath, when state revenues fell.[5]
- The Environmental Protection Agency’s (EPA) operating budget was cut by roughly $5.7 billion; funding in 2017 was 25 percent below 2010 funding when adjusted for inflation. EPA’s operating budget funds an array of efforts, including clean air programs, the Brownfields program (designed to help clean up contaminated property and ensure it can be re-used), and enforcement efforts, among other essential environmental protection and public health programs.
While these figures reflect cuts since 2010, a number of areas were underfunded in 2010; the nation faced significant child care, education, job training, infrastructure, and environmental needs that were not being met in 2010. NDD funding levels in 2010 provide a useful benchmark for measuring cuts that occurred in the years after 2010, but should not be considered the target for the appropriate level of NDD funding.
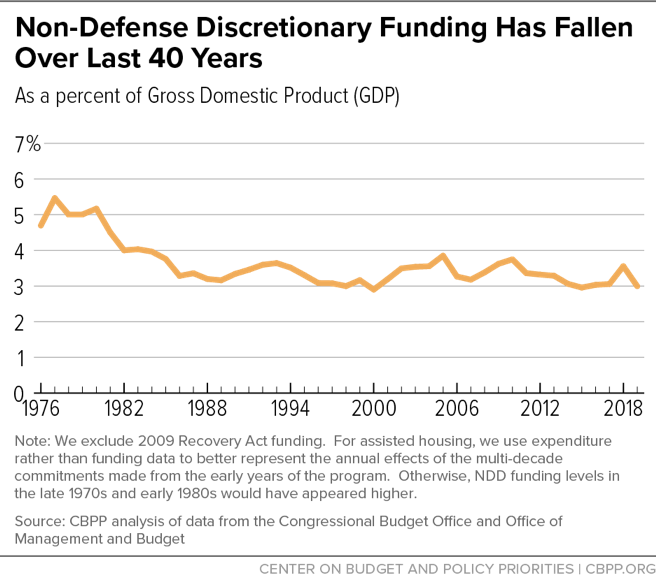
Funding in 2010 Was Not High by Historic Standards
Funding for non-defense discretionary programs is much lower today than in the mid-1970s and early 1980s when measured as a percent of the economy. Over the 1976-2019 period, NDD funding a averaged 3.6 percent of GDP, just a bit below the 2010 level of 3.7 percent.b NDD funding as a percent of GDP was significantly higher in the 1976-1984 period and then fluctuated roughly between 3.0 and 3.8 percent of GDP in subsequent years, with periods of cuts followed by periods of re-investment. NDD funding in 2019 stands at just 3.0 percent of GDP (it was higher in 2018 largely because of high emergency costs).
Some have pointed out that NDD funding in 2010 was higher than in prior years when measured in inflation-adjusted dollars. Over time, however, in a country with population growth and a growing economy, investments in education, housing, public health, law enforcement, and environmental protection need to grow to reflect the larger population that the programs serve, as well as the increased need for — and the economy’s increased ability to finance — certain kinds of public goods such as higher education, which has become more crucial in the 21st century economy, and efforts to protect the environment from the consequences of economic growth and climate change. That is why looking only at NDD funding without considering the size of the population and the nation’s economy is an inadequate way to measure NDD funding over long periods of time.
a These figures reflect budget authority except in the case of certain housing programs. For these programs, the figures reflect outlays because of changes over the time period in the degree to which housing assistance was funded on a multi-year rather than single-year basis.
b This figure excludes funding provided under the American Reinvestment and Recovery Act but includes funding for emergencies. Emergency funding — such as disaster aid following a hurricane — cannot easily be separated from this historical funding data series; other funding figures elsewhere in this analysis exclude emergency funding. This data series on NDD funding goes back to 1976.
Most Recent Budget Deal Began to Reverse Disinvestment
The most recent budget deal fully reversed the sequestration cuts in discretionary programs and provided resources for new investment, setting 2018 NDD funding $60.5 billion above the 2017 level (without adjusting for inflation). In inflation-adjusted terms, this funding remained below the 2010 level — and well below the 2010 level adjusted both for inflation and population growth — but was 9 percent higher than in 2017.
This increased funding allowed policymakers to begin to dig out of the hole created by the substantial NDD cuts from 2011 to 2017. As a result of the budget agreement and subsequent appropriations legislation, the following received increased investments:
- Child Care and Head Start: Funding for the nation’s main child care program — the Child Care and Development Block Grant — increased by $2.4 billion in 2018, while funding for Head Start increased by $600 million. This child care funding increase was the largest one-year increase ever enacted. (In 2019, funding for these areas increased modestly above the 2018 levels.) These new resources will allow states to increase the number of children receiving child care assistance and improve the quality of care, while providing Head Start programs with additional funding to expand the number of students attending programs that are a full school day and full school year. But, as discussed below, even with these resources, it remains the case that only a small share of children eligible for child care assistance can receive it because of a lack of funding.
- Infrastructure: The 2018 appropriations legislation increased funding for infrastructure projects across agencies, including new investments in water, sanitation, and transportation projects in the Departments of Commerce and Transportation and the EPA. For example, funding for Capital Investment Grants, used to build or expand commuter rail, light rail, and subway transit systems, increased by over $230 million. In addition, the National Infrastructure Investments (BUILD) grants program, which supports initiatives such as rural broadband infrastructure, increased by $1 billion.
- Opioids and substance use disorder prevention and treatment: The agreement resulted in new resources across several agencies to address the opioid crisis, including research, treatment, prevention, and law enforcement. For example, funding for the Substance Abuse and Mental Health Services Administration received $1 billion for new opioid response grants to states, the National Institutes of Health received increased research funding to study opioid addiction, and funding was made available to increase the number of substance use disorder health care professionals in underserved communities. The agreement also increased funding for the Department of Justice’s efforts not only to combat the illegal distribution of heroin, fentanyl, and prescription opioids but also to help communities fund treatment.
- Housing. The Department of Housing and Urban Development (HUD) received increased resources to provide more than 50,000 additional people with disabilities, veterans experiencing homelessness, and others with Housing Choice Vouchers, which help low-income individuals and families afford modest private apartments. Even with these added vouchers, the program will continue to serve only about 1 in 4 eligible households because of inadequate funding. HUD also received increased resources to enable housing agencies to make needed repairs and upgrades in public housing developments, and to bolster rental aid for individuals and families experiencing homelessness.
- Environmental Protection: Overall funding for the EPA increased in 2018 by $763 million, or 9.5 percent, compared to its 2017 level (before adjusting for inflation), with most of the increase coming in state and tribal assistance grants, which provide resources to help communities pay for sewage and wastewater treatment, watershed management, other water clean-up projects, and drinking water treatment facility upgrades.
- Veterans’ Health Care: Funding for VA medical care and research increased by $5.1 billion in 2018 compared to 2017 (before adjusting for inflation). The 2018 appropriations legislation also increased funding for deferred Veterans Affairs health infrastructure improvements by $2 billion: $1 billion for medical facility improvements, $575 million for the construction of state extended care facilities, and $425 million to fund minor construction projects.
In some areas, such as child care, efforts to address the opioid crisis, and new investments in VA facilities, negotiators agreed to increase funding as part of the budget agreement discussions, before the Appropriations Committees crafted the actual funding legislation. This “pre-negotiation” was done to ensure that key priority areas received additional funding as part of an overall agreement to raise funding levels.
But Many Areas Remain Underfunded
Despite these and other new investments, significant areas of unmet non-defense needs remain. A budget agreement that provides resources for new investments can help close some gaps. For example:
- As noted, even with the large increase in child care funding provided in 2018, inadequate funding still means that only roughly 1 in 6 low-income children eligible for child care assistance receives it, leaving millions of low-income working families struggling to afford quality child care while parents work.
-
As also noted, because of inadequate funding, only about 1 in 4 eligible low-income households receive rental assistance — either through subsidies that help them afford modest, private housing or through public housing programs.[6] The combination of inadequate housing assistance, a lack of affordable rental units and rising rents in many areas, and high poverty, the number of households facing “worst case housing needs” — that is, the number of households who pay more than half their incomes for rent or live in very substandard housing, increased by 66 percent over the 2001-2015 period.
And, while recent appropriations have enabled public housing agencies to meet more of their facility upgrade and maintenance needs, a backlog of more than $26 billion in capital repairs must still be addressed to preserve this important stock of affordable housing.[7]
- While funding for the National Park Service in 2018 was $270 million above the 2017 level (before adjusting for inflation), as of the end of fiscal year 2017, deferred maintenance totaled $11.6 billion by the Park Service’s own accounting.[8]
- The main job training grants through the Workforce Investment and Opportunity Act received an additional $80 million in 2018 compared to the 2017 level (before adjusting for inflation), but this left funding for job training 18 percent below the level in 2010 after adjusting for inflation.
- Pell Grants, which help low- and moderate-income students pay for college, received modest increases for academic years 2018 and 2019. However, the maximum Pell Grant in 2019 covers just 28 percent of the cost of an in-state public four-year college — compared to 79 percent in 1975. [9]
- Congress and the President enacted the SUPPORT for Patients and Communities Act in October 2018 to address the continuing opioid epidemic. Congress funded some of the new efforts in 2019, but the legislation called for approximately $285 million in new annual investments that need to be funded starting in 2020. This funding would be directed to activities such as employment training for people with substance use disorders, new opioid-specific recovery centers, trauma support services for children and youth, and services to improve family recovery and reunification.
Next Deal Should Fund Continued Investment, Address Pressing Needs
Following the seven years of disinvestment in key non-defense areas, more resources are needed to continue the progress that’s being made in addressing important unmet needs as a result of the last budget deal. Moreover, a new deal for fiscal years 2020 and 2021 must account for several areas that require significant additional resources in 2020 — including the 2020 decennial census and veterans’ health care — so Congress isn’t faced with failing to meet these obligations or meeting them by cutting other areas.
2020 Census
The Constitution requires the federal government to conduct an enumeration every decade. Funding for the Census Bureau is significantly higher in the year that the enumeration takes place, and 2020 is such a year. In 2020, the Census Bureau will likely need at least $8 billion (for both the decennial Census and the other annual surveys it conducts), about $4 billion more than it received in 2019. This large increase comes from the cost of implementing the decennial census, which requires hiring and training 300,000 enumerators and supervisors, opening field offices, conducting a vigorous outreach campaign to improve response rates, going door-to-door to elicit information from unresponsive households, and processing responses.[10]
Veterans’ Health Care and the Mission Act
In June 2018, Congress enacted the Mission Act, which expands access to community-provided health services (that is, health services provided outside the VA delivery system) for veterans. The Act consolidates several programs and funds the health care with discretionary resources, even though some of these services were previously funded with mandatory funds, which don’t count against the discretionary funding caps. In addition, the cost of the standard VA health care programs rises each year based on medical inflation as well as changes in service demand. In each of the past 13 years, funding for the VA health programs has increased by between $1.5 billion and $7.4 billion per year.
The VA will need an additional $10 billion in 2020, compared to the 2019 funding level, to meet the needs of the new Mission Act as well as rising costs in the base veterans’ health care programs. In 2021 VA funding will need to be an estimated $17 billion above the 2019 level.[11]
Agreement Should Include an IRS Program Integrity Cap Adjustment
When Congress negotiates a new budget agreement, it should include a Trump Administration proposal to improve the enforcement of the nation’s tax laws by adding IRS enforcement funding that doesn’t count against the annual cap on overall funding for non-defense appropriations. There is a lengthy bipartisan history of exempting from the cap certain types of program integrity funding — to reduce errors, overpayments, and fraud in government programs and taxes — that the Office of Management and Budget (OMB) estimates will produce net savings.a That approach to IRS enforcement funding is especially timely now, given the IRS enforcement division’s depleted personnel and its coming workload increase under the tax law enacted at the end of 2017.
The President’s 2019 budget proposed an increase for IRS enforcement of $362 million in 2019 (and roughly $15 billion over ten years) that wouldn’t count against the caps. The Congressional Budget Office’s (CBO) recent report on deficit-reduction options includes a similar, though somewhat more robust, option of providing $500 million the first year and $20 billion over ten years in new enforcement funds, which CBO estimates would produce significant net savings.
This Administration proposal recognizes that because tax enforcement raises significantly more money than it costs, it makes sense to exempt some enforcement funding from the caps. CBO estimates that once staff training and computer upgrades are completed, each $1 of additional enforcement funding would generate $5.20 in additional revenue. Moreover, the Treasury Department notes that this return on investment likely is understated because it includes only the amounts directly recovered; it does not reflect the effect that enhanced enforcement has on deterring non-compliance. OMB has written that this deterrence could triple the rate of return on each additional dollar invested in IRS enforcement.
The precedent for this approach to IRS enforcement funding dates to the 1990 Budget Enforcement Act, enacted under President George H.W. Bush, which included an increase in the cap for certain IRS compliance activities (which has the same effect as exempting the increase from the cap). And, there is a longstanding cap adjustment in place for funding certain program-integrity activities in the Social Security Administration and the Department of Health and Human Services to reduce overpayments in Social Security and Medicare.
Such a mechanism is urgently needed for IRS activities to reduce tax non-compliance. Overall IRS enforcement funding has been cut by 25 percent since 2010, after adjusting for inflation, and the enforcement division has lost roughly 30 percent of its workforce over that period. The cuts have driven a more-than-40-percent-decline in the rate of audits, especially for high-income individuals and large corporations. Moreover, enforcement needs have grown as a result of the 2017 tax law. The new tax law’s design will invite taxpayers, particularly affluent ones and corporations with means to hire high-priced accountants and lawyers, to re-characterize their financial affairs for tax purposes (for example, to qualify for the 2017 law’s new “pass-through income” deduction), aggressively pushing against the boundaries of the new law. IRS enforcement must be able to identify those who step over the boundaries.
The IRS needs enough well-trained personnel to maintain the tax system’s integrity. Congress should provide the agency with the funds it needs to do its job, and a cap adjustment is a good way to bolster resources for the IRS while recognizing the budgetary savings that improved enforcement brings.
a For OMB’s calculation of net savings derived from the proposed IRS cap adjustment, see Office of Management and Budget, FY17 Analytical Perspectives Table 10-2, p.110, https://www.whitehouse.gov/wp-content/uploads/2018/02/ap_10_process-fy2019.pdf.
Deal Needed Even if It Can’t Be Fully Offset
Congress and the President will negotiate in coming months over the discretionary funding levels for fiscal years 2020 and 2021, the last years for which the BCA established funding caps on discretionary programs. If the deal doesn’t set new caps on discretionary funding for years after 2021, then CBO will project that the negotiated 2021 level will continue, adjusted for inflation, over the rest of the coming decade. Future Congresses and Presidents, however, will determine the levels of discretionary funding in the years after 2021. Accordingly, it would be prudent for Congress and the President to focus on the cost of boosting discretionary funding over the next two years, as was the case for the previous two-year deals.
Ideally, these costs would be offset largely with responsible revenue increases as well as some selected mandatory savings. But our discretionary investment needs shouldn’t be shortchanged if congressional Republicans and the President continue to refuse to consider raising revenues.
There is virtually no chance of fully offsetting an adequate budget deal without a revenue contribution. Some 85 percent of mandatory spending is in Social Security, Medicare, Medicaid, the Children’s Health Insurance Program, and the Affordable Care Act’s premium tax credits. While there surely are reasonable savings to be secured in the health arena, those savings will be needed to help expand access to health coverage for the 30 million Americans who still lack insurance. Outside of Social Security and health, much of the rest of mandatory spending is for basic assistance to low-income individuals and households, such as SNAP (formerly known as food stamps) and the Earned Income Tax Credit, where cuts would lead to increases in poverty and hardship.
Policymakers should be discussing the appropriate levels of both spending and revenues. We face predictable cost pressures due to the aging of the population and rising health care costs (though the ACA’s cost-containment measures have helped slow that increase). Despite these cost pressures, Congress cut taxes in 2017 rather than responsibly raising revenues. As a result, revenues are now at historic lows as a percent of GDP for this point in an economic expansion: 16.5 percent of GDP compared to the 18.4 percent historical average when the economy is performing at or near its potential. Typically, when the economy is strong and unemployment is low, revenues as a share of GDP are higher than during down economies; this allows deficits to fall during good economic times and provides opportunities for targeted tax cuts during recessions as a form of fiscal stimulus.
Some prominent mainstream economists have recently refined their thinking on the impact of debt on the U.S. economy in recognition of the continued low interest rates and hence in the cost of borrowing that the nation faces, a consequence of which is that the risk of an economic or financial crisis due to higher deficits and debt is considerably lower than when interest rates were higher. That does not mean there are no downsides to higher levels of debt, especially debt levels that rise steadily and substantially for decades to come. But as economists Jason Furman and Larry Summers recently wrote, the risk of a debt crisis is often exaggerated: “Some commentators worry that rising deficits don’t just slowly eat away at economic growth, as the textbooks warn; they could lead to a fiscal crisis in which the United States loses access to credit markets, sparking an economic meltdown. There is precious little economic theory or historical evidence to justify this fear.”[12]
Given the need for adequate NDD resources and the lack of significant economic risk from modestly (as opposed to dramatically) higher levels of debt, a two-year deal should be struck, even if it cannot be fully paid for. Then in the near future, when more balanced fiscal discussions are possible, responsible discussions about appropriate levels of revenues and spending and how to achieve them should take place.
Appendix:
The Budget Control Act of 2011: Caps, Sequestration, and Subsequent Bipartisan Deals
The Budget Control Act of 2011 (BCA) established fixed dollar limits — caps — on funding for discretionary programs, with sub-caps on defense and on all other discretionary programs; the latter category is known as “non-defense discretionary” programs, or NDD.[13] The caps cover the ten-year period of 2012-2021.
| TABLE 1 | ||||||||
|---|---|---|---|---|---|---|---|---|
| Discretionary caps, sequestration, and relief, 2014-2021 | ||||||||
| dollars in billions | ||||||||
| 2014 | 2015 | 2016 | 2017 | 2018 | 2019 | 2020 | 2021 | |
| Discretionary caps before sequestration: | ||||||||
| Defense | 552.0 | 566.0 | 577.0 | 590.0 | 603.0 | 616.0 | 630.0 | 644.0 |
| Non-defense (NDD) | 506.0 | 520.0 | 530.0 | 541.0 | 553.0 | 566.0 | 578.0 | 590.0 |
| Sequestration: | ||||||||
| All programs | ||||||||
| Defense | -54.7 | -54.7 | -54.7 | -54.7 | -54.7 | -54.7 | -54.7 | -54.7 |
| Non-defense (NDD) | -54.7 | -54.7 | -54.7 | -54.7 | -54.7 | -54.7 | -54.7 | -54.7 |
| Mandatory programs | ||||||||
| Defense | -0.7 | -0.7 | -0.8 | -0.7 | -0.7 | -0.8 | -0.8 | -0.8 |
| Non-defense (NDD) | -18.1 | -17.2 | -18.2 | -18.0 | -17.4 | -19.0 | -18.7 | -19.2 |
| Discretionary programs | ||||||||
| Defense | -53.9 | -54.0 | -53.9 | -53.9 | -53.9 | -53.9 | -53.8 | -53.8 |
| Non-defense (NDD) | -36.6 | -37.4 | -36.5 | -36.7 | -37.3 | -35.7 | -35.9 | -35.4 |
| Post-sequestration caps: | ||||||||
| Defense | 498.1 | 512.0 | 523.1 | 536.1 | 549.1 | 562.1 | 576.2 | 590.2 |
| Non-defense (NDD) | 469.4 | 483.1 | 493.5 | 503.5 | 515.7 | 530.3 | 542.1 | 554.6 |
| Relief from discretionary sequestration a (100% in 2018 and 2019): | ||||||||
| Defense | 22.4 | 9.2 | 25.0 | 15.0 | 53.9 | 53.9 | 0.0 | 0.0 |
| Non-defense (NDD) | 22.4 | 9.2 | 25.0 | 15.0 | 37.3 | 35.7 | 0.0 | 0.0 |
| Additional discretionary investments: | ||||||||
| Defense | 26.0 | 31.0 | 0.0 | 0.0 | ||||
| Non-defense (NDD) | 26.0 | 31.0 | 0.0 | 0.0 | ||||
| Total funding above post-sequestration caps: | ||||||||
| Defense | 22.4 | 9.2 | 25.0 | 15.0 | 79.9 | 84.9 | 0.0 | 0.0 |
| Non-defense (NDD) | 22.4 | 9.2 | 25.0 | 15.0 | 63.3 | 66.7 | 0.0 | 0.0 |
| Resulting caps as of February 2019: b | ||||||||
| Defense | 520.5 | 521.3 | 548.1 | 551.1 | 629.0 | 647.0 | 576.2 | 590.2 |
| Non-defense (NDD) | 491.8 | 492.4 | 518.5 | 518.5 | 579.0 | 597.0 | 542.1 | 554.6 |
The BCA also created a temporary joint select committee of Congress (known at the time as the “supercommittee”) and charged it with drafting legislation in the fall of 2011 to reduce the deficit by $1.2 trillion over ten years. And, to push committee members to compromise, the BCA further provided that if the committee failed to reach an agreement, that shortfall would be covered by “sequestration.” Sequestration would, among other things, automatically cut equal dollar amounts from defense and non-defense programs; in 2014-2021, those cuts would be achieved by reducing the defense and NDD caps and also by directly cutting all mandatory programs that were not exempted from those cuts. Because Congress did not pass legislation achieving the required level of deficit reduction, the sequestration provisions of the BCA were triggered.
The top panel in the table above shows the pre-sequestration defense and NDD caps. The next panel shows the total amount of sequestration cuts called for under the BCA and how much of those sequestration cuts would be achieved through mandatory cuts and how much through reductions in the discretionary caps.
As the table shows, sequestration would reduce defense and non-defense programs each by $54.7 billion per year. The size of the mandatory defense cuts is quite small, while the mandatory non-defense cuts are much larger. That’s because almost all non-exempt mandatory programs are domestic. To achieve equal overall savings from the defense and non-defense sequestrations, the discretionary cuts in the defense caps must therefore be correspondingly larger than the cuts in the NDD caps.
The third, fourth, and fifth panels show the amounts that the three most recent bipartisan deals restored to defense and NDD funding, relative to the post-sequestration caps. Those three deals covered 2014-2015, then 2016-2017, and most recently 2018-2019. The blue highlighting shows that the dollar additions to defense and NDD caps were equal under the first two deals; some use the term “parity” to refer to this fact. The yellow highlighting shows that, as part of the deal for 2018 and 2019, the defense and NDD discretionary sequestrations were cancelled entirely. The orange highlighting shows that the 2018-2019 deal also provided equal amounts of funding above the pre-sequestration caps to defense and non-defense discretionary programs. Note, however, that while the discretionary sequestration cuts were cancelled entirely for both defense and non-defense programs, the mandatory sequestration cuts — which fall disproportionately on non-defense programs — remained in place over this period and have been extended through 2027.
The final panel shows the resulting caps — as they have actually applied in each year since 2014. The current caps for 2020 and 2021 are far below the actual appropriations for 2019.[14] And, absent another deal, the scheduled cuts in 2020 and 2021 will be even larger when inflation and population growth are taken into account. Further, as discussed in the main body of this report, there are special needs for 2020 funding, such as for the 2020 census and the Mission Act governing veterans’ health care.
End Notes
[1] The budget agreement covering fiscal years 2018 and 2019 reversed the sequestration cuts on both defense and non-defense discretionary programs and then added equal amounts of new investment to defense and non-defense areas. This led to a modestly larger amount of additional defense funding compared to non-defense funding, because the discretionary sequestration cuts were larger in defense than non-defense. That’s because the non-defense part of the budget had larger sequestration cuts than defense did in mandatory programs; those mandatory cuts were not eliminated by the deal and, in fact, were extended for two more years. Total sequestration cuts — discretionary and mandatory — were equally divided between defense and non-defense programs under the BCA. (These issues are explored in more depth in the Appendix.)
[2] Note that these cuts would come in what is referred to as the “base defense budget,” which is distinct from “overseas contingency operations” (OCO) funding, which is not counted against the caps. OCO funding is supposed to be limited to costs associated with overseas military engagements, but some OCO funding has been used in the past to supplement the base defense budget. The Administration has indicated that it may call for an unprecedent increase in defense OCO in its 2020 budget as a way to circumvent the caps, and increase base defense funding without raising the funding cap and without providing comparable relief for non-defense discretionary programs. Russ Vought, “Congress Must Join the President in Cutting Spending,” RealClearPolitics, February 25, 2019, https://www.realclearpolitics.com/2019/02/25/congress_must_join_the_president_in_cutting_spending_467177.html.
[3] The $400 billion figure is expressed in today’s dollars; that is, the inflation adjustment converts funding for each year from 2010 through 2017 into 2019 dollars. To enhance comparability, we adjusted the 2010-2017 data to remove three items that were different in 2010 than in subsequent years: funding for the 2010 decennial census; income earned by the Federal Housing Administration and Government National Mortgage Association; and Changes in Mandatory Programs, or CHIMPs (a CHIMP is a provision in an appropriations bill that cuts a mandatory program — often in a way that does not affect benefits or services or overall spending — and is therefore credited as discretionary savings). If we had not removed these three types of transactions, the seven-year, inflation-adjusted cuts below the 2010 level would have totaled more than $600 billion.
[4] Based on the U.S. Census Bureau’s Public Elementary-Secondary Education Finance Data and enrollment estimates from the National Center for Education Statistics, 24 states were still providing less in state and local funding per student, after adjusting for inflation, in the 2016 school year than in 2008. (See Michael Leachman, “New Census Data Show Persistent State School Funding Cuts,” Center on Budget and Policy Priorities, May 22, 2018, https://www.cbpp.org/blog/new-census-data-show-persistent-state-school-funding-cuts.) Since the economy continued to improve in the 2017 school year, it’s likely the number of states providing less than pre-recession levels has continued to decline gradually, leaving about 20 states still below pre-recession levels. This decline is further suggested by our analysis of trends in state “formula” funding — the primary form of state funding for schools — which found that 23 states were still providing less formula funding per student, after adjusting for inflation, in 2017 than in 2008. See Figure 4 in Michael Leachman, Kathleen Masterson, and Marlana Wallace, “After Nearly a Decade, School Investments Still Way Down in Some States,” Center on Budget and Policy Priorities, October 20, 2016, https://www.cbpp.org/research/state-budget-and-tax/after-nearly-a-decade-school-investments-still-way-down-in-some-states.
[5] National Center for Education Statistics, “Estimated average annual salary of teachers in public elementary schools, by state: Selected years, 1969-70 through 2015-16,” Table 211.60, https://nces.ed.gov/programs/digest/d17/tables/dt17_211.60.asp.
[6] Center on Budget and Policy Priorities, “Three Out of Four Low-Income At-Risk Renters Do Not Receive Federal Rental Assistance,” updated August 2017, https://www.cbpp.org/three-out-of-four-low-income-at-risk-renters-do-not-receive-federal-rental-assistance.
[7] U.S. Department of Housing and Urban Development, Capital Needs in the Public Housing Program, 2010, https://www.hud.gov/sites/documents/PH_CAPITAL_NEEDS.PDF.
[8] National Park Service, “What Is Deferred Maintenance?” https://www.nps.gov/subjects/infrastructure/deferred-maintenance.htm.
[9] The calculation is based on college pricing data from the College Board, and it assumes that college costs in 2019-2020 rise at the same annual rate as in 2018-2019.
[10] p.CEN-85 of Congressional Justification for FY19 Census Bureau budget, https://www2.census.gov/about/budget/FY-2019-Congressional-Budget-Submission.pdf. Same figure appears in FY18 CJ, p.CEN-85.
[11] In a December 2018 analysis, CBO found that costs of veterans’ medical care would generally need to grow by about $6 billion per year over the coming decade to maintain current health care policies. The implementation of the new Mission Act leads to a larger jump in 2020 but also increases the needed growth between 2020 and 2021 by more than $1 billion, to $7 billion.
[12] Jason Furman and Lawrence H. Summers, “Who’s Afraid of Budget Deficits? How Washington Should End Its Debt Obsession,” Foreign Affairs, March/April 2019, https://www.foreignaffairs.com/articles/2019-01-27/whos-afraid-budget-deficits.
[13] “Discretionary” is a technical term meaning that the cost of a program is within the legal discretion of the House and Senate Appropriations Committees rather than being determined by other committees or by benefit formulas and eligibility criteria. Thus, “discretionary” does not mean that the funding level for all of these programs is entirely at the discretion of the President or agency personnel; nor does it imply that the programs involved are optional or less important.
[14] The Congressional Budget Office has verified that the actual appropriations for 2019 exactly equaled the defense and NDD caps, though the Office of Management and Budget has not yet issued its estimates, which could be slightly different.
More from the Authors

Areas of Expertise