| |
 |
September 1, 2006 |
WHOSE RECOVERY?
Labor Day 2006 Finds Many Americans Not Sharing in the Growing Economy
 Download these Policy Points in PDF Download these Policy Points in PDF
Government data issued this week — from the Census Bureau on poverty, incomes, and health coverage and from the Commerce Department on the shares of national income going to workers and corporations — provide fresh evidence that many middle- and lower-income Americans are not sharing in the gains of the economic recovery.
When these disappointing findings for 2005 are considered in conjunction with the results for the previous years, the result is the worst performance for a period of economic recovery since the Census Bureau began collecting income and poverty data.
For the first time on record, poverty was higher — and median income for non-elderly households was lower— in the fourth year of an economic recovery than when the recovery began.
-
The poverty rate remained unchanged in 2005, an unusual development for an economic recovery year. And at 12.6 percent, the poverty rate for 2005 remained well above its 11.7 percent rate in the recession year of 2001. In all other business cycles for which data are available, over the last 45 years, poverty has been lower four years into the recovery than in the last recession year.
-
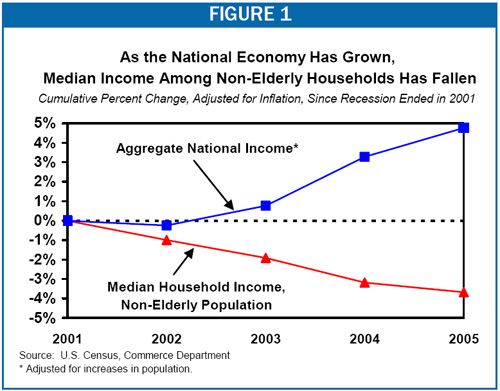
While overall median income rose in 2005, this increase was driven by a rise in income among elderly households. Median income for the typical non-elderly household declined in 2005 for the fifth consecutive year and now stands $2,000 below its 2001 level. Since 2001, the economy has grown by 5 percent, after adjusting for inflation and increases in the population, but median household income among the non-elderly population has declined 4 percent (Figure 1).
-
The amount by which the average poor person fell below the poverty line in 2005 — $3,236 — remained the highest on record, with data going back to 1975. So did the share of the poor (43 percent) who experienced severe poverty — that is, whose cash incomes fell below half of the poverty line. (Half of the poverty line in 2005 was $7,788 for a family of three.)
The number of uninsured Americans has reached an all-time high of 46.6 million.
|
TABLE 1:
NUMBER AND PERCENTAGE OF AMERICANS WITHOUT HEALTH COVERAGE |
|
Year |
Number |
Percent |
|
2005 |
46.6 million |
15.9% |
|
2004 |
45.3 million |
15.6% |
|
2003 |
45.0 million |
15.6% |
|
2002 |
43.6 million |
15.2% |
|
2001 |
41.2 million |
14.6% |
In the first half of 2006, the share of national income going to wages and salaries was the lowest on record, while the share going to corporate profits was the highest since 1950.
-
This recovery is the first one on record in which corporate profits have captured a larger share of the total growth in national income during the recovery than have wages and salaries. During the recovery as a whole, corporate profits have grown nearly twice as fast as in previous post-World War II recoveries, while wages and salaries have grown much more slowly than normal (Table 2).
|
TABLE 2:
AVERAGE ANNUAL INCREASE IN WAGES/SALARIES AND CORPORATE PROFITS |
|
|
Current Recovery |
Average for Post-WWII Recoveries |
|
Wages and salaries |
2.0% |
3.6% |
|
Corporate profits |
14.1% |
7.5% |
-
The effect of these trends is that in the first half of 2006, the share of national income going to wages and salaries was smaller than in any of the 76 previous years for which data are available, while the share of national income going to corporate profits was the largest since 1950.
-
Some have argued that wages and salaries have grown slowly in this recovery only because the costs of other forms of employee compensation, such as employer-provided health care, have grown rapidly. The Commerce Department data show, however, that while total employee compensation has grown somewhat more rapidly than wages and salaries, its growth has been well below average as well.
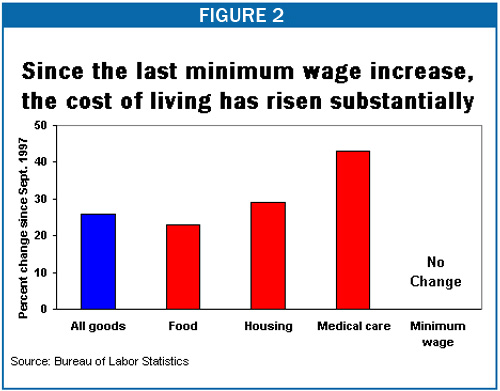
The minimum wage has not been changed in nine years and now is at its lowest real value in half a century.
-
As of September 1, the minimum wage will have remained at the same level ($5.15) for nine years, during which the cost of living has risen by 26 percent (Table 2). After adjusting for inflation, the value of the minimum wage is at its lowest level since 1955.
-
This summer the House adopted legislation that links an increase in the minimum wage with a dramatic reduction in the estate tax. The Senate rejected this linkage once but may vote on it again in September. Given that incomes are rising much faster at the top of the income scale than the bottom, and given that Congress has reduced estate tax burdens in eight of the past nine years even as the minimum wage has remained frozen, there is no justification for holding a minimum wage increase hostage to further reductions in the estate tax.
# # #
The Center on Budget and Policy Priorities is a nonprofit, nonpartisan research organization and policy institute that conducts research and analysis on a range of government policies and programs. It is supported primarily by foundation grants.

|
|