BEYOND THE NUMBERS
Mapping Disability Receipt
Disability programs are in the news due to the controversy over replenishing Social Security’s Disability Insurance (DI) trust fund. While people who receive disability payments from DI or Supplemental Security Income (SSI) live in every state, county, and congressional district, some areas have much higher rates of disability receipt than others — a fact that critics sometimes cite as evidence of problems with the programs. In reality, this “geography of disability” mostly reflects a few key demographic and economic factors, as our new paper explains.
States with high rates of disability receipt — especially in the South and Appalachia, and (less dramatically) in parts of New England and the Great Lakes region — tend to have populations that are less educated, older, and more blue-collar than other states, and to have fewer immigrants. In contrast, states along the Washington-to-Boston corridor, on the West Coast, and in the Great Plains and Mountain West have relatively few disability beneficiaries.
Here’s briefly why those patterns make sense (see our paper for details):
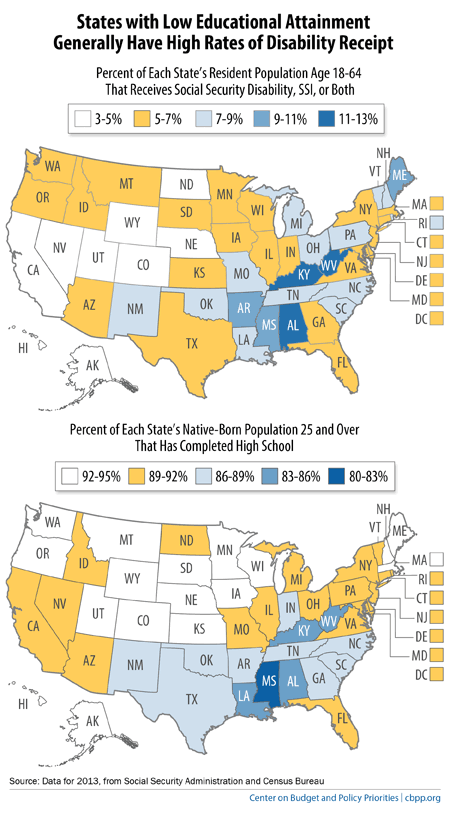
- A less-educated workforce. This is by far the most powerful factor; states with low rates of high-school completion, chiefly in the South and Appalachia, generally have high rates of disability receipt (see map). That’s not surprising. The law requires applicants for disability benefits to show not just that they can’t do their past work anymore, but that they can’t realistically switch to other, less demanding work. That adjustment is harder, or even impossible, for severely impaired people with little education.
- An older workforce. The risk of disability rises sharply with age. New England and Appalachia have higher median ages than most of the rest of the country, which boosts their rates of disability receipt compared with the “young” West.
- Fewer immigrants. Immigrants, especially recent arrivals, are far less likely than native-born citizens to collect disability benefits. That’s largely because of program rules that make it harder for immigrants to qualify. There’s also some evidence that immigrants are healthier than their U.S.-born counterparts, although that advantage shrinks with age. States with large foreign-born populations, like California and New York, tend to have fewer disability recipients than we’d expect based solely on their age and educational characteristics.
- Industry-based economy. States where much of the workforce is employed in forestry, some types of mining, utilities, construction, and manufacturing — such as the industrial Midwest and many southern and Appalachian states — tend to have more disability recipients than states with more service-oriented economies, all else being equal. Such jobs are often physically demanding and involve skills that don’t transfer readily to other, less arduous types of work.
Examining the geographic pattern of disability receipt gives a valuable perspective on how these programs, even with their strict eligibility rules and modest benefits, protect some of the nation’s most vulnerable people. Policymakers should bear these facts in mind as they deal with the need to replenish DI’s finances by 2016.