The Need for Productivity-Enhancing Public Investments
Testimony of Jared Bernstein, Senior Fellow,
Before the House Budget Committee
I thank the committee for the invitation to speak to you today. The purpose of my testimony is to a) provide you with an assessment of strengths and weaknesses of the current U.S. economy, b) offer thoughts about policies that can boost the strengths and reduce the weak spots, and c) examine near- and longer-term fiscal constraints in this context.
Current Economic Conditions
The U.S. economy is in the seventh year of a recovery that began in the second half of 2009, meaning we’re in the midst of a relatively long expansion. Since 1960, economic expansions have lasted five years on average. Since 1980, they’ve lasted six years on average.
Countercyclical policies of the Federal Reserve and the federal government (the Recovery Act) were instrumental in helping to pull the economy out of the Great Recession. In a recent review of the impact of these measures, economists Alan Blinder and Mark Zandi write that the spate of fiscal, monetary, and financial interventions “…dramatically reduced the severity and length of the meltdown that began in 2008; its effects on jobs, unemployment, and budget deficits; and its lasting impact on today’s economy.”[1] Along with tax relief and countercyclical anti-poverty interventions, the Recovery Act invested $48 billion in over 14,000 projects repairing highways, transit systems, bridges, and airports.
Businesses began adding jobs on net in late 2010 and since then, private sector employment is up 15.1 million jobs, the longest streak of total job growth on record. The unemployment rate has fallen by half since then, from about 10 to about 5 percent.
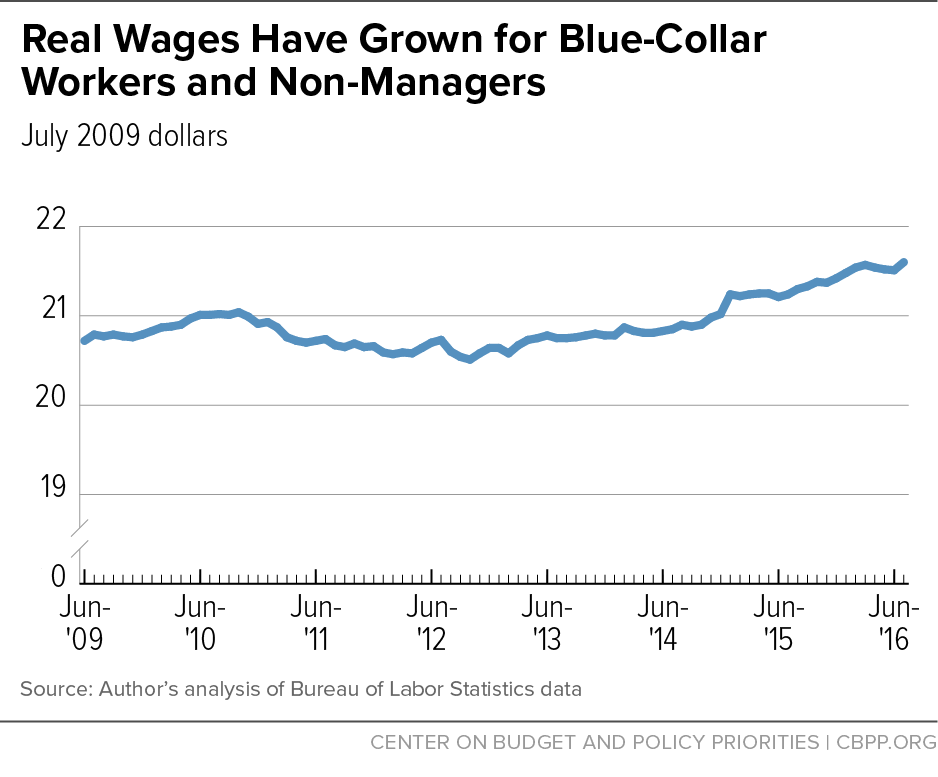
The tightening job market has meant faster wage growth, and not just for high-wage workers, but for middle- and low-wage workers as well. The real wage of blue-collar workers in manufacturing and non-managers in services is up 5 percent since its recent trough in late 2012 (see Figure 1). Pay is rising for the lowest-wage workers as well,[2] due both to competition for labor and to state- and city-level minimum wage increases. Economist Elise Gould of the Economic Policy Institute finds a 3.8 percent real gain for the hourly wages of workers at the 20th percentile of the wage scale between the first half of last year and this year,[3] the largest increase of any decile. Gould attributes this in part to the aforementioned minimum wage increases.
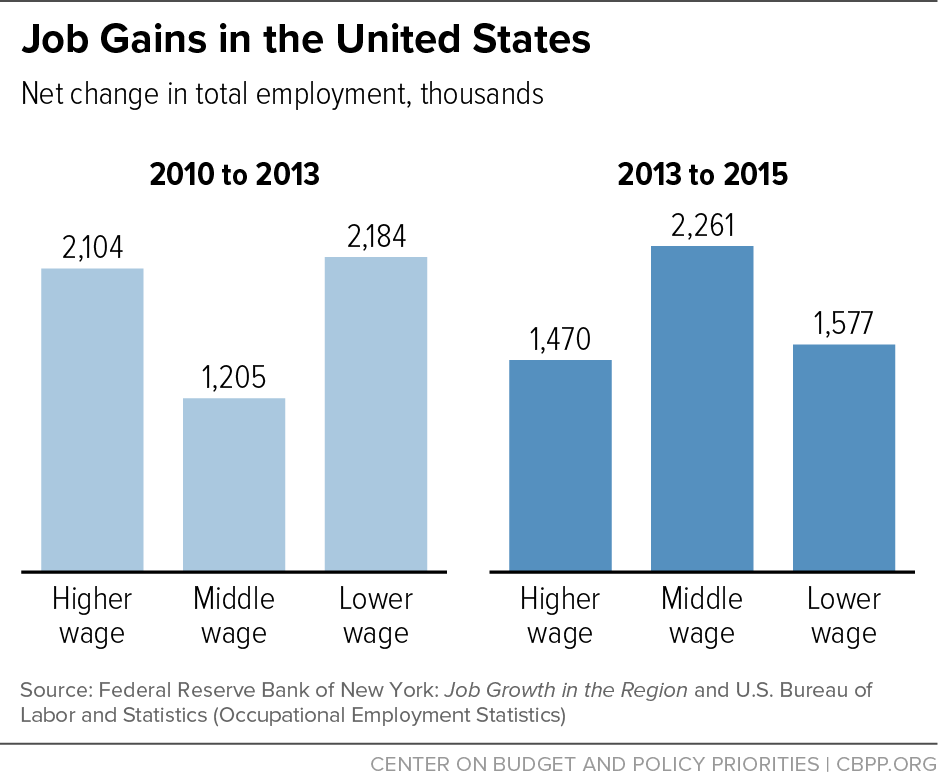
Recent analysis by the New York Federal Reserve finds an important shift in job quality towards middle-class jobs as the labor market recovery has progressed.[4] Figure 2 below shows that while growth in middle-skill jobs (jobs in transportation, construction, administrative support, social and protective services, installation and repair, production, and education) was relatively weak earlier in the expansion relative to job growth in low- and high-wage occupations, since 2013 job growth in this middle category has been the strongest.
The combination of solid, more balanced employment growth, hourly wage growth, and low inflation is boosting incomes and aggregate consumer spending. From 2012-14, aggregate weekly earnings (private employment * average weekly hours * average hourly earnings), adjusted for inflation, grew 2.4 percent per year. Since then, aggregate weekly earnings are up 3.8 percent per year, an economically significant acceleration. The largest factor driving this increase is slower inflation, with faster nominal earnings as a secondary factor.
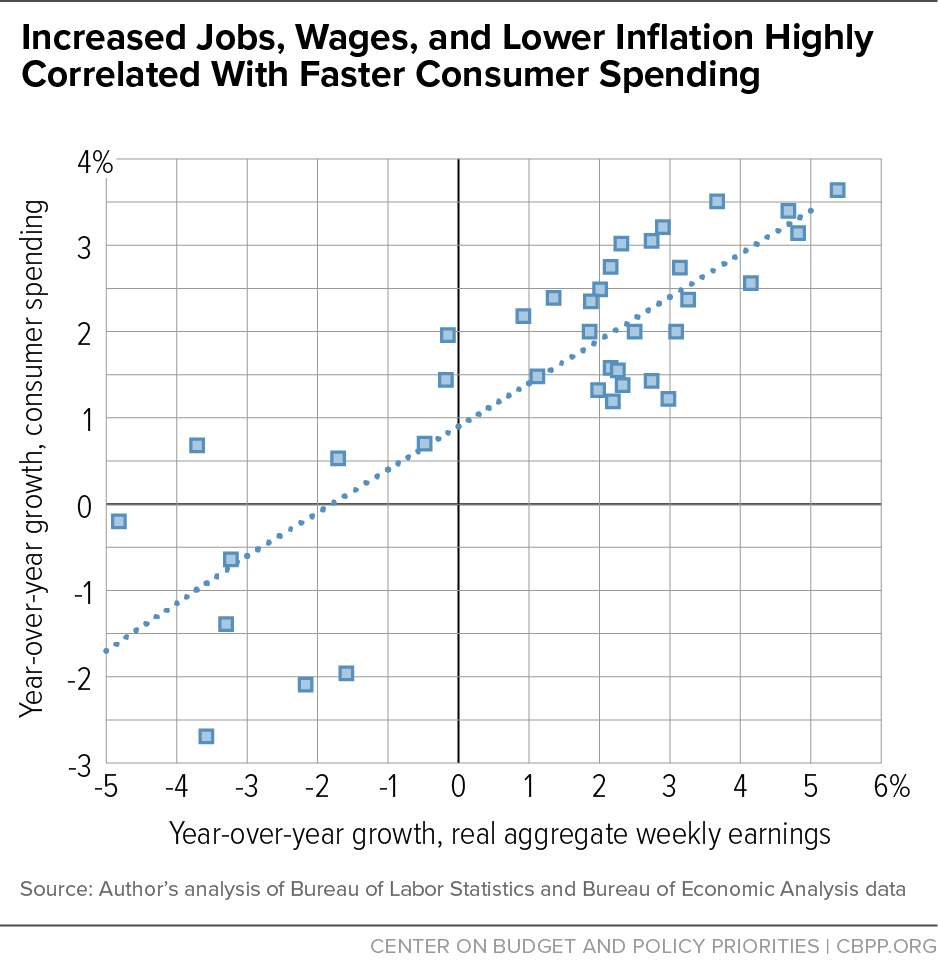
The scatterplot below (Figure 3) plots the year-over-year growth of real aggregate weekly earnings against that of real consumer spending. The best-fit line highlights the positive correlation: solid employment growth, the tightening job market, and low inflation are feeding back into growing consumer spending, which accounts for just under 70 percent of U.S. gross domestic product (GDP). Since 2014, this dynamic has boosted average annual growth of real consumer spending by a percentage point per year, from about 2 percent in the earlier part of the expansion to 3 percent more recently.
Though it took many years for the recovery to reach poor and middle-income households, Census data released the day before this hearing are expected to show significant declines in poverty and an increase in real median household income. The private firm Sentier Research estimates monthly data on real median household income, and it finds that after falling steeply in the recession, real median household income is up 9 percent from its June 2011 low. At about $57,000 in today’s dollars, that brings median household income back up to its pre-recession peak.
These positive trends in jobs, wages, and growth exist amidst numerous challenges in the current economy, many of which I know are of concern to members of the committee.
Though the U.S. economy is doing much better than most other advanced economies, real U.S. GDP growth has been slower in this recovery relative to prior recoveries. While economists do not have a full explanation for this slowdown, we have identified some important factors in play.
As baby boomers age out of the labor force, labor supply, a key growth input, has slowed. While the labor force participation rate is down about three percentage points since the recession, from around 66 percent to about 63 percent, analysts attribute two of those points to retiring workers aging out of the labor force.
The other “supply-side” growth factor, productivity growth, has also slowed. Between 1995 and 2005, productivity grew just under 3 percent per year. Since then, it has grown 1.2 percent annually. Like many economists, I view this to be our biggest challenge.
Unfortunately, economists have a poor track record forecasting or even convincingly explaining underlying changes in the rate of productivity growth, particularly “multifactor” productivity (mfp) growth, a more encompassing measure that accounts for not just labor inputs, but capital inputs as well. Between the 1950s and 2007, mfp contributed about 1 percent per year to overall productivity growth. Since then it has contributed half as much. As noted, economists are hard pressed to identify the factors behind this slowdown.
However, the mfp accounts do provide us with one important hint: for decades, capital investment (aka “capital deepening,” or capital per hour worked) also added about 1 percent to productivity growth. In recent years, it too is contributing less: 0.6 percent. Here is an aspect of productivity growth that policy may be able to address, a concern I return to below in the context of a potentially productivity-increasing public investment agenda.[5]
We are not at full employment. Though the unemployment rate is about equal to the natural rate estimates of both the Congressional Budget Office (CBO) and the Federal Reserve, other labor market indicators show that slack remains in the job market. The underemployment rate (which includes part-timers who’d rather have full-time jobs), at 9.7 percent, remains a point above what I’ve estimated[6] to be its full-employment rate, and the share of prime-age workers (25-54) with jobs — their employment-to-population ratio — remains below its pre-recession peak.
To be clear, these measures have all shown cyclical resilience. The employment rate of prime-age workers, for example, has made back two-thirds of its post-recession decline, and the underemployment rate is way down from its 17 percent peak in late 2009. But while we are closing in on full employment, some slack remains.
The recovery has been highly varied by region. Research by Danny Yagan shows that workers in areas that underwent particularly negative economic “shocks” in the Great Recession were still less likely to be employed in 2014 compared to those in places that were hit less hard by the downturn.[7] The Economic Innovation Group’s Distressed Community Index elaborates this theme with multiple indicators, including local business creation, poverty rates, and adult employment rates.[8]
As is so often the case, it is also true that this recovery is taking longer to reach disadvantaged groups of people. Unemployment for African American workers, for example, remains about twice that of whites and, importantly, this result holds when controlling for education levels.[9]
As noted above, middle- and low-wage workers have made recent gains. But over the long term, the increase in economic inequality has often led to stagnant or declining trends in wages, incomes, and wealth. For example, while I noted the increase in real earnings of production workers and non-managers, their real wage level is about where it stood in the late 1970s, despite a near doubling of productivity growth since then.
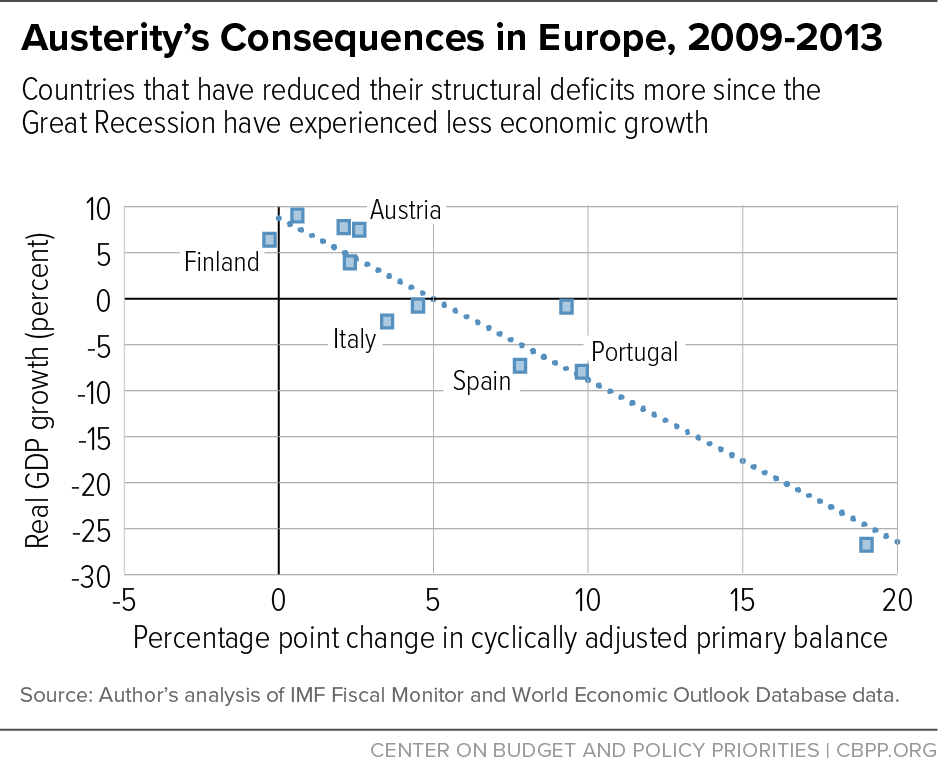
A final point in this section regards a policy mistake that many governments have made that has contributed to the results just described: the premature pivot to fiscal austerity. Figure 4 below shows real GDP growth in Eurozone countries between 2009 and 2013 plotted against the percentage point change in the cyclically adjusted primary balance as a share of GDP.[10] Countries that applied fiscal austerity — i.e., that tightened their fiscal stance while underlying growth was still weak — saw less real GDP growth than countries more willing to apply the shock absorber of temporary deficit spending.
One reason we’re now doing better than these economies is that U.S. fiscal policy responded aggressively to the Great Recession, as stressed by the Blinder/Zandi analysis cited above. Yet we too pivoted to austerity too soon, both with the premature sunsetting of a temporary paycheck booster (the “payroll tax holiday”) in 2013 and with spending cuts that year from sequestration. According to Goldman Sachs, that pivot cost the U.S. economy 1.6 percent of lost GDP in 2013 — over a million jobs lost based on historical relationships and about three-quarters of a point added to unemployment — at a time when the U.S. economy was still trying to recover from the residual pull of the Great Recession. In 2014, when fiscal impulse turned neutral, unemployment fell more quickly and job growth accelerated.
Interestingly, new analysis from researchers at Goldman Sachs shows the importance of a fiscal response to slow growth in general or the next recession in particular. Especially given constraints faced by the Federal Reserve (specifically, the low “Fed funds rate”), the GS analysis underscores the effectiveness of discretionary fiscal response — a temporary increase in deficit spending to offset the downturn — in reducing both the output gap (the gap between potential and actual GDP) and unemployment (they find discretionary spending to be more effective than the automatic stabilizers). The researchers conclude that their “…findings reinforce the argument of Fed officials that countercyclical fiscal policy could be a valuable complement to monetary policy.”[11]
This overview sets the stage for a discussion of the following policy agenda to ensure the continued improvements in areas of economic strength and to meet the challenges just discussed. The following section will then examine the fiscal policy constraints most germane to this committee.
The Need for and Benefits of Boosting Public Investment
Recent Congresses, including the current one, have been extremely reluctant to plan and execute public investments in needed areas. To be clear, this is a bipartisan complaint, one I hear regularly from the business community that depends on productivity-enhancing infrastructure. Often, certain politicians’ rhetoric suggests that any public spending targeted at the economy would simply crowd out private investment. But this view misunderstands the basic fact that, as I’ve argued before, “public spending should be made on goods and services that the private market will either not provide, for sound business reasons, or will not provide in optimal amounts.”[12]
Educational services, for example, would surely be under-provided and under-utilized if they were solely under the purview of the private sector. Similarly, since there is often no efficient mechanism for businesses to profit from investments in infrastructure in transportation, water systems, basic research, and more, the economy’s productive capacity and our citizens’ safety will be diminished if we fail to provide and maintain these investments.
Though there is certainly no evidentiary “smoking gun,” many economists suspect that the lack of such public investment is one reason productivity growth (and capital deepening) have slowed. In a recent presentation on these issues, Council of Economic Advisers chair Jason Furman argued that “in the absence of public investment, aggregate R&D investment (not only basic research but also applied research and experimental development) is bound to fall short of what is socially optimal.”[13] Furman cites research suggesting “that the socially optimal level of R&D investment — the amount that would produce the greatest rate of economic growth — is two to four times greater than actual spending,” noting that “this gap is particularly large for basic research, since its role as the ‘seed corn’ of future innovations means that it generates the largest spillovers.”
President Obama’s most recent budget is particularly strong in the area of public investment with attention to infrastructure, R&D, and innovation. The budget proposes direct investment in, among other areas, basic research, clean energy (the budget doubles current investment levels in clean energy R&D), transportation, water systems, flood, and drought resistance. These proposals are paid for by a tax on carbon (specifically, on oil), which has the added advantage of better reflecting the true social and environmental cost of fossil fuels.
The private sector will also underinvest in national defense, social insurance programs like Social Security, and health care, particularly for low- and middle-income families who often cannot afford to maintain coverage. The facts that hospitals must treat the sick regardless of their coverage status, while Medicaid and Medicare are well-established public coverage systems for the poor and elderly, put health care at least partially under the public goods umbrella. Given that reality and the actuarial benefits of pooling, the potential cost savings and administrative scale economies of a relatively large, public, non-profit system of health coverage suggest a robust role for public policy in this space (in fact, about half of health care spending is through public programs).
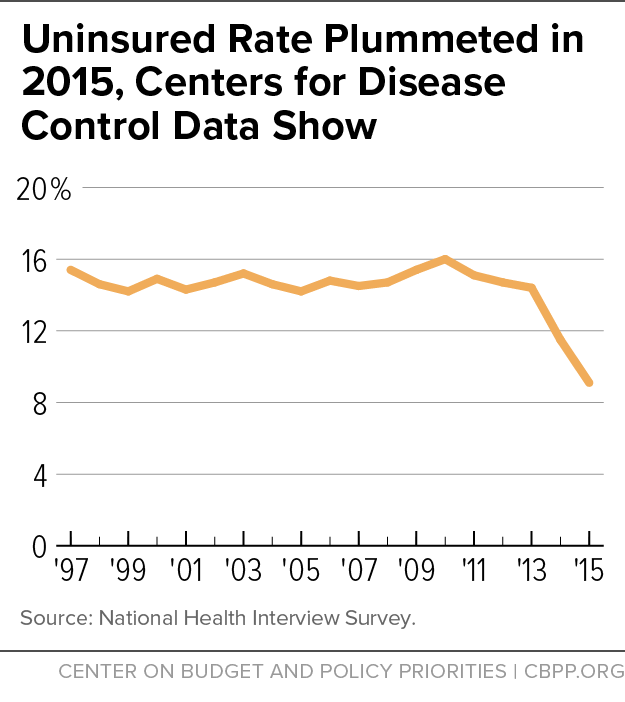
In this regard, the Affordable Care Act has been remarkably effective. Recent data from the Centers for Disease Control reveal that before the ACA was in effect, the uninsured rate was about 16 percent; in the first quarter of this year, they estimate that rate to be 8.6 percent, down by almost half. Figure 5 shows the striking trend reversal in this variable when the ACA went into effect.
As I will show below, health care reform is also associated with slower cost growth in the sector, an absolutely critical fiscal outcome.
While investments in physical capital and R&D are obviously important and needed, human capital investments can be even more beneficial to both productivity and the economic security of American families. Here too, the President’s budget makes necessary investments in both pre-school and college. While these two forms of human capital investment are at opposite ends of the education life-cycle, they’re both active sources of stress for American families. Extensive academic research has shown the lasting “bang-for-the-buck” regarding returns to investments in quality pre-school.[14] And college affordability is a growing challenge for low- and middle-income families, as well as for “millennials” financing their own higher education. The President’s “Preschool for All” program ensures access to high-quality preschool; the budget also proposed to strengthen and expand the Pell grant program to promote greater college affordability.
Another form of human capital investment already has considerable bipartisan support. Expanding the Earned Income Tax Credit for low-wage workers who aren’t raising children in the home, something both President Obama and Speaker Ryan have proposed, would incentivize work and potentially “help address some of the challenges that less-educated young people (particularly young African American men) face, including low and falling labor force participation rates, low marriage rates, and high incarceration rates.”[15] A proposal from Sen. Sherrod Brown and Rep. Richard Neal would help 16.2 million cashiers, cooks, retail salespersons, custodians, waitresses, child care workers, truck drivers, and other hard-working Americans.[16]
Fiscal Constraints and Opportunities
A responsible discussion of the need for the type of investments I suggest in the prior section requires an analysis of our fiscal situation, issues that are clearly germane to this committee.
Recent research[17] by my colleagues at the Center on Budget and Policy Priorities reveals the following:
-
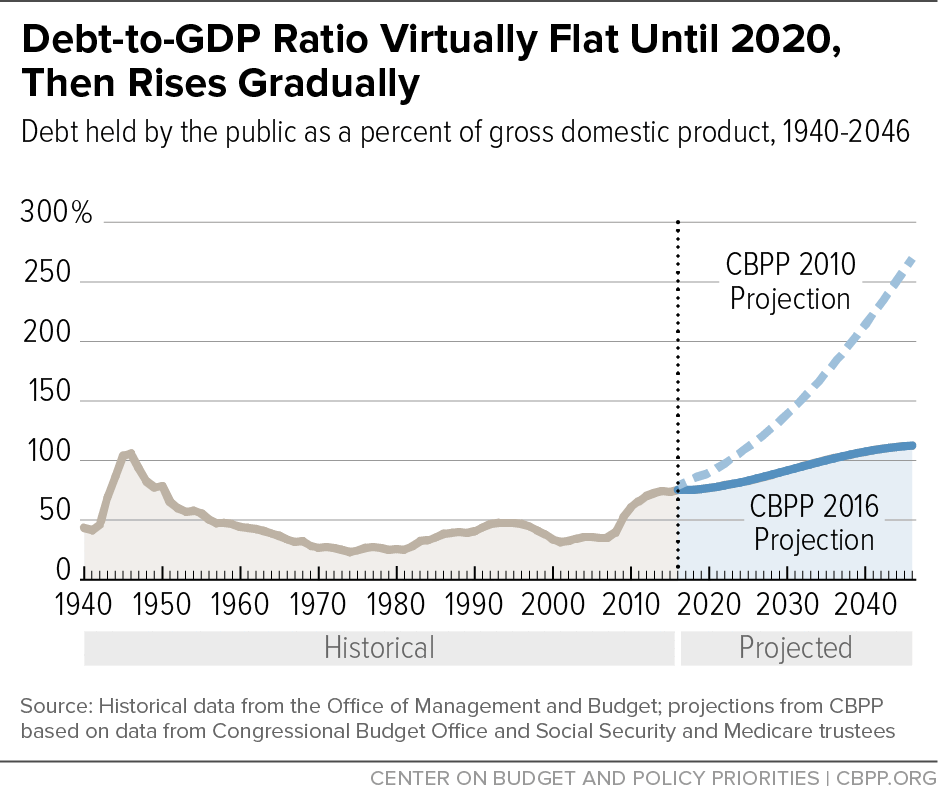
As Figure 6 below shows, the federal debt as a share of GDP is expected to be stable for the next few years, after which it is expected to rise. While policymakers will still need to raise revenues to meet our spending obligations in the long run, the figure reveals how much the projections have improved just in the past few years.
Figure 6 - There are two main causes of this improvement: a significant reduction in the growth of health care costs, part of which is considered to be attributable to the ACA, and lower projected interest rates. Together these two factors explain five-sixths of the improvement.
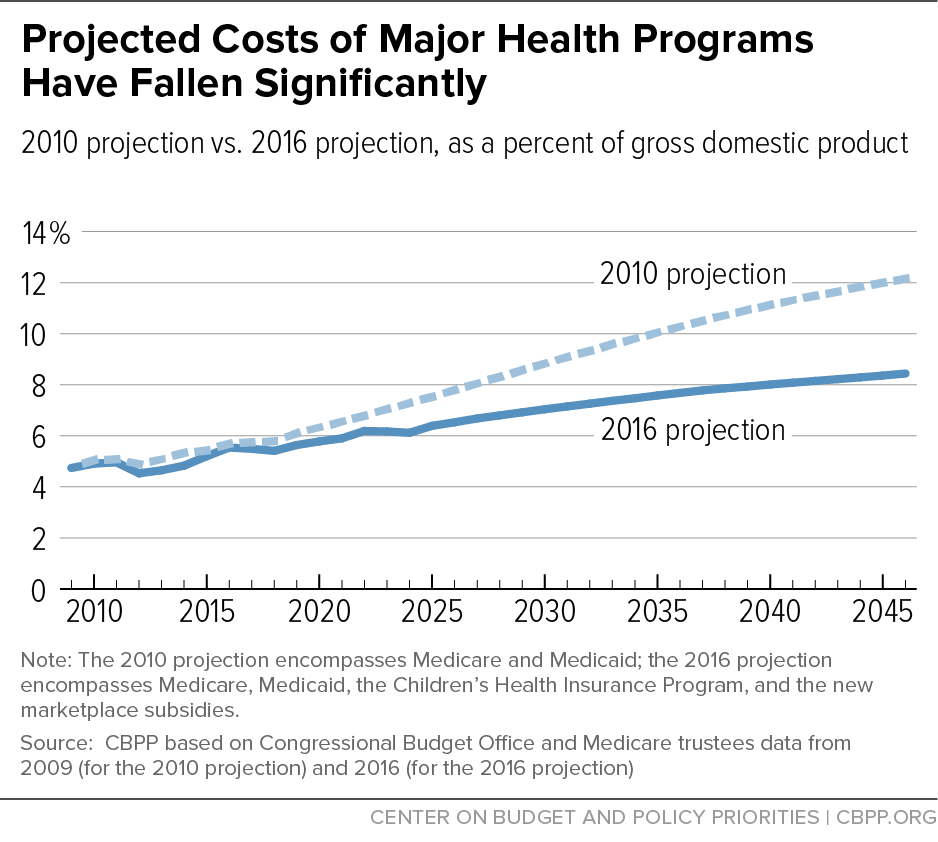
- Figure 7 below underscores the health savings point. It shows a four percentage point decline in projections for public health spending as a share of GDP between the 2010 projections and the most recent ones.
- Recent high-profile announcements of insurers pulling out of the health-care exchanges have led to criticism regarding rising premium costs for the 6 percent who get coverage through the “individual” (non-group) market. However, it is important to recognize, as in the figure above, that health costs, including premium expenses, have long been rising. So the question is not “will they go up,” but “how much will they go up relative to what we’d have expected in the absence of the ACA?” Recent research finds that the price of health insurance in the exchanges will remain between 12 percent[18] and 20 percent[19] below what CBO initially predicted. It is also important in this regard to remember that actual out-of-pocket premium costs for the vast majority in the exchanges (about 85 percent) reflect not the sticker price, but their post-premium-subsidy price.[20]
-
As is widely understood, our aging demographics will put pressure on retirement security programs over the next few decades. Social Security spending is expected to climb from about 5 percent of GDP to 6 percent by 2046, and Medicare, from about 3 to about 5 percent. These are not trivial increases, but they are far more manageable than the alarmist rhetoric often heard around them makes them seem. Because of the health care cost savings noted above, for example, Congress could close all of the projected 75-year funding gap for Medicare by raising its payroll tax from 1.45 percent each for employers and employees to about 1.8 percent.[21] Similarly, Social Security is projected to remain solvent until 2034, when the trust funds would still be able to pay out three-fourths of scheduled benefits. Its long-run solvency can and should be achieved primarily through revenue increases, while any benefit changes should be carefully crafted to protect low-income elderly people and those with disabilities.
Figure 7 - One area where Congress has cut spending, often through the imposition of caps on appropriations, has been on the discretionary side of the budget (both defense and non-defense programs). Given the investment agenda I recommend and the fact that about one-fifth of non-defense discretionary (NDD) programs help Americans with low and moderate incomes, underfunding NDD programs — which include education, job training, infrastructure, scientific and medical research, veterans’ health care, child care, and more — is of particular concern. Yet this funding is projected to fall to historical lows as a share of the economy in coming years.
Continued health care savings achieved by careful, granular analysis of how ACA reforms are squeezing out inefficiencies in the health-care delivery system and building on what works can help us keep the debt-to-GDP ratio on a more sustainable path. The President’s budget cuts more than $400 billion from Medicare spending over the next decade as well, from reforms targeted at providers, insurance companies, and prescription drugs. Raising revenues through the types of progressive tax ideas I described in a recent analysis, which include closing loopholes that waste needed revenues while exacerbating after-tax inequality, is also essential.[22]
To the extent that the investment agenda I recommend above will help to boost productivity growth, it is also worth noting that a 0.5 percent increase in the rate of productivity growth is projected to lower the debt/GDP ratio by 30 percentage points over the next 30 years.[23]
These ideas signal the way forward. They stand in stark contrast to the ideas put forth in the recent House majority’s budget. Noted budget analyst Bob Greenstein found that the House budget
…would decimate large swaths of the federal government, shrinking spending outside Social Security, Medicare, and interest payments to 7 percent of GDP by 2026 — less than three-fifths of its average of the past 40 years and only a little more than half its average level under President Reagan. It features particularly severe cuts in programs to help poor families and others of limited means. … If the policies in this budget were to become law in the years ahead, our nation would almost certainly become more mean-spirited and divided, with more poverty, inequality, and severe hardship and less opportunity.[24]
Further CBPP analysis finds that 62 percent of the spending cuts in the House budget come from programs that serve low- and moderate-income families, including Medicaid, nutritional support, and Pell grants. Such budgeting would not only lead tens of millions of people to lose health coverage and basic food support, but would also fly in the face of the positive, public investment agenda we very much need.
Conclusion
The current U.S. economy has both many strengths and some important weaknesses. While macroeconomic growth is lower than in past recoveries, we are significantly outperforming other advanced economies and our labor market is moving towards full employment. That, in turn, is pushing up earnings and supporting relatively strong consumer spending.
Evidence of these positive dynamics is evident in newly released data from the Census Bureau showing historically steep gains in low and median family incomes last year, along with the largest one-year drop in the poverty rate — from 14.8 percent to 13.5 percent — since the late 1960s.[25]
Where we have serious problems — ones that predated the Great Recession — is in slowing productivity growth and rising inequality. While economists have limited success in understanding what drives productivity, many of us believe that greater investment in public goods — from basic R&D to physical and human capital — would be likely to help. Either way, especially in the case of public infrastructure, we must invest in maintenance and upkeep, a view that should not be controversial in any partisan sense. My testimony highlights many good ideas from President Obama’s latest budget in these areas, ideas I hope the committee’s leadership will consider.
Our fiscal outlook has improved relative to recent projections by slowing health care costs and lowering expected interest rates. Regarding the former, the ACA is clearly helping to sharply reduce the uninsured rate. It also looks to have contributed to the fiscally important deceleration of health care spending.
Finally, recent budgets by the House majority push the wrong way by failing to invest in the future well-being of American households and undermining needed investments in people, infrastructure, and basic research, even though all of those investments have the potential to boost productivity growth and some would likely reduce inequality.
End Notes
[1] Alan S. Blinder and Mark Zandi, “The Financial Crisis: Lessons for the Next One,” Center on Budget and Policy Priorities, October 15, 2015, https://www.cbpp.org/research/economy/the-financial-crisis-lessons-for-the-next-one.
[2] Eric Morath and Julie Jargon, “Across the U.S., Workers at the Bottom of the Ladder Get Pay Raises,” Wall Street Journal, August 23, 2016, http://www.wsj.com/articles/pay-rises-for-workers-at-the-bottom-of-the-ladder-1471944604.
[3] Elise Gould, “Rising wage inequality continues to be a defining feature of the U.S. labor market,” Economic Policy Institute, August 30, 2016, http://www.epi.org/blog/rising-wage-inequality-continues-to-be-a-defining-feature-of-the-u-s-labor-market/.
[4] Federal Reserve Bank of New York Economic Press Briefing, “Job Growth in the Region,” August 18, 2016, https://www.newyorkfed.org/medialibrary/media/newsevents/mediaadvisory/2016/Regional-Economy-Press-Briefing-Presentation-08182016.pdf.
[5] See Economic Report of the President, February 2016, Chapter 2.
[6] Jared Bernstein, “What is the ‘natural rate’ for u6?” On the Economy, November 23, 2015, http://jaredbernsteinblog.com/what-is-the-natural-rate-for-u6/.
[7] Danny Yagan, “Is the Great Recession Really Over? Longitudinal Evidence of Enduring Employment Impacts,” July 2016, http://eml.berkeley.edu/~yagan/EnduringImpact.pdf.
[8] See http://eig.org/dci.
[9] Jared Bernstein, “What racial injustice looks like in America’s economy,” Washington Post, July 11, 2016, https://www.washingtonpost.com/posteverything/wp/2016/07/11/racial-economic-injustice-jobs-incomes-and-wealth/?utm_term=.d32e014145f8.
[10] Since we expect deficits to go up to some degree in recessions (e.g., due to lower revenue flows), it is important to measure the extent of austerity against a cyclically adjusted budget deficit. This approach will identify countries that undertook austerity measures yet still ran cyclical deficits.
[11] Goldman Sachs, US Economic Analyst: “From the election to the next recession,” September 9, 2016.
[12] Testimony of Jared Bernstein, Senior Fellow, Before the House Budget Committee, Center on Budget and Policy Priorities, June 17, 2015,
https://www.cbpp.org/sites/default/files/atoms/files/6-16-15econ_testimony.pdf.
[13] Jason Furman, “Is This Time Different? The Opportunities and Challenges of Artificial Intelligence,” July 7, 2016, https://www.whitehouse.gov/sites/default/files/page/files/20160707_cea_ai_furman.pdf.
[14] “The Economics of Early Childhood Investments,” December 2014, https://www.whitehouse.gov/sites/default/files/docs/early_childhood_report1.pdf.
[15] Chuck Marr et al., “Strengthening the EITC for Childless Workers Would Promote Work and Reduce Poverty,” Center on Budget and Policy priorities, April 11, 2016, https://www.cbpp.org/research/federal-tax/strengthening-the-eitc-for-childless-workers-would-promote-work-and-reduce#.
[16] Chuck Marr, “Expanding the EITC Would Help Workers in Every State,” Center on Budget and Policy Priorities, September 7, 2016, https://www.cbpp.org/blog/expanding-the-eitc-would-help-workers-in-every-state.
[17] Richard Kogan, Paul N. Van de Water, and Chloe Cho, “Long-Term Budget Outlook Has Improved Significantly Since 2010 But Remains Challenging,” Center on Budget and Policy Priorities, August 18, 2016, https://www.cbpp.org/research/long-term-budget-outlook-has-improved-significantly-since-2010-but-remains-challenging.
[18] Larry Levitt, Cynthia Cox, and Gary Claxton, “How ACA Marketplace Premiums Measure Up to Expectations,” Kaiser Family Foundation, August 1, 2016, http://kff.org/health-reform/perspective/how-aca-marketplace-premiums-measure-up-to-expectations/.
[19] Loren Adler and Paul B. Ginsburg, “Obamacare Premiums Are Lower Than You Think,” Health Affairs blog, July 21, 2016, http://healthaffairs.org/blog/2016/07/21/obamacare-premiums-are-lower-than-you-think/.
[20] Department of Health and Human Services, “New analysis shows consumers will still have affordable health coverage options next year,” August 24, 2016, https://www.hhs.gov/about/news/2016/08/24/new-analysis-shows-consumers-will-still-have-affordable-health-coverage-options-next-year.html.
[21] Paul N. Van De Water, “Social Security and Medicare Trustees See Little Change in Outlook,” Center on Budget and Policy Priorities, June 22, 2016, https://www.cbpp.org/press/statements/social-security-and-medicare-trustees-see-little-change-in-outlook.
[22] Jared Bernstein, “We’re Going to Need More Tax Revenue. Here’s How to Raise It,” The American Prospect, June 13, 2016, http://prospect.org/article/were-going-need-more-tax-revenue-heres-how-raise-it.
[23] Kogan, Van de Water, and Cho.
[24] “Greenstein: House Budget Would Mean More Poverty, Inequality, and Hardship,” Center on Budget and Policy Priorities, March 15, 2016, https://www.cbpp.org/press/statements/greenstein-house-budget-would-mean-more-poverty-inequality-and-hardship.
[25] This sentence was not in the testimony I submitted to the Budget Committee, as the data were released after I submitted my testimony but prior to the hearing. I did discuss these results in my spoken testimony.