Statement of Robert Greenstein, President, on Census’ 2011 Poverty, Income, and Health Insurance Data
Today’s Census data contained the good, the fair, and the ugly. The good news is that the number of uninsured Americans dropped by 1.3 million and the share of Americans without insurance fell by more than in any year since 1999; the fair news is that the poverty rate stayed flat after rising in the previous three years and seven of the previous 10; and the ugly news is that median household income fell by 1.5 percent after adjusting for inflation while income inequality widened significantly.
The drop in income of the median household — the household exactly in the middle of the income distribution — was tied to a substantial rise in income inequality. Put simply, household incomes fell in the middle and rose at the top as income gains from the economic recovery were very unevenly shared. For the 20 percent of households in the middle, average household income fell 1.7 percent, or $876. For the top 20 percent, average income rose 1.9 percent, or $3,286. For the top 5 percent of households, average income rose 5.1 percent, or $15,184. Incomes fell for the bottom four-fifths of American households, while rising only for the top fifth.
Economic Improvement and Unemployment Insurance Benefit Declines Offset Each Other, Leaving Poverty Flat
The Census data indicate that modest but significant improvement in the economy put downward pressure on poverty, while a large drop in unemployment insurance (UI) benefits that substantially exceeded the decline in unemployment exerted upward pressure.
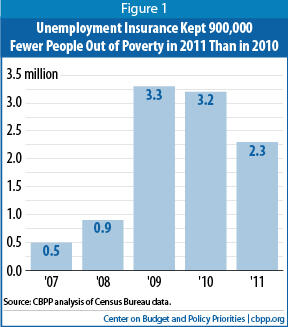
UI income fell by $36 billion — about a quarter — in 2011, while the number of unemployed workers fell 7 percent and the number of long-term unemployed (those out of work for over half a year and still looking for a job) fell 6 percent. The Census data show that UI benefits lifted 3.2 million Americans out of poverty in 2010, but 2.3 million in 2011 — a reduction of more than one-fourth (see Figure 1).
UI benefits fell because a temporary benefit increase from 2009 expired, many jobless Americans exhausted their benefits before they found jobs, and (on a positive note) the unemployment rate edged down. The large decline in UI benefit income, combined with the slow recovery, meant lower incomes for many families with workers who still couldn’t find employment. The Census data released today suggest that the UI decline added 0.3 percentage points to the poverty rate last year.
The economy showed modest improvement in 2011, with an increase of 1.7 percent or 1.9 million in the number of private-sector jobs, although average weekly wages for nonsupervisory workers edged down by 0.3 percent after adjusting for inflation. These gains and their impact in easing poverty were reduced, however, by the loss of 386,000 public-sector jobs, primarily at the local and state level, as well as by the decline in UI income. (The shrinkage in state and local government jobs included the loss of 110,000 jobs for teachers and other school employees.)
These data suggest that in the absence of the disproportionate decline in UI benefits and loss of state and local government jobs, poverty likely would have fallen modestly in 2011.
The data do show statistically significant declines in poverty for some groups. Poverty fell for Hispanics (from 26.5 percent in 2010 to 25.3 percent in 2011) and for men (from 14.0 percent to 13.6 percent). Poverty also fell in the South (from 16.8 percent to 16.0 percent) and in the suburbs (from 11.9 percent to 11.3 percent). The poverty rate remained statistically unchanged for most other groups and regions.
Image
 Gains in Health Insurance Coverage
The main positive news in today’s report is the fall in the share of Americans who are uninsured, from 16.3 percent in 2010 to 15.7 percent in 2011, the largest annual improvement since 1999. That improvement was driven in part by gains in coverage among young adults, which appear largely due to a provision of the health reform law allowing them to remain on their parent’s health plan until they reach age 26. Forty percent of the decline in the number of uninsured people came among individuals aged 19-25. Some 539,000 fewer 19-25-year-olds were uninsured in 2011 than in 2010.
Largely because more young adults were covered under their parents’ employer-based health plans, the overall percentage of non-elderly people with private coverage remained steady, rather than declining, for the first time in 10 years. Private coverage rose among those under 25 while falling among those aged 25-64, with the two effects offsetting each other.
The improvement in health coverage reflected, as well, a significant increase in the number and percentage of Americans with public health insurance — principally through Medicare, Medicaid, or the Children’s Health Insurance Program (CHIP). More people became eligible for these programs as the population aged and employer-based coverage continued to erode among those aged 25-64. A requirement of health reform that states maintain their Medicaid and CHIP eligibility levels and enrollment procedures also played a role.
Much larger reductions in the number of uninsured are expected in 2014, when the major coverage expansions of health reform take effect. The Congressional Budget Office estimates that, eventually, 30 million people who otherwise would be uninsured will gain coverage as a result of health reform.
Poverty Looking Backward and Forward
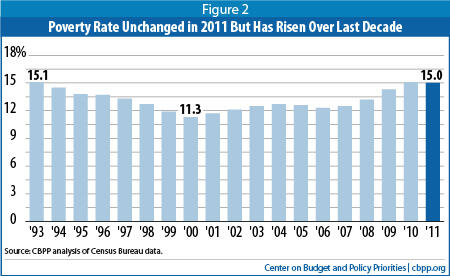
The continuing high level of poverty continues a trend that dates back to the unusually weak economic recovery that started in 2001. That recovery, which lasted until the Great Recession began in late 2007, marked the first sustained expansion on record in which growth was so weak, and income gains so unevenly shared, that poverty was higher by the end of it than at the beginning. (See Figure 2.)
The poverty rate is likely to start falling in 2012. Key labor market data — particularly the strength of private, non-farm job creation and the drop in the number of unemployed workers — are more positive so far in 2012 than they were in 2011.
Nevertheless, falling UI payments could place upward pressure on poverty again in 2012 — and especially in 2013, depending on actions that policymakers take in coming months. The new Census data on the role of UI benefits in reducing poverty underscore the importance of action to prevent federal UI benefits from ending entirely less than four months from now, on December 31 — as they will if policymakers do not act. At no time since 1958, when policymakers first created federal UI benefits, have policymakers allowed such benefits to expire when the unemployment rate remained above 7.2 percent.
Today’s data also underscore the need for those at the top to share in the sacrifices that lie ahead, as the nation moves to address unhealthy mid-term and long-term deficits. Given the need for substantial sacrifice and the skewing of income gains to those at the top, it is difficult to justify extending the rather lavish tax cuts for high-income individuals that policymakers enacted in 2001 and 2003, which average $129,000 a year for people who make over $1 million a year, according to the Urban-Brookings Tax Policy Center.
Impact of the Safety Net
As noted, the Census data show that UI kept 2.3 million people above the poverty line last year. Social Security kept 21.4 million people out of poverty.
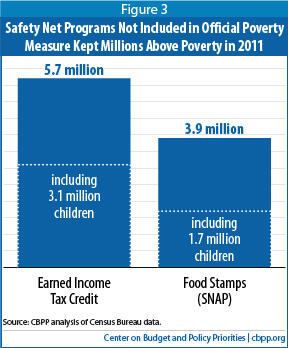
Under an alternative, more comprehensive measure of poverty that’s based on recommendations of a National Academy of Sciences (NAS) panel and that counts a fuller range of benefits — including the EITC, SNAP, low-income housing assistance, school lunches, and others — the increase in poverty was strikingly modest from 2007 to 2010 despite the Great Recession. Later this year, the Census Bureau will release data under this measure for 2011. Using the NAS-based measure, a Center on Budget and Policy Priorities analysis found that six temporary income-assistance provisions that policymakers enacted in 2009 and 2010 — including emergency UI benefits, a SNAP benefit increase, and working-family tax credits — kept an estimated 6.9 million people above the poverty line in 2010.
These Census data also highlight the impact that sharp cuts in such programs could have on poverty. The House-passed budget of last spring would cut SNAP by more than $133 billion over ten years and convert it to a block grant under which the program would no longer expand automatically when the economy turns down and contract automatically when the economy is again growing robustly. The House budget also would let the 2009 improvements in tax credits for low-income working families — as well as federal UI benefits — expire at the end of 2012, even as it would make permanent all expiring tax cuts that benefit high-income households. Such steps could significantly boost poverty rates in future years, especially during times of economic weakness, and exacerbate after-tax income inequality.
Efforts to reduce poverty need not conflict with efforts to reduce budget deficits. The three largest deficit-reduction packages of the last two decades — those enacted in 1990, 1993, and 1997 — reduced poverty and hardship even as they reduced deficits, due to increases that those packages included in the EITC (in 1990 and 1993) and food stamps (in 1993) and the creation of CHIP (in 1997).