What the 2012 Trustees' Report Shows About Social Security
On April 23, the Social Security Board of Trustees issued its annual report on the program's financial status.[1] The report shows some deterioration in the program's finances since the 2011 report. While that revision — which stems chiefly from lingering economic weakness — is not alarming, it reminds policymakers that they ought to act soon to put the program on a sound footing for the long run. Although the date when the program can no longer pay full benefits is still more than two decades away, prompt action would permit changes that are gradual rather than sudden, and allow people to plan their work, savings, and retirement with greater certainty.
Several key points emerge from the new report:
- The trustees estimate that, in the absence of policy changes, the combined Social Security trust funds will be exhausted in 2033 — three years earlier than they forecast in last year's report. That date fluctuates slightly in each trustees' report depending on economic, demographic, and other variables; over the last two decades, it has ranged between 2029 and 2042, but the overall conclusion has been relatively consistent.
- After 2033, Social Security could pay three-fourths of scheduled benefits using its tax income even if policymakers took no steps to shore up the program. Those who fear that Social Security won't be around when today's young workers retire misunderstand the trustees' projections.
- The program's shortfall is relatively modest, amounting to 1 percent of Gross Domestic Product (GDP) over the next 75 years (and 1.5 percent of GDP in 2086). A mix of tax increases and benefit modifications — carefully crafted to shield recipients with limited means and to give ample notice to all participants — could put the program on a sound footing indefinitely.
- The 75-year Social Security shortfall is slightly larger than the cost, over that period, of extending the 2001 and 2003 tax cuts for the richest Americans (those with incomes above $250,000 a year). And the cost of extending all of the expiring tax cuts dwarfs the Social Security shortfall, over 75 years, by two-to-one. Policymakers and pundits cannot simultaneously claim that the tax cuts for people at the top are affordable while the Social Security shortfall constitutes a dire fiscal threat.
- Policymakers will have to replenish the Disability Insurance trust fund by 2016. Ideally, they would do so as part of a comprehensive solvency package, because the retirement and disability components of Social Security are closely woven together. Pending action on a balanced and well-designed solvency package, it is reasonable to reallocate taxes between the disability and retirement programs — as policymakers have often done in the past.
Report Holds Few Surprises
The trustees' report focuses on the outlook for the next 75 years — a horizon that spans the lifetime of just about everybody now old enough to work. The trustees expect the program's tax income to climb slightly from today's levels, remaining near 13 percent of taxable payroll.[2] Meanwhile, the program's costs are expected to climb to nearly 18 percent of taxable payroll — up from slightly under 14 percent today. Interest earnings, long an important component of the trust funds' income, will shrink after the mid-2020s and eventually disappear. Over the entire 75-year period, the trustees put the Social Security shortfall at 2.67 percent of taxable payroll; the shortfall is concentrated in the later decades of the projection. Expressed as a share of the nation's economy, the 75-year shortfall is 1 percent of GDP.
Both of these widely cited figures include a buffer that allows for a target trust fund balance at the end of 2086. Without that buffer — which is set at 100 percent of the next year's estimated Social Security outlays — the shortfall would be 2.5 percent of taxable payroll or 0.9 percent of GDP.[3]
The program's costs will grow steadily for the next 25 years and then stabilize. The trustees expect its cost to pass 17 percent of taxable payroll in the 2030s and barely grow thereafter. (As a percentage of GDP, outlays will rise from 5 percent today to 6.4 percent in the 2030s, and then modestly subside.) While Social Security provides a safety net to people of all ages — to young children and their surviving parents who have lost a family breadwinner, to working-age adults who have suffered a disability, and to retired workers and elderly widows and widowers — about three-fourths of its benefits go to people age 65 or older. The share of the population that is 65 or older will climb steeply through 2035, from one in seven Americans today to one in five by the 2030s. The growth in Social Security's cost as a percentage of GDP roughly mirrors that pattern. This reiterates that Social Security's fundamental challenge is demographic, traceable to a rising number of beneficiaries rather than to escalating costs per beneficiary.[4]
The size of the shortfall over the next 75 years is somewhat larger than in the 2011 report (see Table 1). Of the slippage in the new forecast — which equals 0.44 percent of taxable payroll over 75 years — the actuaries attribute nearly half (0.21 percentage points) to revisions in their economic assumptions. They ascribe another 0.05 percentage points of the slippage to the simple passage of another year; the 75-year valuation period now spans 2012 through 2086, rather than 2011 through 2085, and thus adds one remote year of significant deficit. A variety of other factors accounts for the remaining change.
The projected deficit is the largest shortfall projected in the last 20 trustees' reports, but not dramatically so. In the 1993-2012 reports, the 75-year deficit averaged 2 percent of taxable payroll, and it has fluctuated within a fairly narrow range (see Table 1). Those figures are not, however, strictly comparable, because the period covered by the reports has shifted. The 1993 report, for example, spanned the period through 2067; this year's report goes through 2086. Each one-year shift in the "valuation period" moves the 75-year balance further into the red by a small amount, so it is not fair to compare today's actuarial deficit with one estimated in the 1990s. Unlike the program's deficit, the date of trust-fund exhaustion is not affected by the valuation period, and it has ranged between 2029 and 2042. In short, trustees' reports over the last two decades have told a consistent story — though they have not yet spurred policymakers to action.
| Table 1 Trustees' Estimates Have Fluctuated But Tell a Consistent Story |
||||||
| Change in actuarial balance since previous report due to... | ||||||
| Legislation and regulations | Valuation period | All other | Total change | Actuarial balance | Year of exhaustion | |
| 1993 | 0.00 | -0.05 | 0.05 | 0.00 | -1.46 | 2036 |
| 1994 | 0.00 | -0.05 | -0.61 | -0.66 | -2.13 | 2029 |
| 1995 | 0.00 | -0.07 | 0.03 | -0.04 | -2.17 | 2030 |
| 1996 | 0.03 | -0.08 | 0.03 | -0.02 | -2.19 | 2029 |
| 1997 | 0.03 | -0.08 | 0.02 | -0.03 | -2.23 | 2029 |
| 1998 | 0.00 | -0.08 | 0.12 | 0.04 | -2.19 | 2032 |
| 1999 | 0.00 | -0.08 | 0.20 | 0.12 | -2.07 | 2034 |
| 2000 | 0.00 | -0.07 | 0.24 | 0.17 | -1.89 | 2037 |
| 2001 | 0.00 | -0.07 | 0.10 | 0.03 | -1.86 | 2038 |
| 2002 | 0.00 | -0.07 | 0.06 | -0.01 | -1.87 | 2041 |
| 2003 | 0.00 | -0.07 | 0.03 | -0.04 | -1.92 | 2042 |
| 2004 | 0.00 | -0.07 | 0.10 | 0.03 | -1.89 | 2042 |
| 2005 | 0.00 | -0.07 | 0.03 | -0.04 | -1.92 | 2041 |
| 2006 | 0.00 | -0.06 | -0.03 | -0.09 | -2.02 | 2040 |
| 2007 | 0.00 | -0.06 | 0.13 | 0.06 | -1.95 | 2041 |
| 2008 | 0.00 | -0.06 | 0.32 | 0.26 | -1.70 | 2041 |
| 2009 | 0.00 | -0.05 | -0.25 | -0.30 | -2.00 | 2037 |
| 2010 | 0.14 | -0.06 | 0.00 | 0.08 | -1.92 | 2037 |
| 2011 | 0.00 | -0.05 | -0.25 | -0.30 | -2.22 | 2036 |
| 2012 | 0.00 | -0.05 | -0.39 | -0.44 | -2.67 | 2033 |
| Source: Annual trustees' reports. All figures (except year of exhaustion) are expressed as a percentage of taxable payroll. Details may not add to totals due to rounding. a "All other" changes include effects of economic, demographic, and disability assumptions and any changes in the actuaries' methods and models. |
||||||
Some commentators cite huge dollar figures that appear in the report, such as the estimated $9 trillion shortfall through 2086 (or even the $20 trillion shortfall through eternity, a figure whose validity many experts question[5] ). Except over relatively short periods, however, it is not useful to express Social Security's income, expenditures, or funding gap in dollar terms, which does not convey a sense of the economy's ability to support the program. Expressing them in relation to taxable payroll or GDP, in contrast, puts them in proper perspective. Over the next 75 years, for example, taxable payroll — discounted to today's dollars just as the $9 trillion shortfall figure is — will exceed $340 trillion, and GDP will be nearly $950 trillion. Thus, the shortfall over that period equals about 2.5 percent of taxable payroll and 0.9 percent of GDP.[6]
Recent Events Have Slightly Affected the Program
The 2010 trustees' report showed a small but significant improvement in Social Security's finances due to the health reform law, which the actuaries expect will shift some employee compensation from (nontaxable) fringe benefits to (taxable) wages. That's no longer new but is worth noting. Repealing health reform would not only leave many millions of people uninsured and abandon various cost-saving measures in Medicare, but it would also harm the Social Security outlook.
No significant legislation that altered the Social Security outlook has been enacted since last year's report. Legislators extended the payroll tax holiday — a temporary reduction of 2 percentage points in the tax rate for employees and the self-employed — for another year, so it will expire at the end of 2012. However, Social Security's revenue loss from that holiday is fully offset by a transfer from the Treasury's general fund to the trust funds, estimated to total about $220 billion, leaving the trust funds unaffected.
Cost-of-living adjustments (COLAs) have resumed after a two-year hiatus. Fueled by high energy prices, the December 2011 COLA was 3.6 percent — higher than the trustees expected and a small contributor to the deteriorated outlook. The resumption of COLAs also meant that some other key program parameters — notably the maximum amount of wages subject to the Social Security payroll tax, which was frozen at $106,800 for three years — would start rising again (the "taxable maximum" increased to $110,100 in 2012). The trustees expect COLAs to hover around 2 percent for several years before stabilizing at 2.8 percent annually. (The trustees' COLA assumptions are higher than those of the Congressional Budget Office.[7] ) COLAs would be slightly lower if policymakers adopted a different measure of inflation, the so-called chained Consumer Price Index, to adjust benefits.[8]
Key Dates and What They Mean
2033 is the "headline date" in the new trustees' report, because that is when the combined trust funds are expected to run out of Treasury bonds to cash in. At that point, if nothing else is done, benefits would have to be cut to match the program's annual tax income. The program could then pay 75 percent of scheduled benefits, a figure that would slip to 73 percent by 2086. Contrary to popular misconception, benefits would not stop.
Although the exhaustion date attracts keen attention, the trustees caution that their projections are uncertain. For example, while 2033 is their best estimate of when the trust funds will be depleted, they judge there is an 80 percent probability that trust fund exhaustion will occur sometime between 2030 and 2037 — and a 95 percent chance that depletion will happen between 2029 and 2041. Slightly more sanguine estimates that CBO issued in August 2011 suggest there is an 80 percent probability that the combined trust funds would be exhausted between 2030 and 2058.[9] In short, all reasonable estimates show a long-run problem but not an immediate crisis.
Two other, earlier dates also receive attention but have little significance for Social Security financing:
- 2010 marked the first year since 1983 in which the program's total expenses (for benefits and administrative costs) exceeded its tax income (from payroll taxes and income taxes that higher-income beneficiaries pay on a portion of their Social Security benefits). That so-called cash-flow imbalance — which equaled $49 billion in 2010 and $45 billion in 2011— was long expected to happen in the mid-2010s as demographic pressures built; the economic downturn simply led it to occur sooner. The trust funds are nevertheless still growing, chiefly because of the interest income they receive on their Treasury bonds. In 2011, for example, Social Security's interest income of $114 billion more than offset its cash deficit of $45 billion, leading the trust funds to grow by $69 billion.[10]
- 2021 will be the first year in which the program's expenses exceed its total income, including its interest income. At that point, the trust funds — after peaking at $3.1 trillion — will start to shrink as Social Security redeems its Treasury bonds to pay benefits.
Neither of these dates affects Social Security beneficiaries. Since the mid-1980s, Social Security has collected more in taxes each year than it pays out in benefits, has lent the excess revenue to the Treasury, and has received Treasury bonds in return. That accounts for the $2.7 trillion in Treasury bonds that the trust funds hold today.
The drafters of the 1983 Social Security amendments purposely designed program financing in this manner to help pre-fund some of the costs of the baby boomers' retirement. The interest income from the trust funds' bonds, as well as the proceeds from eventually redeeming the bond principal, will enable Social Security to keep paying full benefits until 2033. Of course, policymakers should restore Social Security's long-run solvency well before then. Social Security's diminishing cash flow is a concern for the Treasury, which manages the government's overall financing needs. Nevertheless, the bonds have the full faith and credit of the United States government, and — as long as the solvency of the federal government itself is not called into question — Social Security will be able to redeem its bonds just as any private investor might do.[11]
What Congress Should Do Soon
The report warns policymakers that they must act reasonably soon to replenish the Social Security disability fund. Most analyses of the trustees' report — including this one — focus on the combined Old-Age and Survivors Insurance (OASI) and Disability Insurance (DI) trust funds, commonly known as the Social Security trust funds. But these two trust funds are in fact separate, and the DI trust fund faces exhaustion in 2016. (The much bigger OASI fund would last until 2035. Combined, the two funds would be depleted in 2033.)
We strongly urge policymakers to address DI's pending depletion in the context of action on overall Social Security solvency. Both DI and OASI face fairly similar long-run shortfalls; DI simply requires action sooner. Key features of Social Security — including the tax base, the benefit formula, and cost-of-living adjustments — are similar or identical for the two Social Security programs, and most DI recipients are near or past Social Security's early-retirement age. Tackling DI in isolation would leave policymakers with few — and unduly harsh — options and lead them to ignore the strong interactions between Social Security's disability and retirement components. A balanced and comprehensive solvency package that covers both parts of Social Security would produce sounder policies. It also would provide an opportunity to make needed changes to the needs-tested Supplemental Security Income (SSI) program, which is distinct from Social Security but interacts with it in important ways.
Social Security solvency featured prominently in two recent deficit-reduction proposals. The Bowles-Simpson plan relied heavily on Social Security benefit cuts to restore long-term solvency; the Bipartisan Policy Center plan (more informally known as the Domenici-Rivlin plan) struck a more even balance between tax increases and benefit cuts.[12] Historically, however, most major Social Security legislation has moved through Congress on its own and not as part of big deficit-reduction packages. That tradition has allowed greater attention to the program's adequacy, equity, and relationship to other programs such as Medicare and SSI.
If policymakers are unable to agree on a sensible solvency package in time to avert DI depletion, however, they should reallocate revenues between the retirement and disability funds — a traditional and historically noncontroversial action that policymakers have often taken in the past to move resources between the two trust funds, in either direction. (For more on the disability program, see the text box on p. 9.)

GDP (a key test of fiscal sustainability) for the next decade.[14]
The revenue loss over the next 75 years from making all of the expiring tax cuts permanent would be two times the entire Social Security shortfall over that period. Indeed, the revenue loss just from extending the tax cuts for couples making more than $250,000 and unmarried people more than $200,000 would itself be almost as large as the Social Security shortfall over the 75-year period. (See Figure 1.) It's true that Congress' upcoming decisions about the fate of the tax cuts have little direct implication for Social Security. Letting the tax cuts expire would not "pay for" fixing Social Security, which has different sources of revenues; conversely, letting them continue would not directly harm Social Security. But the debate over the tax cuts provides a vivid opportunity to spot inconsistency and even hypocrisy among certain politicians and pundits. The high-end tax cuts and the Social Security shortfall are of similar size. Members of Congress cannot simultaneously claim that the tax cuts are affordable while the Social Security shortfall constitutes a grave fiscal threat.
The two-year payroll tax holiday will also expire at the end of December 2012. As we noted, the holiday has not harmed Social Security, because the general fund of the Treasury compensates the trust funds for the forgone revenue. But the holiday was meant to be temporary. Gradually returning to the 12.4 percent tax rate in law — and later increasing it to improve solvency — ought to be policymakers' goal.[15]
Conclusion
Because Social Security's finances are fairly predictable, it is not difficult to craft revenue and benefit proposals that would place the program on a sound long-term footing. The best proposals would protect vulnerable workers and beneficiaries and give all participants ample warning of future changes to this vital program.
Although Social Security faces no imminent crisis, policymakers should act sooner rather than later to restore its long-term solvency. As the Center's President Robert Greenstein explained in a paper that he co-authored in 2010 with Charles Blahous, one of Social Security's two current public trustees, the sooner policymakers act, the more fairly they can spread out the needed adjustments in revenue and benefit formulas, and the more confidently people can plan their work, savings, and retirement.[16]
Acting sooner will also help the budget as a whole by modestly reducing federal borrowing in coming years. That will make a contribution to stabilizing the debt-to-GDP ratio and limit our overall interest costs.
Nevertheless, policymakers need to design Social Security reform carefully and well. Nearly every American participates in Social Security, first as a worker and eventually as a beneficiary. The program's benefits — though modest both in dollar terms (elderly beneficiaries receive an average benefit of less than $15,000 a year) and in comparison with benefits in other countries (Social Security benefits replace a smaller share of pre-retirement earnings than comparable programs in most other western nations) — are the foundation of income security.[17] Treating Social Security as just one component of a big deficit-reduction package could lead policymakers to reach for "off-the-shelf" options without sufficiently considering the program's adequacy, equity, and relationship to other programs. Policymakers must design reforms judiciously to ensure that Social Security remains the most effective and successful income-security program in the nation's history.
Disability Insurance Isn't In Crisis
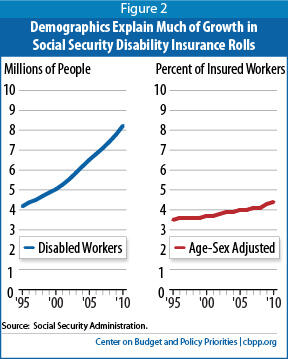
In December 2011, 8.6 million people received disabled-worker benefits from Social Security. (Payments also went to some of their family members: 160,000 spouses and 1.9 million children.) The number of disabled workers has doubled since 1995, while the working-age population — conventionally described as people age 20 through 64 — has increased by only about one-fifth. But that comparison is deceptive. Over that period:
- Baby boomers aged into their high-disability years. People are roughly twice as likely to be disabled at age 50 as at age 40 and twice as likely to be disabled at age 60 as at age 50. As the baby boomers (people born in 1946 through 1964) have grown older, the number of disability cases has risen.
- More women qualified for disability benefits. In general, workers with severe impairments can get disability benefits only if they have worked for at least one-fourth of their adult life and for five of the last ten years. Until the great influx of women into the workforce that occurred in the 1970s and 1980s, relatively few women met those tests; as recently as 1990, male disabled workers outnumbered women by nearly 2 to 1. Now that more women have worked long enough to qualify for disability benefits, the ratio has fallen to 1.1 to 1.Image
- Social Security's full retirement age rose from 65 to 66. When disabled workers reach full retirement age, they begin receiving Social Security retirement benefits and cease receiving disability benefits. The increase in the retirement age has delayed that conversion for many workers. In December 2011, more than 400,000 people between 65 and 66 collected disability benefits; under the rules in place a decade ago, they would be receiving retirement benefits instead.
The Social Security actuaries express the number of people receiving disability benefits using an "age- and sex-adjusted disability prevalence rate" that controls for these factors. Over the 1995-2011 period, that rate rose from 3.5 percent of the working-age population to 4.5 percent. That's certainly a significant increase, but not nearly as dramatic as some have painted (see Figure 2).
Not surprisingly, the rate has crept upward during periods of economic distress. Anecdotally and statistically, we know that many workers with physical or other health conditions turn to disability insurance when they can't find jobs and exhaust their unemployment benefits.
When lawmakers last redirected some payroll tax revenue from OASI to DI in 1994, they expected that step to keep DI solvent until 2016. Despite fluctuations in the meantime, the current projection still anticipates depletion in 2016. DI's depletion should not come as a surprise, or be considered evidence that the program is unsustainable or out of control.
End Notes
[1] The 2012Annual Report of the Board of Trustees of the Federal Old-Age and Survivors Insurance and Federal Disability Insurance Trust Funds, April 2012, http://www.ssa.gov/OACT/TR/2012/index.html.
[2] Payroll taxes equal 12.4 percent of taxable payroll, while dedicated income taxes from higher-income beneficiaries contribute another 0.5 percent, which will rise to nearly 1 percent by 2086. See "Components of Income Rates" http://www.ssa.gov/OACT/TR/2012/lrIndex.html.
[3] Trustees' Report, Table IV.B6.
[4] In fact, the scheduled rise in the full retirement age from 66 to 67, to be phased in between 2017 and 2022, will mitigate the program's cost growth. For an explanation, see box, "Why Does Raising the Retirement Age Reduce Benefits?" in Kathy Ruffing and Paul N. Van de Water, Social Security Benefits are Modest, Center on Budget and Policy Priorities, January 11, 2011, https://www.cbpp.org/cms/index.cfm?fa=view&id=3368.
[5] See letter from the American Academy of Actuaries to the Trustees of the Social Security System and the Social Security Advisory Board, December 19, 2003, http://www.actuary.org/pdf/socialsecurity/tech_dec03.pdf.
[6] Trustees' Report, Tables IV.B5 and IV.B6. As noted earlier, the more prominent figures — 2.67 percent of taxable payroll or 0.96 percent of GDP — include an extra margin for a target trust-fund balance at the end of 2086.
[7] Fact sheets on the Old-Age and Survivors Insurance and Disability Insurance programs, March 2012 baseline, http://www.cbo.gov/topics/retirement/social-security.
[8] Kathy Ruffing, Paul N. Van de Water, and Robert Greenstein, Chained CPI Can Be Part of a Balanced Deficit-Reduction Package, Under Certain Conditions, Center on Budget and Policy Priorities, February 22, 2012, https://www.cbpp.org/cms/?fa=view&id=3690.
[9] Congressional Budget Office, CBO's 2011 Long-Term Projections for Social Security: Additional Information, August 5, 2011. An update is expected this summer.
[10] Kathy A. Ruffing, Social Security Does Not Need a ‘Bailout': Alarmists' Claims Are Unjustified, But Action Is Needed to Ensure Long-Term Solvency, Center on Budget and Policy Priorities, August 24, 2010, https://www.cbpp.org/cms/index.cfm?fa=view&id=3104.
[11] Paul N. Van de Water, Understanding the Social Security Trust Funds, Center on Budget and Policy Priorities, October 5, 2010, https://www.cbpp.org/cms/index.cfm?fa=view&id=3299.
[12] Kathy Ruffing and Paul N. Van de Water, Bowles-Simpson Social Security Proposal Not a Good Starting Point for Reforms, Center on Budget and Policy Priorities, February 17, 2011; Kathy Ruffing, "Plans Differ on Social Security Fix," Center on Budget and Policy Priorities "Off the Charts" blog, November 23, 2010, http://www.offthechartsblog.org/plans-differ-on-social-security-fix/.
[13] The extension was part of a package that aided the unemployed, established the temporary payroll-tax holiday, and extended certain other tax cuts. Gillian Brunet and Chuck Marr, Unpacking the Tax Cut-Unemployment Compromise, Center on Budget and Policy Priorities, December 10, 2010, https://www.cbpp.org/cms/index.cfm?fa=view&id=3342.
[14] Kathy Ruffing and James R. Horney, Economic Downturn and Bush Policies Continue to Drive Large Projected Deficits, Center on Budget and Policy Priorities, May 10, 2011, https://www.cbpp.org/cms/?fa=view&id=3490.
[15] Elisa A. Walker, Thomas N. Bethell, and Virginia P. Reno, "Implications of the Payroll Tax Holiday for Social Security," National Academy of Social Insurance fact sheet, April 2012.
[16] Charles P. Blahous and Robert Greenstein, Social Security Shortfall Warrants Action Soon, Pew Economic Policy Group, November 2010, https://www.cbpp.org/files/11-9-10pew-socsec.pdf.
[17] Kathy A. Ruffing and Paul N. Van de Water, Social Security Benefits Are Modest, Center on Budget and Policy Priorities, January 11, 2011, https://www.cbpp.org/sites/default/files/atoms/files/1-11-11socsec.pdf; Kathy A. Ruffing, "We're Number…30!" Off the Charts blog, May 11, 2011, http://www.offthechartsblog.org/social-security-we%e2%80%99re-number%e2%80%a6-30/.
More from the Authors