An Arizona “TABOR” Would Endanger Education, Public Safety, and Infrastructure
The Arizona legislature is considering a new, very rigid limit on state spending. The limit would closely resemble a Colorado limitation known as the Taxpayer Bill of Rights or TABOR. An Arizona TABOR would make it very difficult for future Arizona legislatures and governors to meet the state’s obligations in areas like education, health, public safety, and infrastructure.
The proposed spending limit (known as SCR 1026) would:
- Immediately lock in the state’s current, depressed levels of funding for services. Since 2008, the state has enacted nearly $2 billion in cuts to education, health care, and other areas that are important to its economy and quality of life; TABOR would prevent restoration of funding in those areas as the economy recovers.
- Force further cuts in the next few years beyond those already enacted, by keeping funding well below the rate of growth necessary to keep pace with the cost of services and the state’s changing demographics, such as its increasing senior population. In fact, had Arizona enacted a TABOR when Colorado enacted its own, the state budget cuts of the last three years — deep as they have been — would have been nearly three times as large. An analysis of the TABOR limit proposed in SCR 1026 conducted by School of Business professors at Arizona State University shows that it would have required an additional $1.6 billion in cuts in the current year on top of those that were enacted.
- Put funding for services in direct conflict with the state’s ability to make required payments on its bonds, which could harm the state’s bond rating and cost the state $9 million or more per year in heightened borrowing costs due to investors’ fear of future defaults.
- Deny legislators the flexibility to deal with future changes in the economy (good or bad) and impede new investment to meet emerging needs. Legislators would be less accountable to the public in the process, as their power to make decisions about each year’s budget would be sharply constricted by the TABOR formula.
- Squeeze local government, as state cuts in funding for services push the responsibility for meeting needs to the local level.
Colorado is at present the only state with a TABOR. In 2005, Colorado voters suspended the TABOR formula to halt the deluge of harmful budget cuts that had occurred and were slated to occur under TABOR. Since Colorado adopted TABOR in 1992, over 20 state legislatures have rejected TABOR, and it has been voted down in every state in which it reached the ballot.
TABOR contributed to deterioration in the availability and quality of nearly all major public services in Colorado, causing the state to fall in the ranks on key measures of funding adequacy such as affordable higher education, health care coverage for low-income seniors and children, and K-12 class size. Arizona already lags behind the rest of the country on these measures, and TABOR would prevent the state from improving in any area without dismantling services in other areas.
Arizona and other states have repeatedly rejected TABOR because its formula limiting revenue growth to population growth plus inflation — for reasons detailed in the Appendix to this analysis — does more than control state spending, as its proponents often claim. It requires massive reductions in vital services that residents want and need — education, health care, public safety, roads, environmental protection, and others — in both the short and long term.
TABOR in Arizona
Arizona has been one of the states hardest hit by the recession. From 2008 to 2012, the collapse in the state’s revenues is causing $1.7 billion in spending cuts — roughly 17 percent of the budget — even as inflation, demographic changes, and other factors increase the cost of providing services. Due to the funding cuts, Arizona has:
- Eliminated preschool for more than 4,000 children, funding for schools to provide additional support to disadvantaged children from preschool to third grade, aid to charter schools, and funding for books, computers, and other classroom supplies.
- Halved funding for kindergarten, leaving school districts and parents to shoulder the cost of keeping their children in school beyond a half-day schedule.
- Cut higher education support by 50 percent since 2008, resulting in approved undergraduate tuition increases of between 9 and 20 percent as well as fee increases at the state’s three public universities. Additionally, the three state universities have implemented salary reductions, layoffs, furloughs, position eliminations, and larger teaching workloads.
- Eliminated health insurance coverage for more than 130,000 poor adults and put a freeze on eligibility for children’s health coverage, which has led to at least 60,000 children being denied coverage.
One might wonder: Could TABOR possibly make things worse? The answer is yes — much, much worse.
What Would the Arizona TABOR Proposal Do?
This report focuses on SCR 1026, which would place the TABOR population-plus-inflation formula in the state constitution. Two other bills, HB 2707 and SB 1231, also use a TABOR formula to restrict funding for services, with potentially similar consequences.
The following are the key provisions of SCR 1026:
- The proposal would amend the state’s constitution to bar the state government from spending state revenues in excess of a prescribed limit. The limit for each year would equal the previous year’s appropriated revenues, multiplied by the combined rates of annual inflation and population growth.
- The base year for the formula — that is, the year that would determine future years’ limits — would be fiscal year 2013.
- The limitation would apply broadly to state taxes, fees, assessments, licenses, fines, and charges for services, either general or earmarked for special purposes.
- Revenues in excess of the TABOR limit may be distributed to: (a) the budget stabilization fund, until the fund reaches a maximum limit of 10 percent of the current fiscal year’s revenue appropriations (this will require legislation expanding the fund to 10 percent from its current 7 percent limit), (b) an emergency fund (until it reaches a maximum limit of 5 percent of the current year’s revenue appropriations), and/or (c) taxpayers via a refund.
- Override of SCR 1026 would require a two-thirds majority in each house of the legislature, the governor’s approval, and a statewide referendum. This is stricter than the requirement for a legislative voter-referral to amend the state’s constitution, which requires only a simple majority in each house of the legislature prior to a popular vote.
An analysis by researchers at the Center for Competitiveness and Prosperity Research, which is based at the W.P. Carey School of Business of Arizona State University (ASU), shows that the cuts caused by SCR 1026 would go well beyond those caused by the recent recession. [1] The ASU researchers computed what allowable spending would have been in each year, had Arizona enacted its TABOR at the same time as Colorado, starting in 1993.
The TABOR limit created by SCR 1026 would have limited Arizona’s spending to $24 billion less than it actually spent between fiscal years 1993 and 2011. The greatest gap between actual and allowed revenues would have been in fiscal year 2007, prior to the current recession, when the state would have had $4.4 billion less revenue to spend than it actually had. That would have required a cut of 32 percent of the services supported by state revenues that year.
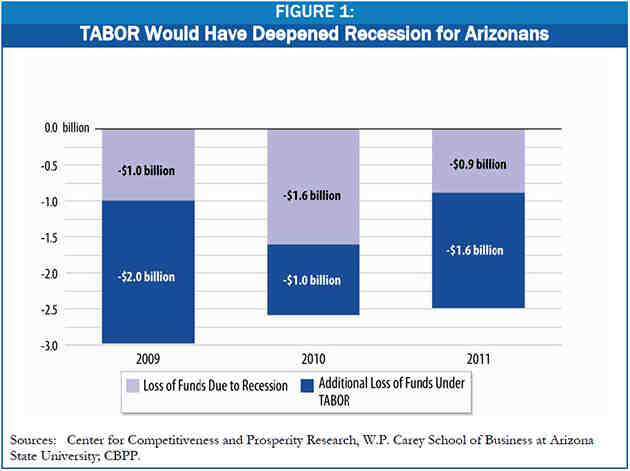
Even more remarkable would have been the impact of TABOR on the state budgets for fiscal years 2009, 2010, and 2011, as the state grappled with record-setting revenue declines and made sweeping and deep cuts in services as a result. The recession caused state revenues to drop nearly $1 billion from 2008 to 2009, leading the state to meet its balanced-budget requirement with huge cuts in funding for schools, universities, health care, human services, and other areas. The ASU analysis shows that TABOR would have tripled that impact, causing an additional loss of nearly $2 billion (see Figure 1) and thus a commensurately greater level of cuts. Similarly, by 2011, the drop in state revenues due to recession, relative to 2008 in inflation-adjusted terms, totaled roughly $900 million, forcing yet more budget cuts, but once again TABOR would have required the state to go another $1.6 billion deeper in cuts.
The additional $1.6 billion in 2011 budget cuts is an amount equal to 13 percent of state funding in that year. That $1.6 billion is roughly equal to:
- One-half of 2011 general fund spending on K-12 education; or
- All 2011 general fund spending on Medicaid, community colleges, and the Departments of Public Safety and Juvenile Corrections, combined.
Deep cuts in funding for services also slow Arizona’s economic recovery by creating a cycle of job loss in the private sector. When schools, universities, police and fire departments, and juvenile corrections facilities reduce spending, they cancel contracts with private vendors and eliminate or lower payments to businesses and nonprofit organizations that provide direct services. As a result, the companies and organizations doing business with the state have less money to spend on salaries and supplies and may reduce the salaries of their workers or lay them off. When workers receive lower pay or lose their job, they consume less, and the ripple effect continues throughout the state’s economy, costing even more jobs.
TABOR also jeopardizes Arizona’s ability to be economically competitive over the long term. To attract businesses to the state, and encourage the development of new businesses, a state needs a well-educated and healthy workforce, sound infrastructure, and a good quality of life. By causing cuts to Arizona’s education system and higher borrowing costs for infrastructure projects (as described below), TABOR would slow the state’s economy for decades to come.
TABOR Causes Other Problems
State Bonds and Bond Ratings
TABOR in Arizona would lower bond ratings and raise borrowing costs for the state, which in turn would reduce the state’s ability to build infrastructure and squeeze other areas of spending. The reason is that the state’s interest payments on the bonds it has sold to finance roads, schools, and other infrastructure would be placed in competition with all other expenditures for a shrinking pot of available revenue. Even if the state continued to make its bond payments on a consistent basis, the mere threat of possible future default would raise interest costs.
An extensive study of state revenue limits and borrowing costs conducted for the Public Policy Institute of California by James Poterba, now a professor at MIT, and Kim Reuben of the Urban Institute found that “revenue limits … tend to increase borrowing costs because they hamper the state’s perceived ability to pay its long-term debt. … States with binding revenue limits pay, on average, 17.5 basis points more on their general obligation debt than states without such limits.”[2] This is true even though only one state (Arkansas in the 1930s) has defaulted on its debt in over a century.
If that finding held in the case of Arizona, it would mean an additional $1.75 million in annual debt service for every $1 billion in new bond sales. Outstanding Arizona bonded debt in 2010 was about $5 billion, nearly all of it for roads, highways, and school construction. [3] This suggests annual costs resulting from TABOR could reach $9 million or more annually, which in turn would either reduce the state’s ability to finance infrastructure or squeeze other state services.
New Investments, Federal Mandates, and Leveraging Federal Dollars
State and local governments would also find it extremely difficult to make new investments, meet federal mandates, or leverage additional federal dollars under SCR 1026. For example, the rigidities of formula-based budgeting, such as a population-and-inflation growth factor, do not allow funding of new priorities that may be embraced by the public, as has happened in the past with initiatives to reduce class sizes or put in place more stringent corrections policies.
The TABOR formula also could impede the ability of the state and localities to adapt to federal mandates that require states to spend more in specific areas, such as security and education, or to receive additional federal dollars for specific priorities.
Local Government
An Arizona TABOR would damage directly state-funded services, and indirectly services provided by local governments and schools. Arizona’s local governments typically receive around 37 percent of their general fund revenues through intergovernmental transfers from the state. [4] When the state is forced to reduce spending in response to the limit on revenues, local governments are likely to feel the squeeze as well.
As the state reduces the public services it provides, the pressure on local government to meet the needs of Arizonans would increase. With less revenue and more demand for services, local governments would be forced to either raise taxes and fees or cut services.
The Colorado Experience with TABOR
Colorado’s experience provides Arizona with an important cautionary tale. In 1992, Colorado adopted the Taxpayer Bill of Rights (TABOR), a constitutional amendment that limits budget growth to changes in population plus inflation. A growing body of evidence shows that in the 13 years following its adoption, TABOR contributed to deterioration in the availability and quality of nearly all major public services in Colorado. [5]
- TABOR contributed to substantial declines in Colorado K-12 education funding . Between 1992 and 2001, Colorado fell from 35th to 49th in the nation in K-12 spending as a percentage of personal income. [6] During that same time period, Colorado’s average per-pupil funding fell from $379 to $809 below the national average; by 2006 per pupil funding was $988 below the national average. [7]
TABOR Did Not Improve Colorado’s Business Climate
Colorado, the only state with a TABOR, has an economy that is stronger than Arizona’s. However, that has nothing to do with TABOR. The strength of Colorado’s economy is largely a legacy of a post-World War II public investment boom by the military and federal government.
The federal investment left Colorado with a strong infrastructure of high-tech firms and researchers, a young, highly educated workforce, and public universities with well respected science and technology programs. By 1991, before TABOR was adopted, more adults in Colorado had completed at least four years of college than in any other state in the nation.
Other advantages, such as energy resources, natural beauty, a location in the center of the country, and massive public investment in a new Denver airport have also helped create a strong economy. (See https://www.cbpp.org/cms/index.cfm?fa=view&id=2497.)
But TABOR did not cause Colorado’s success. A study by two prominent economists in the area of state and local public finance found that Colorado’s growth during the first decade under TABOR was roughly the same as what it would have been without TABOR. The study used statistical analysis to control for factors other than TABOR that could affect economic growth. (See http://www.taxpolicycenter.org/publications/url.cfm?ID=1000940.)
- TABOR played a major role in the significant cuts made in higher education funding. Under TABOR, higher education funding per resident student dropped by 31 percent after adjusting for inflation. Between 1992 and 2001, Colorado’s college and university funding as a share of personal income fell from 35th to 48th in the nation and as of fiscal year 2008, the state maintained this ranking.[8]
- TABOR led to drops in funding for public health programs. Between 1992 and 2002, Colorado declined from 23rd to 48th in the nation in the percentage of pregnant women receiving adequate access to prenatal care; between 2002 and 2006, the share of women receiving adequate prenatal care in Colorado deteriorated from 67.3 percent to 64.5 percent. Colorado also plummeted from 24th to 50th in the nation in the share of children receiving their full vaccinations. Only by investing additional funds in immunization programs was Colorado able to improve its ranking to 23rd in 2008. [9]
- TABOR failed to grow the Colorado economy and may have worsened the recession. Under TABOR, Colorado saw slower job growth than other Rocky Mountain states. [10] And in the wake of the 2001 recession, Colorado actually fared worse than its neighbors: Between March 2001 and January 2006 (when Colorado’s TABOR was suspended), job growth in the eight Rocky Mountain states averaged 9.3 percent; in Colorado, however, it was two-tenths of one percent.
Colorado Business and Community Leaders View TABOR as Deeply Flawed
A wide range of Coloradoans — business leaders, higher education officials, children’s advocates, and legislators of both parties, among others — recognize that TABOR has limited the state’s ability to fund critical services:
“Coloradoans were told in 1992 . . . that [TABOR] guaranteed them a right to vote on any and all tax increases. . . . What the public didn’t realize was that it would contain the strictest tax and spending limitation of any state in the country, and long-term would hobble us economically.” — Tom Clark, Executive Vice President, Metro Denver Economic Development Corporation
“The [TABOR] formula . . . has an insidious effect where it shrinks government every year, year after year after year after year; it’s never small enough. . . . That is not the best way to form public policy.” — Brad Young, former Colorado state representative (R) and Chair of the Joint Budget Committee
“[Business leaders] have figured out that no business would survive if it were run like the TABOR faithful say Colorado should be run — with withering tax support for college and universities, underfunded public schools and a future of crumbling roads and bridges.” — Neil Westergaard, Editor of the Denver Business Journal
Colorado business leaders and citizens banded together and successfully campaigned to suspend the TABOR formula beginning in 2006 and permanently change some of its most damaging features. Although the suspension now has technically expired, Colorado revenues and services remain well below the TABOR limit.
The failure to regain services during the suspension reflects the difficulty of generating enough annual revenue to improve services in the aftermath of so many years of revenue starvation. There would have to be very robust and sustained revenue growth to allow Colorado to go beyond maintaining its current, low level of services and begin to recoup lost ground. It is extremely difficult to restore services once TABOR has been in place for a long period of time.[11]
How Far Can Arizona Fall?
When Colorado adopted TABOR it ranked in the middle of the pack among states on a number of key public services. Under TABOR, Colorado fell to the bottom on many of those rankings and despite TABOR’s suspension in 2005, the state has been unable to recover in a number of areas. Arizona, unlike Colorado prior to TABOR, already ranks among the lowest-performing states on a range of education and health care measures:
- Arizona ranks 42nd in the nation in K-12 spending as a percentage of personal income. [12]
- Arizona ranks 47th in average per-pupil funding, $2,700 less per student than the national average. [13]
- Arizona ranks 48th in the nation in the average number of students per teacher. [14]
- Arizona ranks 38th among the states in state funding of higher education per $1,000 of personal income. [15]
- Arizona ranks 39th in the percentage of low-income, nonelderly adults with health insurance. [16]
- Arizona ranks 47th among the states in its share of low-income children with health insurance. [17]
While spending on education is not the only determinant of education quality, cutting spending year after year certainly does not allow a state to make the investments needed to build and sustain a successful education system. As noted above, Arizona already has undergone substantial cuts to education as well as other fundamental services during the recession and in its wake. Because SCR 1026 would prevent revenues from returning to pre-recessionary levels, it would lock in these cuts and permanently depress state support for investments that the state’s residents and businesses want and need.
Adopting the proposed revenue cap, which would restrict the amount of money available to fund these key programs at both the state and local level, would be devastating to Arizona. It would hurt not only Arizona’s children and adults, but also the economy, which relies on educated individuals and up-to-date infrastructure in order to grow.
APPENDIX: The Flawed Population-Growth-and-Inflation Formula
Arizona’s proposed TABOR limits state revenues to a formula based on growth in overall population and inflation. This formula does not allow a state to maintain year after year the same level of programs and services it now provides.
Instead, it suppresses public services over time and hinders the state’s ability to provide its citizens with the quality of life and services they need and demand, even in prosperous times.[18]
Image
 Population
The first part of the population-growth-and-inflation formula is the change in overall population growth. Overall population growth, however, is not a good proxy for the change in the populations served by public services. The segments of the population that states serve tend to grow more rapidly than the overall population used in the formula.
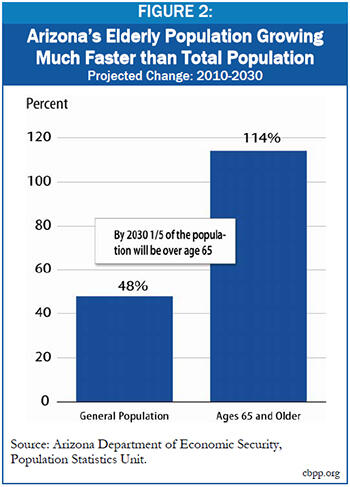
An example particularly relevant to Arizona is senior citizens. According to Arizona’s Department of Economic Security, the state’s total population is projected to increase by 48 percent from 2010 to 2030, while Arizona’s population aged 65 and older is projected to increase by 114 percent during that same time period.[19] As Arizona’s elderly population — which will be one-fifth of its total population by 2030— increases, so will the cost of providing the current level of services they have come to depend upon, such as health and long-term care, meals on wheels, home energy assistance, and other services. [20] The allowable state revenue limit, however, would prevent services like these from growing with need because it would be calculated using the much slower-growing total population. Services for the elderly could be maintained only if Arizona residents were willing to make cuts in other areas of the state budget, such as education or public safety.
Inflation
The second part of the formula is inflation, which does not accurately measure the change in the cost of providing public services. In fact, no existing measure of inflation does. Colorado’s TABOR formula uses the Consumer Price Index (CPI) for all urban consumers; as noted in the text of this analysis, this formula has led to deep reductions in school funding, health care services, roads, and other areas.
The measure of inflation proposed for Arizona is even worse. It is the “implicit price deflator” for the gross domestic product for Arizona, or GDP deflator, which is calculated by the U.S. Bureau of Economic Analysis. The GDP deflator is an index of changes in the prices of goods and services included in the GDP.[21]
Two features of this measure are particularly problematic:
- First, the flaw that the GDP deflator shares with the CPI and all other measures of inflation is that it does not reflect changes in costs faced by state and local government. Rather, it reflects changes in costs faced by the economy as a whole, which are lower. The root of the problem here is that the “goods”— or public services— that make up the bulk of Arizona’s spending (and every other state’s) are in economic sectors that are less likely to reap the efficiency and productivity gains achieved by other sectors of the economy. For example, teachers can only teach so many students, and nurses can only care for so many patients. As a result, the costs of these public services are rising faster than the costs in other sectors.
Indeed, the items most heavily purchased by states — such as health care, K-12 and higher education, and child care and early education — have seen significantly greater cost increases in the past decade than the prices of the goods and services economy-wide. [22] Limiting the growth in revenues to a formula that uses the rate of growth in general inflation will not affect the level or growth of public service costs in the economy; instead, it will affect the quantity and/or quality of public services the state is able to provide to its citizens. - Second, the GDP price deflator is even less appropriate than the CPI as a measure of government costs. The deflator assumes consumers can shift their spending from one area to another to take advantage of lower prices. For example, families might eat at home more often when the prices of restaurant meals rise. But state and local governments’ spending priorities cannot and should not be rearranged with every change in prices. For example, due to budget rules, the state cannot simply move money from its education budget to its highway trust fund during periods when school-related costs (such as health care for teachers) are rising faster than road-building costs (such as asphalt and concrete). Nor would this make any sense. The services of state and local governments, like education and transportation, are essential to the state’s well-being and prosperity; one should not be the trade-off for the other. As a result of this assumption, the GDP deflator always generates a lower growth rate than the CPI. In fact, from 1993 to 2005 — the period of time that Colorado’s TABOR was in effect — the GDP deflator rose at an average rate of 2.0 percent annually, well below the CPI measure used to calculate Colorado’s TABOR. Had Colorado’s TABOR been based on the GDP deflator, that state’s cuts to education, health care, and other services would have been substantially more severe than they were.
End Notes
[1] The data for this analysis were provided by Dennis Hoffman of the L. William Seidman Research Institute and Timothy Hogan and Tom R. Rex of the Center for Competitiveness and Prosperity Research, W.P. Carey School of Business at Arizona State University. A previous version of their analysis was published as “Tax Expenditure Limitation Proposals in Arizona: A Report from the Office of the University Economist,” on February 16, 2011, http://wpcarey.asu.edu/seid/ccpr/upload/TEL-Final.pdf. The authors re-ran the data in that report to simulate implementation in fiscal year 1993, the same year that Colorado’s TABOR took effect.
[2] James M. Poterba and Kim S. Rueben, Fiscal Rules and State Borrowing Costs: Evidence from California and Other States, Public Policy Institute of California, 1999.
[3] See State of Arizona: Comprehensive Annual Financial Report for the Fiscal Year Ended June 30, 2010, p. 32, http://www.gao.az.gov/financials/CAFR/2010_CAFR-031511.pdf.
[4] U.S. Census Bureau, Survey of State and Local Government Finances, http://www.census.gov/govs/estimate/.
[5] For a more detailed analysis of the problems experienced in Colorado under TABOR, please see Iris J. Lav and Erica Williams, “A Formula for Decline: Lessons from Colorado for States Considering TABOR,” Center on Budget and Policy Priorities, March 15, 2010, https://www.cbpp.org/cms/index.cfm?fa=view&id=753.
[6] Center on Budget and Policy Priorities calculation of National Center for Education Statistics data (Table 176. Current expenditures for public elementary and secondary education, by state or jurisdiction), and Bureau of Economic Analysis quarterly personal income data ( http://www.bea.gov/regional/sqpi/).
[7] CBPP analysis of National Center for Education Statistics data (Table 184. Current expenditure per pupil in fall enrollment in public elementary and secondary schools, by state or jurisdiction).
[8] “Grapevine Annual Compilation of Data on State Tax Appropriations for the General Operation of Higher Education (2008),” Center for the Study of Education Policy, Illinois State University.
[9] United Health Foundation analysis of National Center for Health Statistics data, http://www.americashealthrankings.org/Measure/2009/List%20All/Prenatal%20Care.aspx .
[10] Karen Lyons and Nicholas Johnson, “Education and Investment, Not TABOR, Fueled Colorado’s Economic Growth in 1990s,” Center on Budget and Policy Priorities, March 2006.
[11] Iris J. Lav and Erica Williams, “A Formula for Decline: Lessons from Colorado for States Considering TABOR,” Center on Budget and Policy Priorities, March 2010, https://www.cbpp.org/cms/?fa=view&id=753.
[12] Center on Budget and Policy Priorities calculation of National Center for Education Statistics data (Table 177: Current expenditures for public elementary and secondary education, by state or jurisdiction for 2006-07), and Bureau of Economic Analysis quarterly personal income data ( http://www.bea.gov/regional/sqpi/).
[13] National Center for Education Statistics, Table 185: Current expenditure per pupil in fall enrollment in public elementary and secondary schools, by state or jurisdiction, for 2006-07.
[14] CBPP analysis of National Center for Education Statistics data (Table 66. Teachers, enrollment, and pupil/teacher ratios in public elementary and secondary schools, by state or jurisdiction, for fall 2007).
[15] CBPP analysis of Grapevine Compilation of Data on State Tax Appropriations for the General Operation of Higher Education (2009), Center for the Study of Education Policy, Illinois State University, and Bureau of Economic Analysis quarterly personal income data ( http://www.bea.gov/regional/sqpi/).
[16] Center on Budget and Policy Priorities analysis of the Annual Social and Economic Supplements to the 2008 and 2009 Current Population Surveys. Ranking includes the District of Columbia.
[17] U.S. Census Bureau, Current Population Survey, 2010 Annual Social and Economic Supplement, Table HI10: Number and percent of children under 19 at or below 200% of poverty by health insurance coverage and state: 2009, http://www.census.gov/hhes/www/cpstables/032010/health/h10_000.htm . Ranking includes the District of Columbia.
[18] For a more detailed analysis of the problems with the population-growth-plus-inflation formula, please see David Bradley, Nick Johnson, and Iris Lav, “The Flawed ‘Population Plus Inflation’ Formula: Why TABOR’s Growth Formula Doesn’t Work,” Center on Budget and Policy Priorities, January 2005. https://www.cbpp.org/1-13-05sfp3.htm.
[19] Arizona Department of Economic Security, Population Statistics Unit, http://www.workforce.az.gov/?PAGEID=67&SUBID=257.
[20] See the Arizona Department of Economic Security, Division of Aging and Adult Services for more information on state services offered to the elderly, https://www.azdes.gov/common.aspx?menu=36&menuc=28&id=190 .
[21] The GDP deflator for Arizona, despite its name, does not actually reflect price changes in Arizona. Rather, it is the GDP deflator for the nation as a whole with an adjustment to reflect Arizona’s specific mix of industries. Bureau of Economic Analysis, “Gross Domestic Product by State Estimation Methodology,” p. 22, http://www.bea.gov/regional/gsp/help/.
[22] From 2000 to 2010, the GDP deflator rose 27 percent (the same as the CPI-U), but education costs rose 77 percent, and medical costs rose 48 percent. Costs for fuel and child care/nursery school rose 55 percent and 54 percent, respectively. Moreover, these are costs to consumers, not costs to governments. Rapidly growing education and health costs are a much higher share of state spending than individual consumer or business spending.
More from the Authors

Areas of Expertise