House Appropriations Targets Represent Poor Allocation of Insufficient Resources
The House Appropriations Committee recently adopted its fiscal year 2015 funding allocations for its 12 subcommittees. The allocations are consistent with the defense and non-defense discretionary funding caps set in last year’s agreement between Senate Budget Committee Chair Patty Murray and House Budget Committee Chair Paul Ryan. Despite that agreement’s partial relief from the sequestration budget cuts, the overall funding level is much tighter than many observers appreciate. Further, the House allocations to meet the tight non-defense cap reflect skewed policy choices, likely imposing deeper cuts on programs serving low-income populations and certain other priority programs than on other areas. These choices are particularly inappropriate in a period of rising inequality.
This analysis’ key findings are:
- Non-defense discretionary programs need to be cut below the last year’s appropriated levels to stay within the 2015 caps. The Murray-Ryan deal raised the 2015 cap for non-defense discretionary funding only a small amount above the sequestration level — but not enough to accommodate certain factors largely beyond the Appropriations Committees’ control (such as lower estimates of receipts from Federal Housing Administration [FHA] mortgage insurance) and funding increases already enacted for veterans’ medical care. Adjusting the 2014 enacted level for these factors, appropriations for other non-defense discretionary programs will need to fall in 2015 by more than $3 billion below the 2014 level. And the 2014 appropriations themselves were austere, since the Murray-Ryan deal canceled only part of sequestration in that year. Further, after adjusting for inflation, the cut is almost $14 billion below the 2014 levels.
- The House Appropriation Committee has targeted funding areas with key low-income programs for deeper cuts. To meet the 2015 cap, the House Appropriations Committee allocations impose the biggest dollar cuts on the two appropriations bills that cover health, education, housing, transportation, and human services. These bills include a high concentration of the non-defense discretionary programs that support low-income individuals. Given the deep cuts that virtually all non-defense discretionary programs have sustained in recent years, the choices Congress faces are difficult. But in 2015’s constrained funding environment, the pain should be spread more evenly; concentrating the cuts on low-income programs is highly inappropriate.
Of course, Congress could address the problem by funding non-defense discretionary programs at a higher overall level, but it does not seem inclined to revisit the 2015 cap levels set in the Murray-Ryan deal, so it will surely be forced to cut some programs that merit increases. Non-defense discretionary funding supports a diverse set of public services, ranging from environmental protection and food safety to veterans’ health care and border security. It supports investments that can boost future productivity, such as in education and basic scientific research, and helps low-income Americans meet basic needs and climb the economic ladder, such as through Head Start, job training, and services for frail elderly and disabled people.
The squeeze on non-defense discretionary funding will become even more acute in 2016. The Murray-Ryan agreement was a two-year deal that didn’t apply to 2016, so the full sequestration cuts remain in effect for that and subsequent years.
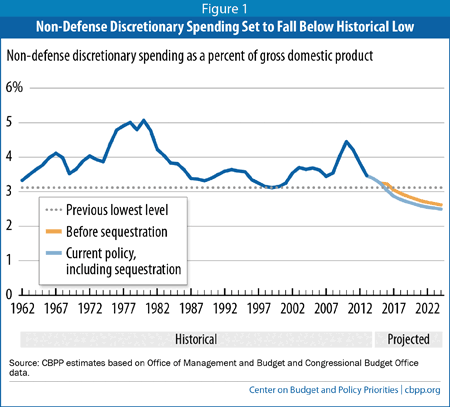
In fact, non-defense discretionary spending in 2016 will fall to its lowest level as share of the economy on record, with data going back to 1962 (see Figure 1). It will continue to fall as a share of gross domestic product (GDP) in years after that. Policymakers should consequently commit to providing relief starting in 2016, much as they did in the Murray-Ryan deal, in order to avoid severe cuts in key services upon which many Americans depend and important investments in the nation’s future.
This analysis examines the 2015 cap on non-defense discretionary funding and reviews the allocations to the 12 House Appropriations Subcommittees. The Appendix provides more details related to our methodology and estimates.
Effects of the 2015 Cap on Non-Defense Appropriations
The Murray-Ryan deal, formally the Bipartisan Budget Act of 2013, raised the Budget Control Act’s (BCA) caps on defense and non-defense discretionary funding for 2014 and 2015 to provide partial relief from sequestration. Because it provided more relief in 2014 than in 2015, the 2015 cap of $492.4 billion on non-defense discretionary funding is only about $580 million higher than the 2014 cap of $491.8 billion. That reflects a nominal growth rate of 0.1 percent, far below the inflation rate of 1.9 percent.
Moreover, this modest increase is more than offset by other factors that influence the amount of program funding available under the caps. One major factor, shown in Table 1 and discussed below, reflects a technical adjustment: the Congressional Budget Office (CBO) estimates that receipts from FHA mortgage guarantees will decrease by $3.0 billion in 2015. Since these receipts are counted in determining whether funding for non-defense programs complies with the cap, this reduction essentially leaves Congress with $3.0 billion less to fund non-defense discretionary programs than it would otherwise have, though other technical re-estimates lower this figure to $2.7 billion.
In addition, Congress has already made one key decision regarding 2015 funding. In the 2014 omnibus appropriations measure, it enacted 2015 funding for veterans’ hospitals and medical care, setting it $1.2 billion above the 2014 level.[1] The increase reflects a broad consensus that more funding is needed to help meet rising needs and costs for veterans’ medical care.
Taking this advance appropriation and the technical adjustments noted above into account, Congress must cut other non-defense discretionary programs by almost $3.3 billion to comply with the 2015 cap. That is, under CBO scoring, non-defense discretionary programs outside of veterans’ medical care must fall $3.3 billion below their 2014 enacted levels for total non-defense discretionary funding to comply with the 2015 cap. (See the Appendix for more details on our methodology related to these estimates.)
| Table 1 Complying With 2015 Non-Defense Discretionary (NDD) Cap (budget authority in billions of dollars) | |
| 2014 NDD enacted level | 491.8 |
| New estimates and technical adjustments: | |
| Lower estimate of Federal Housing Administration receipts | 3.0 |
| Other adjustments | -0.3 |
| Enacted (advance appropriations): | |
| Increase in veterans’ medical care | 1.2 |
| 2014 NDD level adjusted | 495.7 |
| Cuts needed to comply with 2015 NDD cap | -3.3 |
| 2015 NDD cap | 492.4 |
| Source: CBPP calculations from Congressional Budget Office data | |
Further, none of these calculations reflect the impact of inflation, which, by eroding the value of the 2014 funding levels, effectively imposes another cut of more than $10 billion. Thus, after accounting for inflation and for the technical adjustments and advance appropriations for veterans’ health care shown in Table 1, the current 2015 non-defense discretionary cap is almost $14 billion below the 2014 enacted level.
FHA Receipts and Other Federal Credit Programs
As Table 1 shows, CBO estimates $3.0 billion less in net receipts in 2015 than in 2014 for the FHA mortgage insurance program. This program and certain other credit programs, including the related Government National Mortgage Association (GNMA) mortgage insurance program, are classified as discretionary and therefore counted in scoring appropriations bills.[2]
Overall, CBO expects that the fees borrowers pay to the government for FHA mortgage assistance will exceed the losses the government will suffer from later defaults (measured on a present-value basis), yielding net receipts. These net receipts are credited to the HUD appropriations bills, where they offset a small share of the cost of appropriated programs. When CBO scored the 2014 omnibus appropriations measure enacted in January, it estimated that the FHA credit programs would produce about $11.7 billion in net income. But for 2015, CBO estimates net income of about $8.7 billion — or $3.0 billion lower than last year.
For all practical purposes, the Appropriations Committee has no ability to affect this estimated reduction in net receipts. As a result, $3 billion more in other cuts will be needed to offset the reduction in FHA receipts.
A further issue is that this year CBO and the Office of Management and Budget (OMB) have very different estimates of the net FHA and related receipts. OMB believes they will be $1.3 billion higher than last year, or $4.3 billion more than CBO now estimates. Stated another way, OMB scoring of FHA and related receipts would yield $4.3 billion of additional room under the caps, relative to CBO scoring. The implications of this difference are substantial, because by law and Supreme Court ruling, executive branch estimates must be used to determine whether appropriations bills actually comply with the BCA caps. While Congress uses CBO scoring to estimate whether the appropriations bills comply with congressional budget plans, doing so in this case would mean that Congress will not be able to provide as much funding for non-defense discretionary programs as is allowed under OMB scoring; it will have to impose larger cuts.[3]
Implications of House Non-Defense Discretionary Allocations
The House Appropriations Committee has allocated the amounts available under the defense and non-defense discretionary caps to its 12 subcommittees. Known as 302(b) allocations after the section of the Congressional Budget Act that governs this process, they set limits on overall discretionary funding for each of the 12 regular annual appropriations bills, enforced by congressional procedures. This analysis examines the non-defense discretionary allocations.
| Table 2 House Allocation for Non-defense Discretionary, by Size of Cut or Increase ($ in billions) | |||
| 2014 Level Adjusted** | 2015 House Allocation | Difference | |
| Labor, Health & Human Services, Education | 157.8 | 155.7 | -2.1 |
| Transportation, Housing and Urban Development | 53.6 | 51.9 | -1.7 |
| Financial Services & General Government | 21.6 | 21.3 | -0.4 |
| Homeland Security | 37.8 | 37.6 | -0.2 |
| Agriculture | 21.0 | 20.9 | -0.1 |
| State, Foreign Operations | 42.5 | 42.4 | -0.1 |
| Legislative Branch | 4.3 | 4.3 | * |
| Defense | 0.2 | 0.2 | * |
| Energy & Water Development | 16.8 | 16.9 | 0.1 |
| Interior, Environment | 30.1 | 30.2 | 0.1 |
| Military Construction, Veterans’ Affairs | 64.7 | 64.9 | 0.3 |
| Commerce, Justice, Science | 45.3 | 46.1 | 0.8 |
| Total | 495.7 | 492.4 | -3.3 |
| Note: May not add due to rounding *Less than $50 million. **Adjusts for reestimates of credit programs and changes in mandatory programs (see Box 1) and advance appropriations in veterans’ medical care. See Table 3 in Appendix for more details. Source: CBPP calculations from Congressional Budget Office data | |||
Table 2 compares the estimated non-defense portion of the subcommittee allocations the House Appropriations Committee has approved with our estimate of what would be needed to maintain program spending at last year’s levels, as adjusted. As discussed above, the adjustments to the 2014 enacted level reflect changes in credit program costs and anticipated savings from changes in mandatory programs (known as “CHIMPs,” see Box 1). [4] They also incorporate the funding increase for veterans’ medical care that Congress has already enacted through advance appropriations for 2015. Thus, for the Military Construction & Veterans Affairs Subcommittee, the difference between the 2014 level adjusted and the House allocation columns represents only the additional increase beyond that already provided by the advance appropriation. (See the Appendix for more details on our methodology related to these estimates.)
Box 1: Changes in Mandatory Programs, or “CHIMPs”
Appropriations bills often include provisions (“CHIMPs,” short for “changes in mandatory programs”) that generate savings by imposing limits on, or otherwise modifying, certain entitlement or mandatory programs. Some of these provisions have been used for many years and are a standard component of the appropriations process. From its founding, CBO has credited the savings from CHIMPs to the appropriations bills although they affect mandatory programs not under the Appropriations Committees’ jurisdiction. (Less frequently, CHIMPs generate costs, which are also charged to the Appropriations Committees.) This practice reflects the common-sense principle that committees should be accountable for the budgetary effects of their choices even if the programs in question aren’t technically under their jurisdiction. CBO’s longstanding practice was formally ratified by the Budget Committees and OMB in 1990.
CBO’s estimate of the savings from the same CHIMP language can change from year to year as a result of outside factors affecting spending in the mandatory program. Moreover, the composition of CHIMPs can change from year to year. The total estimate of CHIMPs for 2015 in our analysis yields very similar (very slightly higher) savings than the savings for 2014, though the estimates of individual CHIMP provisions vary much more (see Table 3 in the Appendix).
It is worth noting that the caps established in the Budget Control Act were set with a clear understanding of CHIMP savings — that is, the Administration and congressional leaders who negotiated the BCA caps in 2011 fully anticipated that CHIMPs would be used to meet the statutory caps.
As the table shows, programs funded through three bills — Labor, Health & Human Services (HHS), and Education; Transportation, Housing & Urban Development (HUD); and Financial Services and General Government — will bear the brunt of the cuts needed to comply with the 2015 non-defense discretionary cap.
The impact of these low 302(b) allocations is beginning to be evident as appropriations bills are crafted. For HUD, cuts in the House subcommittee bill include $300 million from HOME Investment Partnership grants, which states and localities use to rehabilitate or build affordable rental housing and assist low-income homeowners, $100 million from public housing capital funds, $40 million from lead-based paint hazard reduction grants, and $27 million from Housing Opportunities for People with AIDS (HOPWA).
Funding for Housing Choice Vouchers (Tenant-Based Rental Assistance) is $179 million higher than provided in 2014, but the increase will likely be far less than is needed to cover rising rental charges faced by the 2.1 million low-income households using vouchers in the private housing market. As a result, housing agencies will be forced to choose between reducing the number of families they assist in 2015 — potentially locking in the loss of more than 70,000 housing vouchers cut last year due to sequestration and reversing agencies’ efforts to restore vouchers to use with the increased funding Congress provided for 2014 — or freezing the subsidies they provide to families, even as rents rise. The first option will exacerbate homelessness among the families who remain unassisted because of the reductions in assistance. But freezing subsidies simply shifts the costs of rising rents fully on to low-income families’ very tight budgets, forcing them to choose between spending less on food, medicine, and other essentials or moving to a lower-cost unit, if one can be found, often in a less-safe neighborhood with less effective schools.
It remains to be seen how the House Appropriations Committee will allocate the programmatic cut of more than $2 billion it has targeted to the subcommittee on Labor, Health & Human Services, Education. Those cuts could be achieved in many ways. But this appropriations bill includes funding for a number of important and popular programs; the bill’s four largest programs — the National Institutes of Health, Pell Grants, and the two biggest K-12 education programs (Title I grants to school districts and Special Education) — account for roughly half of the bill’s cost. Adding Head Start and the administrative expenses for operating Medicare, Social Security, and unemployment insurance brings the total to nearly two-thirds of the bill’s total funding. The remaining one-third covers everything from the Centers for Disease Control and Prevention to job training to Meals on Wheels.
For illustrative purposes, if the savings were achieved by making cuts to all programs in proportion to their size, the reductions from the 2014 funding level would be roughly $390 million from the National Institutes of Health and $75 million from the Centers for Disease Control; $280 million from Elementary and Secondary Education (including Title I grants to school districts); $170 million from Special Education for students with disabilities; $230 million from children and families programs such as Head Start, low-income energy assistance, child care, and the Community Services block grant; $120 million from job training, job matching, and the administration of unemployment insurance; $195 million from the administration of Medicare, Social Security, and Supplemental Security Income; and $80 million from health centers and other health resources and services activities.
The exact magnitude of the cuts required by the Labor, Health & Human Services, Education bill will be affected by the level of CHIMP savings the bill contains. Our estimate of the funding available for this bill under the House 302(b) allocation assumes the level of CHIMP savings in the President’s budget, which is at least $1 billion less than the related CHIMP savings for 2014. If the committee can match the 2014 level of CHIMP savings, the required reductions would be cut in half. (Of course, this would only represent sound policy if the CHIMPs were themselves appropriate.)
None of these comparisons with 2014 levels reflects the effects of inflation. Inflation adjustments are necessary to accommodate the higher cost each year of providing the same level of goods and services. When inflation is taken into account, using CBO estimates, the cuts relative to the 2014 level that are needed to comply with the tight 2015 caps are even larger. On an adjusted basis and including the effects of inflation, all of the non-defense bills would face a cut under the House allocations except for the Military Construction & Veterans Affairs bill, which keeps up with inflation. (See Table 3 in the Appendix.)
Further, it is worth recalling that the 2014 funding levels themselves are quite constrained. In fact, the 2014 non-defense funding level is about 8 percent lower than the 2010 level in nominal dollars and about 15 percent lower when inflation is taken into account.
These facts highlight the fundamental problem with 2015 non-defense discretionary appropriations: the total funding available under the cap, even after the sequestration relief in the Murray-Ryan deal, is insufficient to meet national needs. Within this tight cap, the House allocations are problematic, likely imposing an outsized burden on programs for low-income populations who are less able to absorb the impact of such cuts.
The optimal solution would be to provide additional funding in 2015 in order to accommodate higher funding levels for low-income programs and certain other crucial programs that have seen damaging cuts in recent years. But Congress seems inclined to adhere to the existing cap levels for 2015, so policymakers must pursue other alternatives to mitigate the most damaging cuts likely to occur under the House allocations, especially in programs for low-income and vulnerable Americans. Principal among the steps that lawmakers should take is to distribute the limited overall funding more equitably across the various appropriations bills.
Policymakers also should pursue another deal like the Murray-Ryan agreement to provide additional funding in 2016 and subsequent years, when sequestration will again be in full force. Policymakers will need to act expeditiously next year to forestall the still-more-damaging cuts that otherwise will occur under current law.
Appendix
To properly compare the 2015 House Appropriation Committee 302(b) allocations to the 2014 enacted levels, we need to make certain adjustments to the 2014 figures. Some of these adjustments, such as for revised estimates of federal credit programs and for advance appropriations, are described in the body of the text. This Appendix provides more details on two other adjustments: splitting the House allocations between defense and non-defense funding and updating estimates for changes in mandatory programs (CHIMPs).
Table 3 at the end of this Appendix presents the adjustments by subcommittee.
Split between defense and non-defense discretionary — The separate defense and non-defense funding caps do not align neatly with the 12 Appropriations subcommittees. For example, funding under the defense cap includes virtually all funds provided by the Defense appropriations subcommittee plus about half of the funds provided by the Energy & Water Development subcommittee in its appropriations bill and noticeable amounts provided by the Military Construction & Veterans, Homeland Security, and Commerce, Justice, Science subcommittees.
In this analysis, we examine the House priorities for the non-defense category. Yet the House 302(b) allocations show only the total amount allocated to each of the 12 appropriations subcommittees, adding to the total cap of $1,014 billion; they do not specify the amount in each subcommittee intended for non-defense programs.
We handle this complication as follows. For the five House appropriations bills that have already been acted on at the subcommittee or full committee level (the Transportation, HUD bill; the Commerce, Justice, Science bill; the Legislative Branch bill; the Military Construction & Veterans bill; and the Agriculture bill), we use CBO’s estimates of those measures to separate the funding between defense and domestic programs. For the other subcommittees that will provide both defense and domestic funding, we assume funding will be split between defense and non-defense programs in the same proportion as in 2014. The resulting estimates of defense and non-defense funding turn out to be extremely close to the actual 2015 caps for defense — suggesting that this method closely approximates the defense/non-defense divisions that the House Appropriations Committee intends.
Estimate of CHIMPs for 2015 — CBO’s estimate of savings resulting from the same CHIMP language can change from year to year. For example, for at least the past 15 years measures funding the Justice Department have included language limiting the amount of money that can be spent from the Crime Victims’ Fund (CVF), which primarily supports grants to states for programs that assist victims of crime. Absent that language, mandatory law would require the CVF to distribute all of its money each year. Even though appropriations measures have generally allowed higher distributions from one year to the next, the CVF’s assets (derived mostly from criminal fines and penalties) increase faster. This means that the same CHIMP limitation on CVF distributions would be estimated to save somewhat more in 2015 than in 2014.
Consider how this fact affects our analysis. Our goal is to ascertain, for example, whether the House 302(b) allocations for 2015 constitute an increase or decrease over the 2014 levels. The Crime Victims’ Fund CHIMP will be scored as “saving” more in 2015 than 2014, not because the amount of CVF funds distributed would be lower — actually, the 2015 House bill provides for distributions that will rise slightly — but because the remaining assets of the CVF, which would otherwise have to be disbursed, would be higher. On its face, this means that the 302(b) allocation for the Commerce, Justice, Science bill can be somewhat lower in 2015 than in 2014 without that resulting in a nominal cut in the resources actually appropriated for these departments’ activities.
We deal with this by adjusting our starting point, the 2014 funding scored by CBO, for the change in CHIMP scoring from 2014 to 2015. That way, we can compare the 302(b) allocation for the applicable subcommittee to the adjusted 2014 level to see whether funding for regular (non-CHIMP) programs will go up or down. Most simply, we are trying to find out which subcommittees get increases and which get decreases after changes in CHIMPs are taken into account. In this light, the overall $3.3 billion in 2015 cuts in non-defense discretionary programs that we identify in Tables 1 and 2 represent the cuts that will be required in actual appropriated programs.
To find out whether net CHIMPs grow or shrink from 2014 to 2015, we compare CBO’s scoring of the 2014 omnibus appropriations measure with its 2015 scoring of the five new appropriations measures already available. For the remaining appropriations measures, we compare what CBO scored for 2014 to what we expect CBO to score for 2015 if the subcommittees include the same CHIMPs as the President’s budget. These are the only available CBO estimates of CHIMPs for 2015. Specifically, CBO has not supplied estimates of how 2014 CHIMP language would be scored if it repeated in 2015.
Inflation adjustment – Our analysis also addresses the effects of inflation. We do this by starting with CBO’s baseline projection for 2015 non-defense discretionary funding (for each of the 12 subcommittees). CBO’s baseline projections account for inflation, and they already include the new estimates of credit programs and the advanced appropriation for veterans’ medical care that are reflected in the adjusted 2014 levels we use in this analysis. We then adjust the CBO baseline projections to include the amount of 2015 CHIMP savings we expect, as described above.[5] With that adjustment, the CBO baseline projections are comparable to both the adjusted 2014 levels and the House 302(b) allocations. We find that these inflation-adjusted levels are $10.3 billion above the adjusted 2014 level and $13.6 billion above the House 302(b) allocations.
| Table 3 2014 Funding, Technical Adjustments, Advance Funding, and Inflation (In billions of dollars) | |||||||
| Technical adjustments | Policy change | ||||||
| 2014 Enacted | Remove 2014 CHIMPs | Add 2015 CHIMPs | Change in credit estimates from 2014 to 2015 | Change in advance funding | 2014 level adjusted | 2014 level adjusted and inflated | |
| Agriculture | 20.9 | 1.0 | -0.8 | * | 0.0 | 21.0 | 21.3 |
| Commerce, Justice, Science | 46.6 | 9.6 | -10.9 | 0.0 | 0.0 | 45.3 | 46.5 |
| Defense | 0.2 | 0.0 | 0.0 | 0.0 | 0.0 | 0.2 | 0.2 |
| Energy & Water Development | 16.9 | * | * | * | 0.0 | 16.8 | 17.1 |
| Financial Services & General Government | 21.8 | 0.8 | -1.0 | 0.0 | * | 21.6 | 22.3 |
| Homeland Security | 37.7 | 0.1 | * | 0.0 | 0.0 | 37.8 | 38.9 |
| Interior, Environment | 30.1 | 0.1 | * | 0.0 | 0.0 | 30.1 | 30.8 |
| Labor, Health & Human Services, Education | 156.8 | 6.3 | -5.2 | 0.0 | 0.0 | 157.8 | 160.5 |
| Legislative Branch | 4.3 | * | 0.0 | 0.0 | 0.0 | 4.3 | 4.4 |
| Military Construction, Veterans Affairs | 63.5 | 0.0 | 0.0 | 0.0 | 1.2 | 64.7 | 64.9 |
| State, Foreign Operations | 42.5 | * | * | 0.0 | 0.0 | 42.5 | 44.2 |
| Transportation, Housing & Urban Development | 50.7 | 0.1 | -0.2 | 3.0 | 0.0 | 53.6 | 54.7 |
| TOTAL | 491.8 | 17.9 | -18.1 | 2.9 | 1.2 | 495.7 | 505.9 |
| May not add due to rounding CHIMPS = Changes in mandatory programs * = less than $50 million Source: CBPP calculations from Congressional Budget Office data | |||||||
End Notes
[1] Since 2010, Congress has funded veterans’ health care one year in advance. Advance appropriations can help protect programs from the uncertainty that comes when Congress is unable to enact regular or omnibus appropriations measures by October 1, the start of the fiscal year.
[2] For most discretionary programs, if the Appropriations Committee provides the same amount of funding this year as last, the scored funding is identical. For these and some other credit programs, in contrast, the scored amount of funding can differ from year to year. A key reason is that the Appropriations Committees effectively permit the FHA program to meet all market demand, and that demand can change from year to year. Another reason is that, under budget rules in effect since 1992, the cost of a particular level of credit activity is scored up front rather than spread over time. The estimated up-front cost is based on the expected losses or gains the government will make over time on that year’s new activity, and estimates of future losses can change from year to year.
[3] The total estimating difference for non-defense discretionary programs between OMB and CBO will depend on the policies in the 2015 appropriations bills. Other estimating differences will likely offset a portion of the $4.3 billion. As a result, OMB’s estimates of 2015 non-defense funding will likely be lower than CBO’s, but not by the full $4.3 billion.
[4] The effect of these adjustments is most notable in the Transportation, HUD and Commerce, Justice, Science bills. For instance, under the House 302(b) allocations, the non-defense portion of the Transportation, HUD bill rises by $1.2 billion above the 2014 enacted level but declines by about $1.7 billion below the 2014 adjusted level, since the latter accounts for the reduction in estimated net receipts in the FHA and GNMA mortgage programs. The Commerce, Justice, Science bill illustrates the opposite effect. Before adjustment, the non-defense portion of that subcommittee’s allocation is $0.5 billion below the 2014 enacted level. However, that reduction is more than offset by almost $1.3 billion in increased savings from CHIMPs, most notably a limitation on spending from the Crime Victims Fund. The net effect is that program funding in the bill goes up by $800 million.
[5] Following statutory rules for baseline projections, CBO does not assume any CHIMP savings in any future year.
More from the Authors

Areas of Expertise
