Ryan Budget Would Slash SNAP by $137 Billion Over Ten Years
Low-Income Households in All States Would Feel Sharp Effects
House Budget Committee Chairman Paul Ryan’s budget plan includes cuts in the Supplemental Nutrition Assistance Program (SNAP, formerly known as the Food Stamp Program) of $137 billion — 18 percent — over the next ten years (2015-2024),[1] which would necessitate ending food assistance for millions of low-income families, cutting benefits for millions of such households, or some combination of the two. Chairman Ryan proposed similarly deep SNAP cuts in each of his last three budgets. The new Ryan budget specifies two categories of SNAP cuts:
- It includes every major benefit cut in a House-passed version of the recent farm bill that Congress ultimately rejected when enacting the final farm bill.[2] The Congressional Budget Office (CBO) has estimated the House cuts, which amount to $12 billion over the 2015-2018 period, would have terminated benefits to 3.8 million low-income people in 2014. After a difficult two-year process, Congress just two months ago, on a bipartisan basis, passed a farm bill that rejected these House cuts and reauthorized and SNAP and other Agriculture programs for five years.
- It would convert SNAP into a block grant beginning in 2019 and cut funding steeply -- by $125 billion (or almost 30 percent) over 2019 to 2024. States would be left to decide whose benefits to reduce or terminate. They would have no good choices — the program already provides an average of only $1.40 per person per meal, primarily to poor children, working-poor parents, seniors, people with disabilities, and others struggling to make ends meet.
Ryan Block Grant Would Force States to Cut Food Assistance Deeply
Since 90 percent of SNAP spending goes for food assistance, and most of the rest covers state administrative costs to determine program eligibility and operate SNAP properly, policymakers couldn’t achieve cuts of this magnitude without substantially scaling back eligibility or reducing benefits deeply, with serious effects on low-income families and individuals.[3] Table 1 provides state-by-state estimates of the potential impact of the block grant proposal.
- Cuts in eligibility. If the cuts came solely from eliminating eligibility for categories of currently eligible households or individuals, states would have to cut an average of 10 million people from the program (relative to SNAP enrollment without the cuts) each year between 2019 and 2024.[4]
- Cuts in benefits. If the cuts came solely from across-the-board benefit cuts, states would have to cut more than $40 per person per month in 2019 to 2024 (in nominal dollars), on average. This would require setting the maximum benefit at about 77 percent of the Thrifty Food Plan, the Agriculture Department’s (USDA) estimate of the cost of a bare-bones, nutritionally adequate diet. (Under SNAP rules, the maximum benefit — which goes to households with no disposable income after deductions for certain necessities — is set at 100 percent of the cost of the Thrifty Food Plan.)[5]
The impact of such a change would be pronounced. All families of four — including the poorest — would face benefit cuts of about $160 a month in fiscal year 2019, or more than $1,900 per year. All families of three would face cuts of about $125 per month, or about $1,500 per year. Of course, policymakers could shield some households from such deep cuts, but then other households would need to bear even larger cuts in order to produce the $125 billion in block-grant savings.
While states might not seek to hit the Ryan targets through eligibility cuts or benefit cuts alone, these examples illustrate the magnitude of the reductions needed. States would have few other places to achieve the required cuts; as noted, about 90 percent of SNAP expenditures are for food assistance.
Proposed Cuts Rest on Inaccurate Claims
Chairman Ryan bases his proposed SNAP cuts on a series of inaccurate claims about SNAP program growth, work disincentives, and waste, fraud, and abuse.
- Spending growth. Chairman Ryan justifies deep SNAP cuts in part by claiming that the “explosive growth [of SNAP and other low-income programs] is threatening the overall strength of the safety net ” and “SNAP spending is forecast to be permanently higher than previous estimates even after the recession is long past.”[6] While SNAP spending did grow substantially during the recession, it has begun to decline as a share of the economy and is expected to continue shrinking over the coming decade. Image
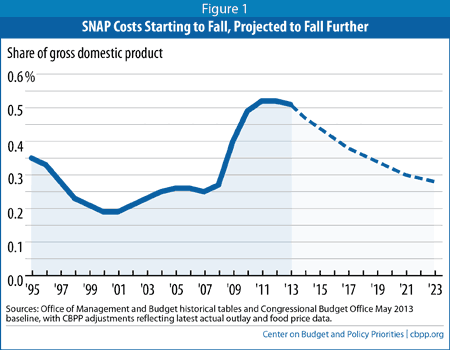
SNAP grew because of three factors: the depth of the recent recession, which made more people eligible; improvements in reaching eligible households (particularly working-poor families); and the 2009 Recovery Act’s temporary benefit boost (which ended in November 2013).[7] As Figure 1 indicates, CBO projects that SNAP will return to pre-recession levels as a share of the economy (gross domestic product) once the economy fully recovers. The program does not contribute to the nation’s long-term budget problem because it is projected to grow no faster than the economy over time.
- Work and dependency. Chairman Ryan also justifies cutting SNAP and turning it over to the states by implying that SNAP doesn’t encourage recipients to work. Yet the number of SNAP recipients who work while receiving SNAP has more than tripled over the past decade. Furthermore, CBPP analysis finds that the large majority of SNAP recipients who can work do so, and many more rely on SNAP when they are between jobs or looking for work.
Among SNAP households with at least one working-age, non-disabled adult, more than half work while receiving SNAP and more than 80 percent work in the year prior to or the year after receiving SNAP. The rates are even higher for families with children: more than 60 percent work while receiving SNAP, and almost 90 percent work in the prior or subsequent year. Only 4 percent of households that worked in the year before receiving SNAP did not work the following year.[8]
Moreover, SNAP already has work requirements. Adults without children face a harsh three-month time limit if they are unemployed and not participating in a qualifying employment and training program. States can apply for a waiver from this requirement during a weak economy when jobs are not available by submitting detailed Department of Labor data showing high unemployment in local areas or statewide, but the number of areas qualifying for a waiver is falling as the economy recovers, and CBO expects the number of such areas to shrink markedly over the next few years. (The Ryan budget would eliminate these waivers immediately, even for areas with double-digit unemployment.) In addition, states have broad authority to operate employment and training programs, and the recent farm bill includes a major demonstration program for states to test innovative approaches to providing employment and training services that raise recipients’ earnings and reduce their reliance on public assistance.
- Waste, fraud, and abuse. Finally, Chairman Ryan justifies his SNAP proposals based on charges that SNAP is rife with waste, fraud, and abuse. The reality is that SNAP has one of the most rigorous quality control systems of any public benefit program and a very low error rate. Despite the recent growth in caseloads, the share of total SNAP payments that represent overpayments or payments to ineligible households fell to a record low of 2.77 percent in fiscal year 2012. In addition, USDA has cut “trafficking” — the sale of SNAP benefits for cash, which violates federal law — by three-quarters over the past 15 years. Only 1.3 percent of SNAP benefits are trafficked. USDA has also permanently disqualified thousands of retail stores from the program for not following strict federal requirements. When cases of SNAP fraud are reported in the news, it is because the offenders have been caught, evidence that states and USDA are aggressively combating fraud.
Benefit Cuts Would Primarily Affect Low-Income Families With Children, Seniors, and People With Disabilities
The Ryan budget documents assert that Congress could achieve the required savings by capping federal SNAP funding and “allow[ing] states to customize SNAP to the needs of their citizens” through a block grant. That description leaves the mistaken impression that the program is not serving a population that is overwhelmingly poor and that savings could be achieved without significantly harming millions of vulnerable Americans.
Unlike most means-tested benefit programs, which are restricted to particular categories of low-income individuals, SNAP is broadly available to almost all households with very low incomes. Cutting SNAP thus would affect broad swaths of the low-income population. Currently, 46.8 million people receive SNAP to help them feed their families. Census data show that in 2012 (the latest year for which these data are available), 46.5 million Americans lived below the poverty line, and 64.8 million lived below 130 percent of the poverty line, SNAP’s gross income limit.[9]
- The overwhelming majority of SNAP households are families with children, seniors, or people with disabilities. Seventy percent of SNAP participants are in families with children; more than one-quarter are in households that include senior citizens or people with disabilities.
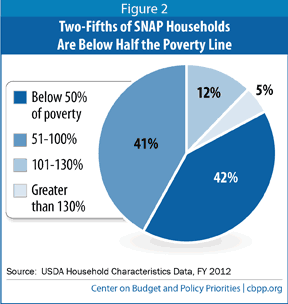
- SNAP households have very low incomes. Eighty-three percent of SNAP households have incomes below the poverty line while they are receiving SNAP assistance (about $19,800 for a family of three in 2014). Such households receive 91 percent of SNAP benefits. Two of every five SNAP households have incomes below half of the poverty line. (See Figure 2.) Such individuals and families have little flexibility in their monthly budgets to cope with deep reductions in food assistance.
- Low-wage workers rely on SNAP to boost their monthly income. Millions of Americans live in working households with earnings that are not sufficient to meet basic needs. In 2012, some 39 million people (1 in 8 Americans) lived in a working family with cash income below 130 percent of the poverty line.[10] Low incomes like these — which typically reflect low wages or limited work hours — can leave families unable to afford necessities like food and housing on a regular basis. SNAP benefits play a crucial role in boosting such families’ monthly resources: in 2012, a typical working mother with two children on SNAP earned $1,148 per month ($13,700 on an annual basis) and received $307 per month in SNAP benefits.[11] If the Ryan proposal had been in place in 2012 and was implemented via across-the-board cuts, this family’s monthly benefits would have been cut by $110 per month — or about 36 percent.
SNAP Benefit Cuts Would Increase Hunger and Poverty
SNAP cuts of the magnitude that the Ryan budget proposes would almost certainly lead to increases in hunger and poverty. Emergency food providers report that more people ask for help in the latter half of the month, after their SNAP benefits run out. Under the Ryan budget’s steep funding cuts, a typical household’s SNAP benefits would run out many days earlier, placing greater strain on household finances (and on emergency food providers) and significantly increasing the risk of hunger.
Deep SNAP cuts also would cause more families and individuals to fall into poverty and push poor families deeper into poverty. Currently, SNAP helps lessen the extent and severity of poverty; Census Bureau data on disposable family income that include the value of SNAP and other non-cash benefits and taxes show that:
- SNAP lifted 4.9 million Americans above the poverty line in 2012, including 2.2 million children.[12]
- SNAP kept more children — 1.4 million — from falling below half of the poverty line in 2012, more than any other program.[13]
The Ryan SNAP cuts would thus have a sharp, adverse effect on millions of the lowest-income Americans. Moreover, they would not occur in isolation. The Ryan budget contains steep cuts in other low-income assistance programs, compounding the effects of the SNAP cuts. Many vulnerable families would lose health coverage, housing assistance, and other important supports such as child care at the same time they faced SNAP cuts.
Cuts Could Be Even Larger Under a Block Grant
Block-granting SNAP, as Chairman Ryan proposes, would eliminate its ability to respond automatically to the increased need that results from rising poverty and unemployment during economic downturns. Annual federal funding would remain fixed, regardless of whether the economy was in a recession or how severe a downturn was. As a result, the House Budget Committee staff’s estimate that the Ryan plan would cut SNAP by $137 billion over ten years may understate the magnitude of the cut — the cuts would be still more severe if the economy performs less well over the coming decade than CBO projects.
If a SNAP block grant had been in effect in 2013 at funding levels set in 2007, before the recession, federal funding in 2013 would have been about 50 percent below actual funding that year (excluding the Recovery Act benefit boost).
Furthermore, under a block grant, SNAP would not be able to respond to natural disasters. Hurricane Sandy victims in New York and New Jersey obtained temporary food aid through SNAP in 2013, as did victims of disasters in five other states.
Also, under a block grant, many states would likely shift funds away from food assistance to other purposes when they faced large state budget shortfalls. SNAP includes several non-food components, such as job training and related child care; a block grant structure would enable states to divert funds away from food to these purposes and withdraw state funds currently spent on these services.
Finally, because of its capped funding structure, a block grant like the one Chairman Ryan proposes would reverse the recent progress made, on a bipartisan basis, to improve SNAP participation among eligible low-income households. Viewing SNAP as an important work support and health and nutrition benefit, the last three Administrations, as well as governors from across the political spectrum, have sought to boost participation rates — especially among working-poor families and low-income elderly people, the two groups with the lowest participation rates. Overall, the efforts have paid off. SNAP reached 79 percent of all eligible individuals in a typical month in 2011 (the most recent year for which these data are available), a significant improvement from 2002, when the participation rate bottomed out at 54 percent. Participation among eligible low-income working families rose from 43 percent in 2002 to about 67 percent in 2011. For the elderly, it improved more modestly — from 26 percent in 2002 to about 39 percent in 2011.
| Table 1 Illustrative State-by-State Impact of the Ryan Budget's SNAP Block Grant Cuts | |
| State/Territory | Proportional Distribution of Ryan’s SNAP Block Grant Cuts Over Fiscal Years 2019-2024 (in billions of dollars)1 |
| Alabama | -$2.08 |
| Alaska | -$0.28 |
| Arizona | -$2.43 |
| Arkansas | -$1.08 |
| California | -$11.13 |
| Colorado | -$1.21 |
| Connecticut | -$1.04 |
| Delaware | -$0.35 |
| District of Columbia | -$0.35 |
| Florida | -$8.70 |
| Georgia | -$4.70 |
| Guam | -$0.17 |
| Hawaii | -$0.73 |
| Idaho | -$0.51 |
| Illinois | -$4.97 |
| Indiana | -$2.15 |
| Iowa | -$0.86 |
| Kansas | -$0.70 |
| Kentucky | -$1.96 |
| Louisiana | -$2.18 |
| Maine | -$0.54 |
| Maryland | -$1.74 |
| Massachusetts | -$2.05 |
| Michigan | -$4.29 |
| Minnesota | -$1.14 |
| Mississippi | -$1.46 |
| Missouri | -$2.10 |
| Montana | -$0.28 |
| Nebraska | -$0.39 |
| Nevada | -$0.79 |
| New Hampshire | -$0.24 |
| New Jersey | -$2.09 |
| New Mexico | -$1.00 |
| New York | -$8.28 |
| North Carolina | -$3.67 |
| North Dakota | -$0.13 |
| Ohio | -$4.30 |
| Oklahoma | -$1.41 |
| Oregon | -$1.84 |
| Pennsylvania | -$4.05 |
| Rhode Island | -$0.45 |
| South Carolina | -$2.04 |
| South Dakota | -$0.24 |
| Tennessee | -$3.13 |
| Texas | -$8.74 |
| Utah | -$0.56 |
| Vermont | -$0.22 |
| Virginia | -$2.12 |
| Virgin Islands | -$0.08 |
| Washington | -$2.47 |
| West Virginia | -$0.74 |
| Wisconsin | -$1.76 |
| Wyoming | -$0.08 |
| Other SNAP spending | -$13.00 |
| United States | -$125.00 |
| Note: The total cut to the SNAP program under the Ryan budget block grant proposal is $125 billion over fiscal years 2019 to 2024. More than 90 percent of SNAP expenditures are for food assistance benefits for low-income households. The remainder goes to the federal share of state administrative costs for the program, block grants for nutrition assistance in Puerto Rico and American Samoa, funds for commodities for The Emergency Food Assistance Program (TEFAP), and funding for the Food Distribution Program on Indian Reservations (FDPIR). We assume those other activities would bear a proportional share of the cuts ($13 billion). This is a conservative estimate of the share that would come from SNAP benefit reductions because, in the past, Congress has favored these other activities and not looked to them for substantial budget cuts. Under these assumptions, SNAP benefits would need to be cut by $112 billion over the period. The $112 billion in benefit cuts were distributed across the states in accordance with each state’s percentage share of total fiscal 2013 SNAP benefits. Due to rounding, the state-by-state benefit amounts may not add precisely to the total. | |
End Notes
[1] House Budget Committee staff provided this figure verbally in response to a question from Rep. Gwen Moore during the mark-up of the proposed budget resolution on April 2, 2014.
[2] House Budget Committee, The Path to Prosperity, Fiscal Year 2015 Budget Resolution, House Budget Committee, April 1, 2014, p. 62. The budget documents specify that $125 billion in cuts would come, beginning in 2019, from “converting SNAP into an allotment tailored for each state’s low-income population, indexed for inflation and eligibility.” The documents mention three additional policies, which would go into effect prior to the block grant: repealing “broad-based categorical eligibility,” eliminating state-option waivers from the three-month time limit for areas with high unemployment, and severing the link between SNAP and the Low Income Home Energy Assistance Program. The first two cuts were part of the SNAP bill the House passed in September 2013; the third was part of a budget reconciliation bill the House passed in 2012. For more information about these policies see: Dottie Rosenbaum, Stacy Dean, and Robert Greenstein, “Cuts Contained in SNAP bill Coming to House Floor Would Affect Millions of Low-income Americans,” revised September 17, 2013, https://www.cbpp.org/cms/index.cfm?fa=view&id=4009.
[3] More than 90 percent of SNAP expenditures are for food assistance benefits for low-income households. The rest goes to the federal share of state administrative costs for SNAP, block grants for nutrition assistance in Puerto Rico and American Samoa, employment and training and nutrition education services for SNAP households, commodities for The Emergency Food Assistance Program (TEFAP), and the Food Distribution Program on Indian Reservations (FDPIR). For purposes of this analysis, we assume those other activities would bear a proportional share of the cuts. As a result, we assume that SNAP benefits would be cut under the block grant by $112 billion over the period. This is a conservative estimate; in the past, Congress has favored most of those other activities and not looked to them for large budget cuts. In addition, in past years during the Budget Committee mark-up, committee staff have indicated that under a block grant, states could cut benefits in order to fund other activities, such as job training. Thus, the cut to SNAP benefits could be deeper than this analysis assumes.
All estimates use CBO’s February 2014 baseline assumptions for SNAP outlays and CBO’s May 2013 detailed assumptions about the number of SNAP participants and average benefits. (CBO did not make detailed assumptions available for the February 2014 baseline, but the projections changed by less than 1 percent.) The eligibility and benefit cut estimates in this paper do not take into account the three policy proposals that House Budget Committee staff indicated were included in the $135 billion (see footnote 2). Rather, they are illustrative of the size of the cuts that the proposed block grant would require states to make.
[4] Estimates are relative to CBO’s SNAP participation projections and assume that on average, the individuals who would be cut would otherwise have received the average benefit.
[5] See USDA’s estimates of the monthly cost of the Thrifty Food Plan at: http://www.cnpp.usda.gov/usdafoodcost-home.htm. To estimate an across-the-board cut, we reduced the size of maximum benefits relative to the Thrifty Food Plan by 23 percent beginning in 2019.
[6] The Path to Prosperity: Fiscal Year 2015 Budget Resolution, House Budget Committee, April 1, 2014, p. 61.
[7] Dottie Rosenbaum and Brynne Keith-Jennings, “SNAP Costs Starting to Fall, Almost Certain to Fall Further,” Center on Budget and Policy Priorities, March 6, 2014, https://www.cbpp.org/cms/?fa=view&id=4054.
[8] Dottie Rosenbaum, “The Relationship Between SNAP and Work Among Low-income Households,” Center on Budget and Policy Priorities, January 29, 2013, https://www.cbpp.org/cms/index.cfm?fa=view&id=3894.
[9] Under federal rules, a household’s monthly income must be at or below 130 percent of the poverty line — or roughly $2,116 a month (about $25,000 a year) for a family of three in 2014 — to qualify. There are some exceptions; for example, households with seniors and people with disabilities are not subject to the gross income test but must have net income (after deductions for certain necessary expenses) at or below 100 percent of the poverty line. States have some flexibility to lift the gross income test for certain other households, while some categories of people are not eligible for SNAP regardless of how low their income and assets may be — such as workers on strike, certain legal immigrants and many college students, and all undocumented immigrants. Unemployed childless adults may receive SNAP benefits for only three months out of every three years, except in areas with high unemployment.
[10] The figures refer to working individuals and people in family units where one or more family members worked at some point during the year.
[11] These are the average earnings and SNAP benefit for a family of three with earnings and two children for fiscal year 2012, based on USDA Household Characteristics Data. The benefit boost from the American Recovery and Reinvestment Act (ARRA) ended in November 2013; this increase has been removed from the figures cited here to show what the typical working mother with two children would receive currently, as well as under Chairman Ryan’s budget plan.
[12] Based on CBPP analysis of the Supplemental Poverty Measure. See Kathleen S. Short, “The Research Supplemental Poverty Measure: 2012,” Bureau of the Census, November 2013, http://www.census.gov/prod/2013pubs/p60-247.pdf. The Census Bureau’s Supplemental Poverty Measure defines poverty as family income (cash income after taxes plus the value of SNAP and other food assistance, housing assistance, and energy assistance, minus out-of-pocket medical and work expenses) that falls below an updated poverty line. It uses a broader family unit that includes unmarried partners and foster children.
[13] Unpublished CBPP analysis of the March 2012 Current Population Survey using the Supplemental Poverty Measure.
More from the Authors