BEYOND THE NUMBERS
SNAP Spending Continued to Fall in 2016
SNAP spending fell for the third straight year in fiscal year 2016, new Treasury Department data show. This shows that SNAP (formerly food stamps) is working as designed: it expanded during the recession and its aftermath to meet increased need, and has fallen as the economy has improved.
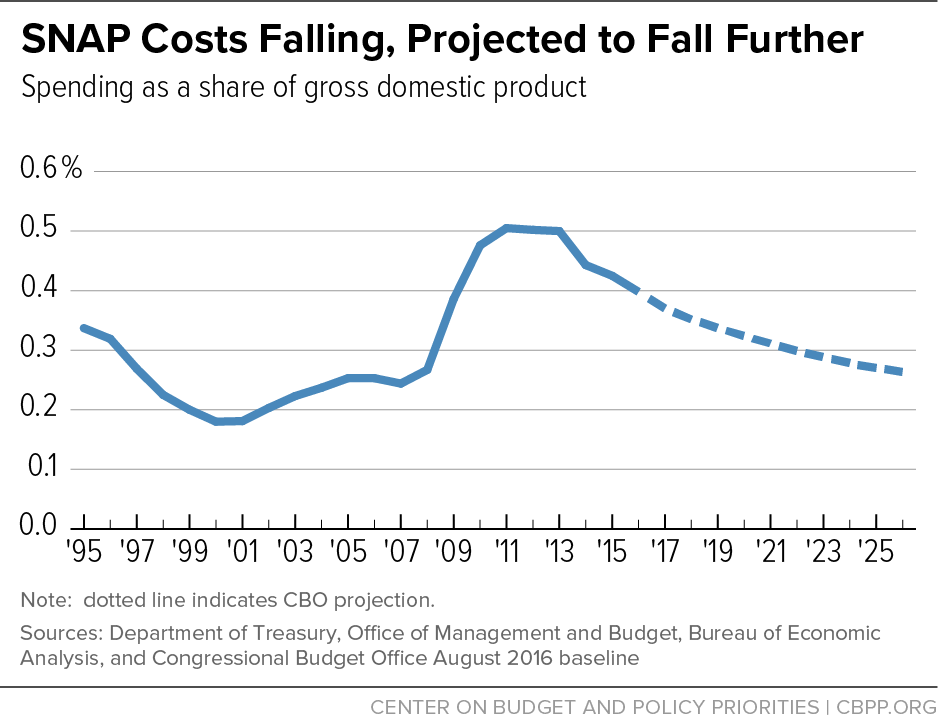
Falling caseloads and low food price inflation caused SNAP spending to drop 4 percent in 2016, bringing it to its lowest point since 2010 and more than 11 percent below 2013 levels. (These figures refer to nominal spending, not adjusted for inflation.) Spending on the program has also fallen as a share of the economy (gross domestic product or GDP) for five years. The Congressional Budget Office expects SNAP spending to continue to fall as a share of the economy in the coming years, reaching 1995 levels in 2019. (See figure.) These trends show that SNAP isn’t contributing to long-term budgetary pressures.
SNAP caseloads grew during the recession as more people became eligible for SNAP and states worked to increase participation rates among those eligible. A SNAP benefit increase enacted as part of the 2009 Recovery Act also caused a temporary rise in SNAP spending in April 2009-October 2013. Caseloads and costs have fallen as the economy has improved: as of July 2016, 4.4 million fewer people participated in SNAP than in December 2012, the highest month of participation.
The re-introduction in many states of the three-month time limit on SNAP benefits for unemployed adults without children in the household also affected 2016 spending. CBPP estimates that more than half a million individuals are losing SNAP benefits over the course of this year.