BEYOND THE NUMBERS
Latest Data: 1 in 3 Adults Having Trouble Paying Expenses
Nearly 78 million adults – about 1 in 3 – are having trouble paying for usual household expenses, today’s Census data show. Along with other data showing that hardship has significantly worsened due to COVID-19 and its economic fallout, the figures underscore the urgent need for policymakers to resume negotiations — which the President ended abruptly yesterday — and enact a robust, bipartisan economic relief package.
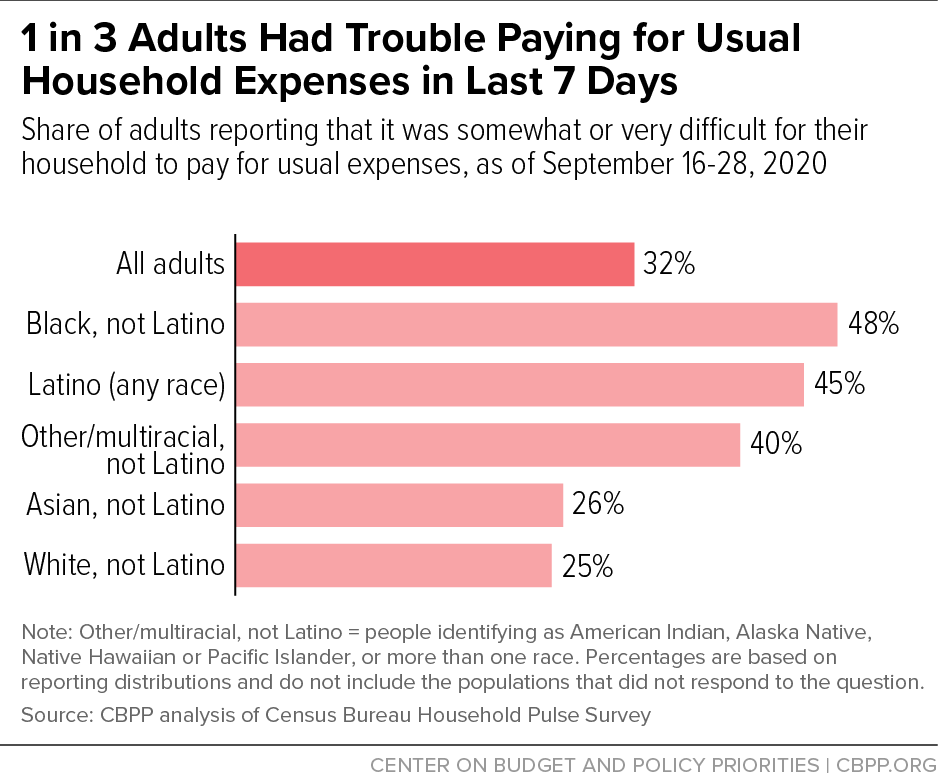
The data, from Census’s latest Household Pulse Survey (collected September 16-28), show that 32 percent of adults reported that, in the last seven days, their household found it somewhat or very difficult to cover expenses such as food, rent or mortgage, car payments, medical expenses, or student loans. The rate was higher for adults in households with children (40 percent) than adults in households without children (27 percent), the Census figures show — which is consistent with findings from the same survey that households with children are likelier to face difficulty getting enough food and paying their rent. Financial hardship can have serious effects on children’s long-term health and education, research shows.
Reflecting longstanding inequities— often stemming from structural racism — in education, employment, housing, and health care that the current crisis is exacerbating, nearly half of Black (48 percent) and Latino (45 percent) adults reported difficulty paying for usual expenses, compared to 25 percent of white adults. (See graphic.) Although the survey doesn’t provide data for other individual racial groups, the rate was 40 percent for American Indian, Alaska Native, Native Hawaiian, Pacific Islander, and multiracial adults taken together.
In every state, more than 1 in 5 adults reported difficulty paying for household expenses. (See Table 1.) To improve the accuracy of the state estimates, we average Household Pulse Survey data collected September 2-14 and September 16-28.
While we don’t have comparable data from before the pandemic, data on food hardship indicate that economic insecurity has increased. In late September, 10 percent of adults reported that their household sometimes or often had “not enough to eat” in the last seven days. This was several times the pre-pandemic rate: 3.7 percent of adults reported that their household had “not enough to eat” at some point over the full 12 months of 2019.
Today’s Pulse survey data also provide other important insights, as we’ve detailed in our updated fact sheet on hardship:
- Some 9 to 14 percent of adults with children reported that their children didn’t eat enough in the last seven days because they couldn’t afford it. (The 9-14 percent range reflects the different ways to measure food hardship in the Household Pulse Survey.)
- Between 7 and 11 million children live in a household where children didn’t eat enough because the household couldn’t afford it, according to detailed Household Pulse data for September 2-14.
- Nearly 1 in 6 adult renters — 11 million, after adjusting for underreporting in the Pulse survey — reported that they lived in a household that wasn’t caught up on rent.
- Renters of color are likelier to report difficulty affording rent: 23 percent of Black, 20 percent of Asian, and 19 percent of Latino renters said they weren’t caught up on rent, compared to 10 percent of white renters.
- More than 4 in 10 children living in rental housing live in a household that either isn’t getting enough to eat or isn’t caught up on rent, analysis of detailed Household Pulse data for September 2-14 shows.
| TABLE 1 | ||
|---|---|---|
| 1 in 3 Adults Nationwide Have Difficulty Covering Usual Household Expenses | ||
| Among adults; data collected September 2-28. | ||
| Difficulty Covering Usual Household Expenses | ||
| Number | Percent | |
| United States | 77,600,000 | 32% |
| Alabama | 1,171,000 | 33% |
| Alaska | 149,000 | 29% |
| Arizona | 1,805,000 | 33% |
| Arkansas | 710,000 | 33% |
| California | 10,032,000 | 35% |
| Colorado | 1,333,000 | 31% |
| Connecticut | 820,000 | 31% |
| Delaware | 216,000 | 30% |
| District of Columbia | 162,000 | 31% |
| Florida | 5,722,000 | 35% |
| Georgia | 2,736,000 | 36% |
| Hawai’i | 382,000 | 37% |
| Idaho | 379,000 | 29% |
| Illinois | 3,070,000 | 33% |
| Indiana | 1,387,000 | 28% |
| Iowa | 620,000 | 27% |
| Kansas | 592,000 | 28% |
| Kentucky | 1,044,000 | 32% |
| Louisiana | 1,304,000 | 40% |
| Maine | 257,000 | 25% |
| Maryland | 1,437,000 | 32% |
| Massachusetts | 1,397,000 | 27% |
| Michigan | 2,146,000 | 29% |
| Minnesota | 952,000 | 23% |
| Mississippi | 855,000 | 41% |
| Missouri | 1,266,000 | 28% |
| Montana | 213,000 | 27% |
| Nebraska | 347,000 | 25% |
| Nevada | 907,000 | 39% |
| New Hampshire | 262,000 | 25% |
| New Jersey | 2,178,000 | 33% |
| New Mexico | 590,000 | 39% |
| New York | 4,784,000 | 34% |
| North Carolina | 2,399,000 | 31% |
| North Dakota | 139,000 | 25% |
| Ohio | 2,694,000 | 31% |
| Oklahoma | 964,000 | 35% |
| Oregon | 951,000 | 30% |
| Pennsylvania | 2,561,000 | 27% |
| Rhode Island | 236,000 | 30% |
| South Carolina | 1,281,000 | 34% |
| South Dakota | 164,000 | 26% |
| Tennessee | 1,566,000 | 31% |
| Texas | 7,949,000 | 39% |
| Utah | 529,000 | 24% |
| Vermont | 108,000 | 23% |
| Virginia | 1,780,000 | 29% |
| Washington | 1,511,000 | 26% |
| West Virginia | 425,000 | 32% |
| Wisconsin | 997,000 | 23% |
| Wyoming | 118,000 | 28% |