BEYOND THE NUMBERS
House Republican “2.0” Tax Plan Favors Wealthiest, Makes Fiscal Problems Worse
Update, September 14: we’ve updated this post to incorporate new Tax Policy Center data on the plan’s cost estimate and its impact on different income groups.
The House is expected to vote this month on its “2.0” tax plan, which would double down on the 2017 tax law’s flaws by delivering substantially more tax cuts to high-income households than to those with low or moderate incomes, significantly increasing the nation’s long-term fiscal challenges, and creating opportunities for tax avoidance by wealthy filers. Its centerpiece is the permanent extension of the 2017 tax law’s individual provisions that are slated to expire after 2025. The 2.0 tax plan:
1. Ignores working-class wage stagnation and exacerbates inequality.
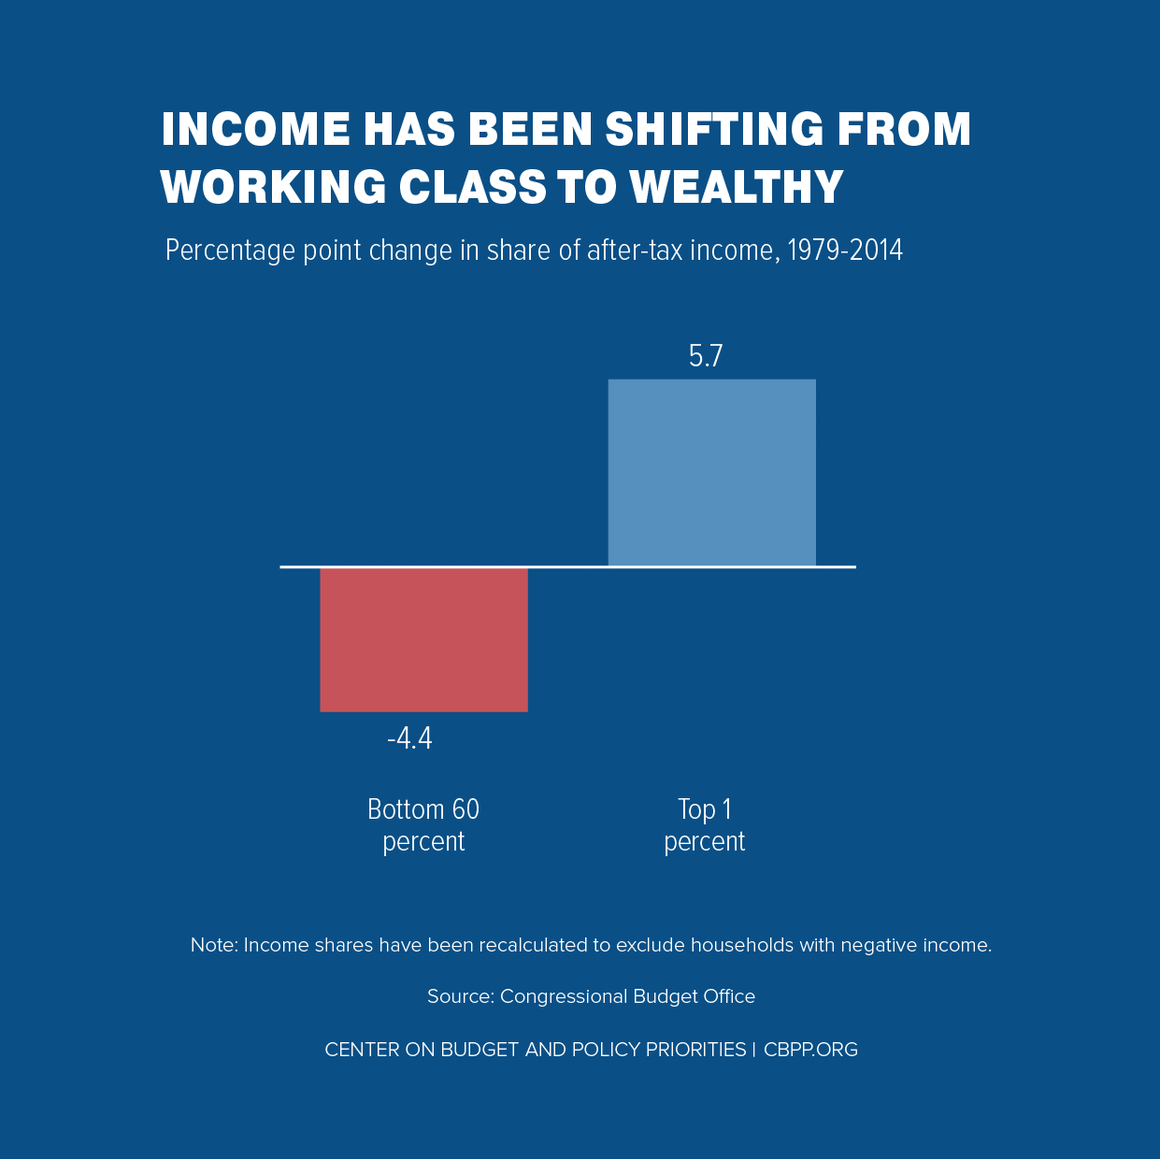
As the wages of working-class people across races have stagnated in recent decades while incomes rose dramatically for those at the top, income has shifted upward: the share of income flowing to the bottom 60 percent of households fell by 4.4 percentage points between 1979 and 2014, while the share flowing to the top 1 percent rose by 5.7 percentage points. (See Chart 1.)
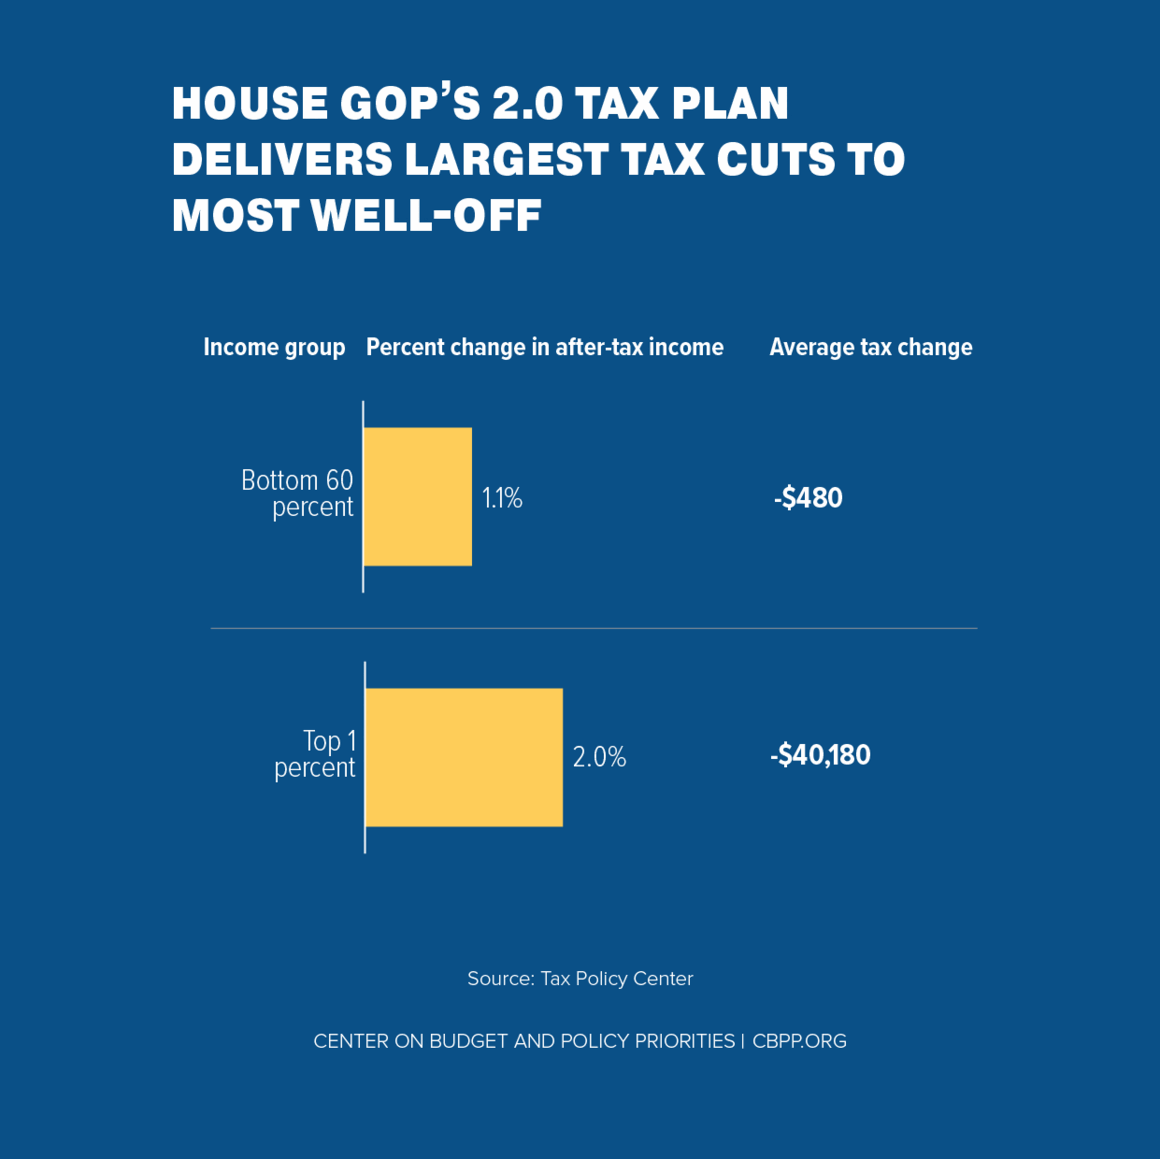
The 2.0 tax plan would exacerbate that trend by delivering about twice the after-tax income gain for the top 1 percent than it would for households in the bottom 60 percent. (See Chart 2.) It would give an average tax cut of $40,180 to households in the top 1 percent (those with incomes above $836,200 in 2026), raising their after-tax incomes by 2.0 percent, compared to an average tax cut of just $480 and a 1.1 percent boost in after-tax income for households in the bottom 60 percent (those with incomes below $95,000).
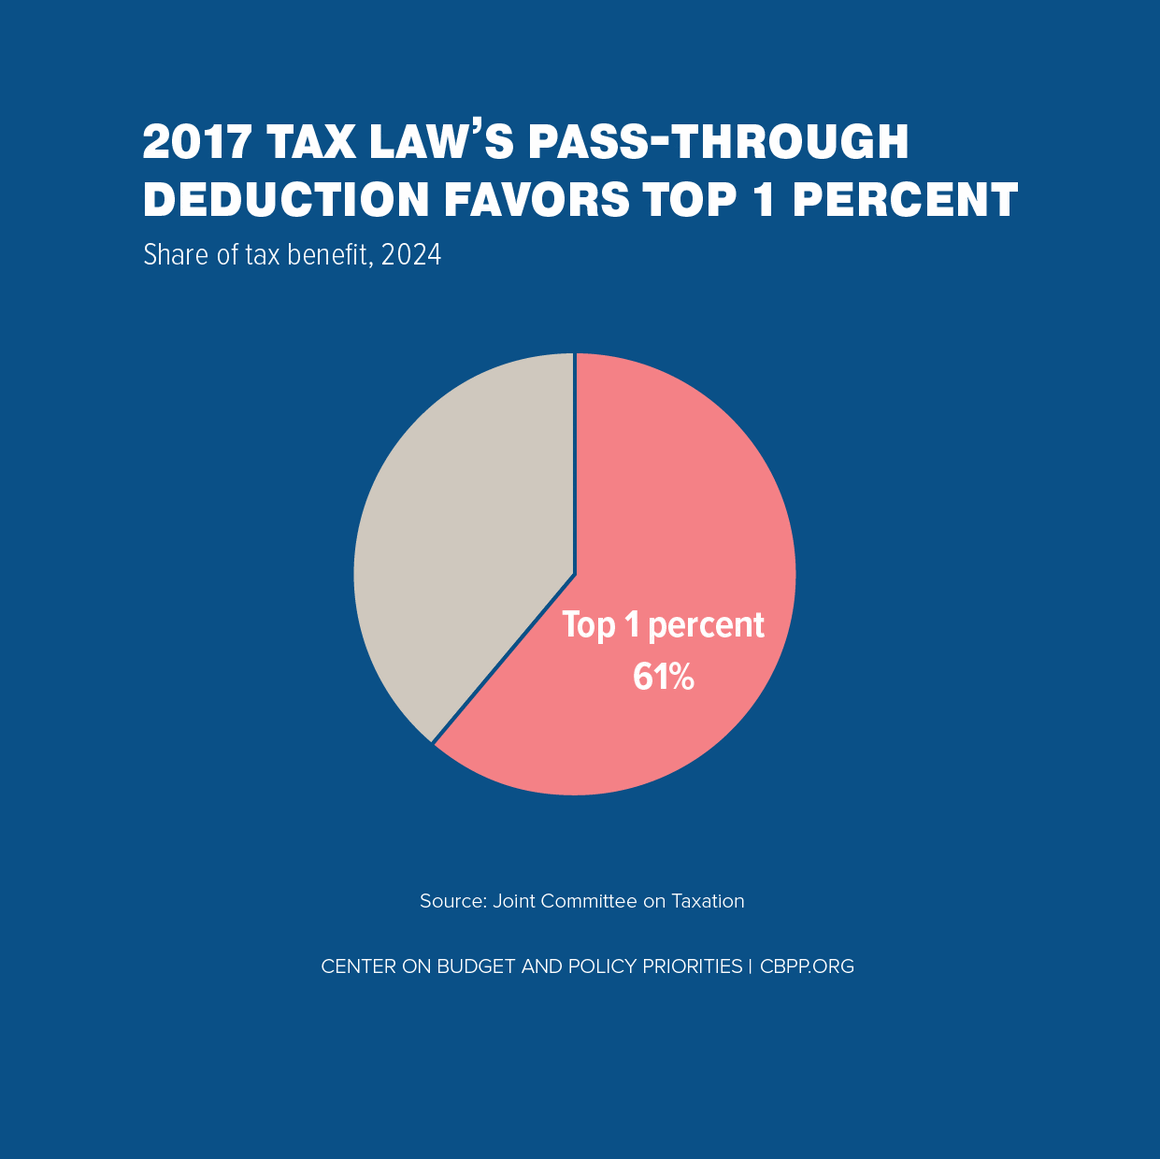
Furthermore, the 2.0 tax plan keeps in place the 20 percent deduction for pass-through income — the income that owners of businesses such as partnerships, S corporations, and sole proprietorships report on their individual tax returns. This deduction heavily benefits the wealthy: 61 percent of its benefits flow to the top 1 percent, according to the Joint Committee on Taxation. (See Chart 3.)
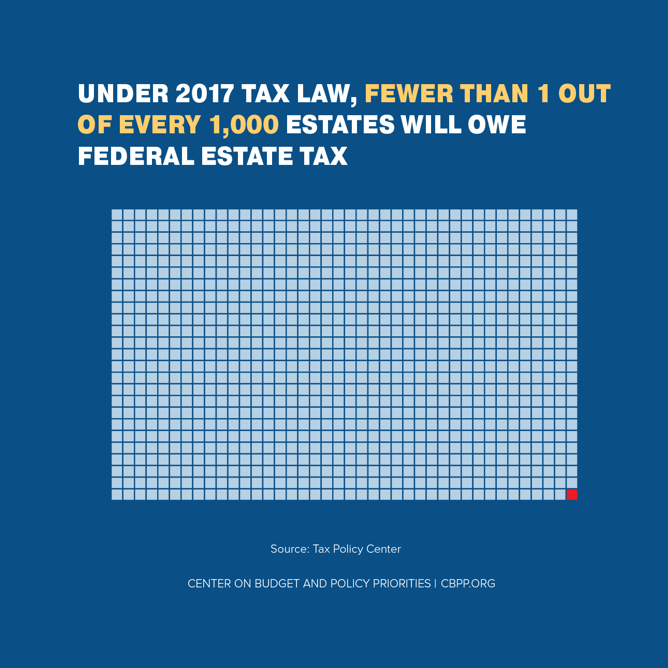
The plan also would make permanent a provision in the 2017 tax law that doubles the amount that the wealthiest households can pass on tax free to their heirs, from $11 million per couple to $22 million. The few estates large enough to remain taxable — those worth more than $22 million per couple — will receive a tax cut of $4.4 million apiece. (See Chart 4.)
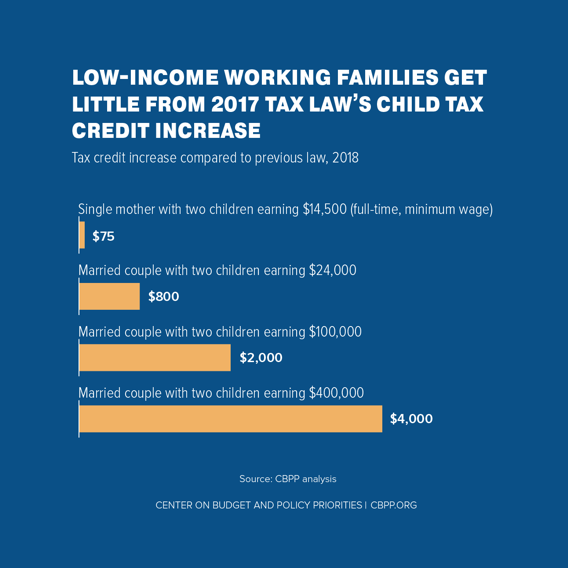
The benefits of the 2017 tax law’s individual provisions — and the 2.0 tax plan — are further skewed to the top because they don’t do much to help low- and moderate-income working-class families. Even the 2017 tax law’s widely touted increase in the Child Tax Credit (CTC) denies its full increase to 26 million children in families with parents who earn low wages. A single mother of two working full-time at the federal minimum wage as a home health aide, for instance, will get just a token $75 increase in her CTC while married couples with two children making $400,000 will qualify for a $4,000 CTC for the first time. (See Chart 5.)
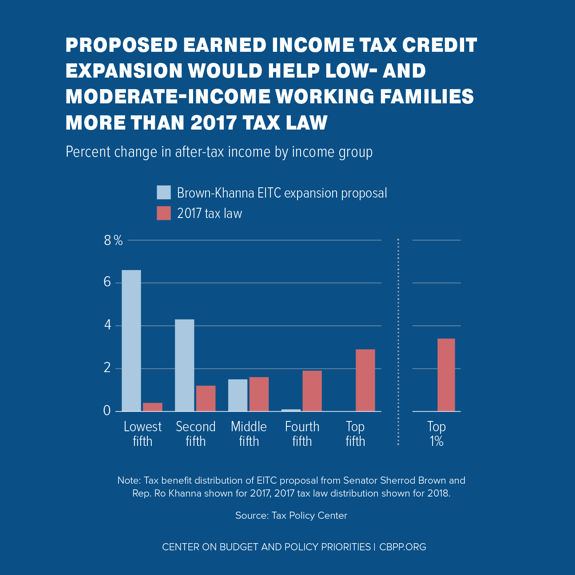
As the charts above show, the House GOP’s 2.0 tax plan — like the underlying 2017 tax law —ignores the decades-long trend of stagnant working-class wages and would exacerbate inequality, instead of helping to address these problems. That fundamental flaw is a key reason that policymakers should reject the 2.0 tax plan and restructure the 2017 tax law. Such a restructuring should include an expansion of the Earned Income Tax Credit (EITC), since it’s tailor-made to help offset stagnant working-class wages. Chart 6 shows how addressing these stagnant wages, as a proposal from Senator Sherrod Brown and Rep. Ro Khanna would do, would better help low- and moderate-income families.
2. Weakens revenues just as the retirement of baby boomers will drive spending higher.
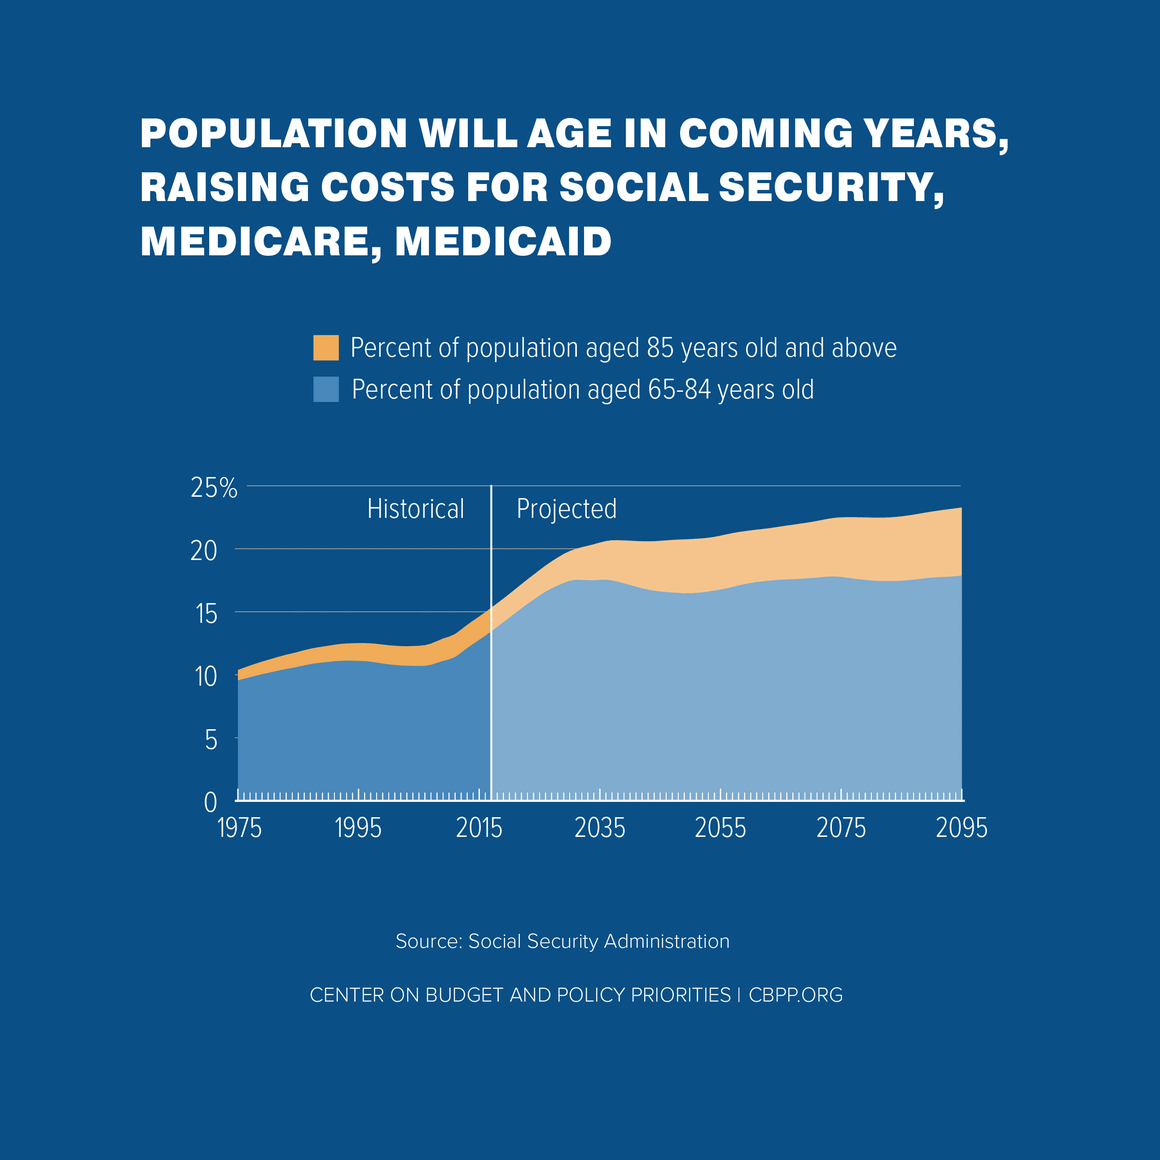
Federal spending will necessarily rise as a share of gross domestic product (GDP) over the next few decades due to several factors, the most significant of which is the aging of the population. Over the next two decades, people 65 or older will grow from 15 to 21 percent of the population. And the “old-old” population — those aged 85 and above, who have much higher health care costs than other elderly individuals — will grow even faster. This will increase spending on programs such as Social Security, Medicare, and Medicaid. (See Chart 7.)
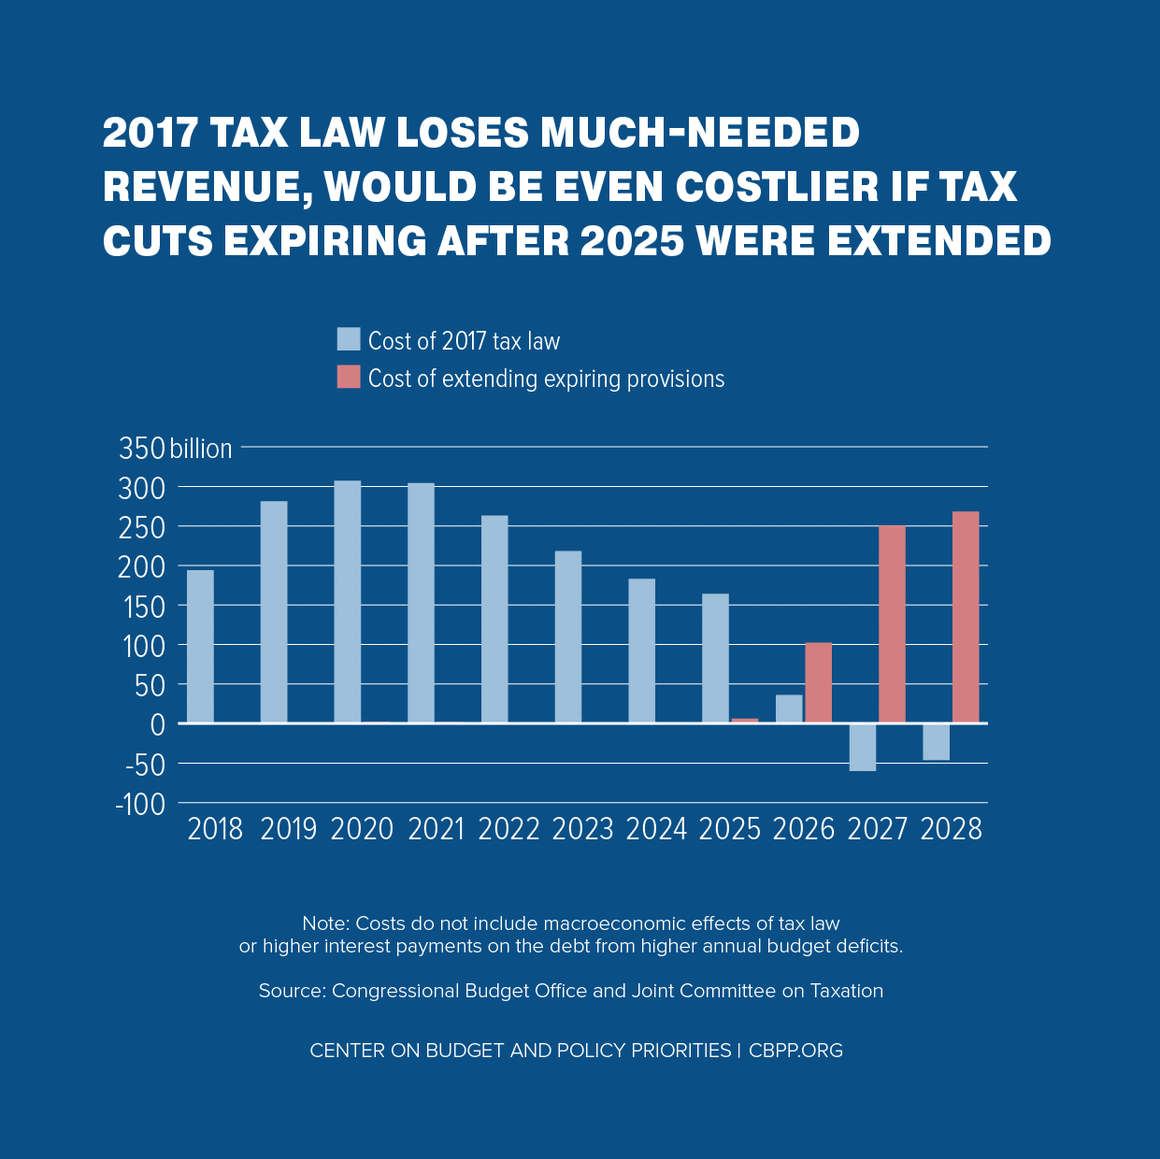
Making the individual tax provisions permanent would cost $631 billion from 2019 to 2028, but that cost estimate includes only the additional cost of extending the tax cuts for 2026, 2027, and 2028 and thus doesn’t reflect the true long-run cost (see Chart 8). Making the individual provisions permanent would cost $250 billion in 2027 alone, amounting to more than 0.8 percent of GDP. We estimate that the cost of making them permanent in the first ten years that it would be in effect (2026 to 2035) would be roughly $2.8 trillion and the cost of making them permanent in the decade after the traditional ten-year “budget window” for calculating the costs of tax legislation (that is, from 2029 to 2038) would be $3.2 trillion, according to the Tax Policy Center.
3. Invites rampant tax gaming and risks undermining the tax code.
True tax reform would simplify the tax code and narrow the gaps between how different types of income are taxed so that individuals and businesses base their decisions about how to invest or save their money on economics, not taxes. The 2.0 tax plan does the opposite by maintaining arbitrary distinctions between different kinds of income that the 2017 tax law introduced.
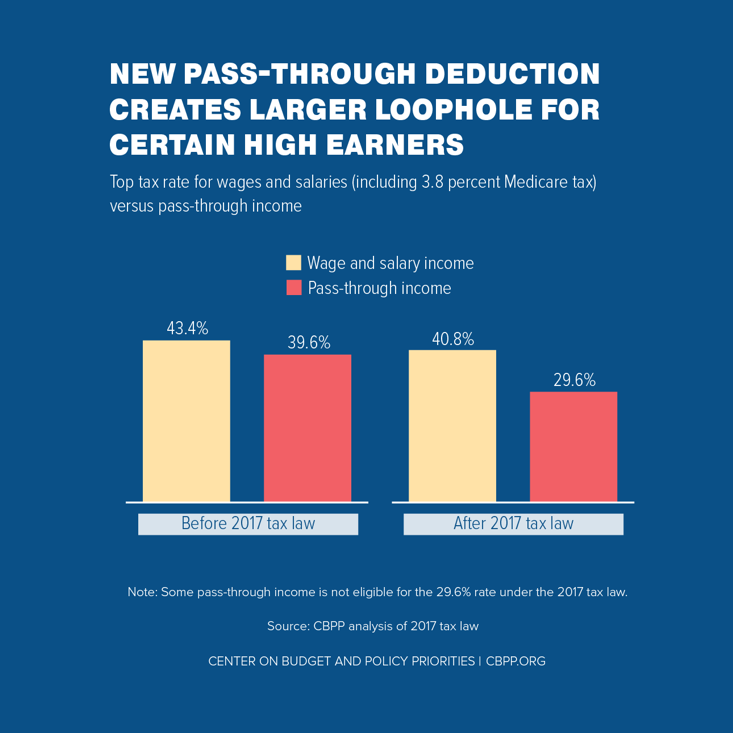
A prime example is the deduction for most forms of pass-through income, as described above. The deduction effectively means that certain pass-through income will face a lower tax rate than wages and salaries, which creates an incentive for high-income individuals to reclassify as much of their salaries as possible as pass-through income. (See Chart 9.)