BEYOND THE NUMBERS
ACA Medicaid Expansion Drove Large Drop in Uncompensated Care
Note: An updated version of this blog with more recent data can be found here.
Health coverage gains continued to drive down uncompensated care costs through 2016, according to the latest data from the Medicaid and CHIP Payment and Access Commission. Such costs have fallen significantly since the Affordable Care Act’s (ACA) major coverage expansions took effect, as we’ve reported. From 2013 to 2016, as the uninsured rate fell nationally from 14.5 to 8.6 percent (or by more than two-fifths), uncompensated care costs as a share of hospital operating expenses fell by 38 percent. This equates to nearly $22 billion in reduced uncompensated care costs in 2016 alone.
While uncompensated care costs fell in all states, states that expanded Medicaid to many more low-income adults under the ACA saw both larger coverage gains and larger drops in uncompensated care: a 55 percent fall in uncompensated care costs on average compared to an 18 percent fall in states that did not expand Medicaid (see table). More generally, declines were larger in states where uninsured rates fell more, with a roughly one-to-one relationship between percent declines in uninsured rates and in uncompensated care costs as a share of hospital operating expenses. (See figure.)
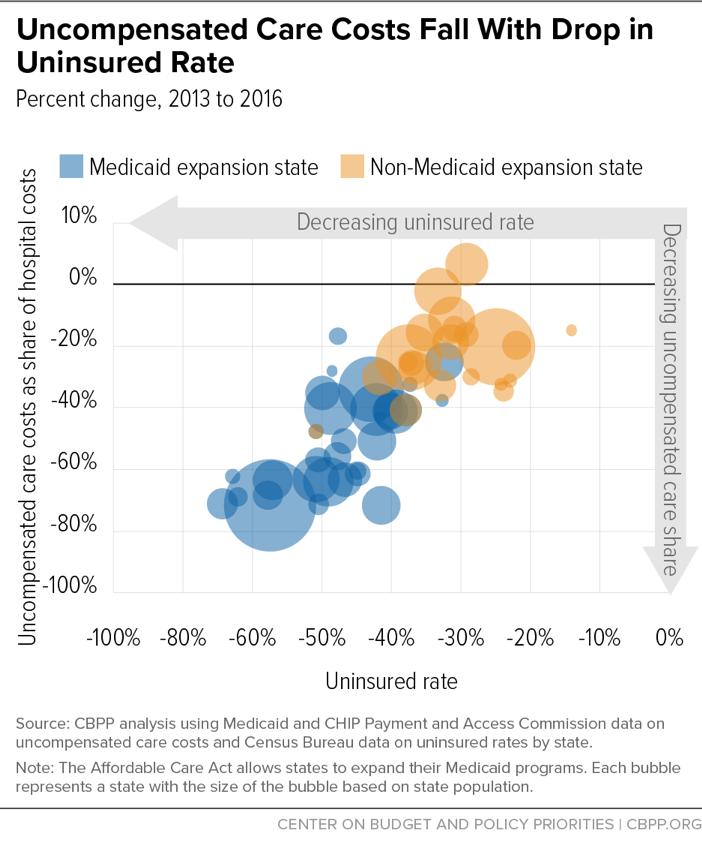
The relationship between uninsured rate declines and uncompensated care drops was stronger in expansion states, likely because Medicaid serves the most financially vulnerable who are least able to pay medical bills when uninsured, thus leading to hospital uncompensated care costs.
Less uncompensated care benefits patients, hospitals, and state budgets. While uncompensated care costs are bills that patients don’t pay up front, they (1) lead to medical debt, which hospitals may seek to collect even from very low-income patients; (2) become part of patients’ credit history, reducing their access to loans; and (3) can sometimes lead people to declare bankruptcy. Meanwhile, uncompensated care costs burden hospitals, making it harder for them to invest in new technologies or equipment, maintain needed capacity to serve patients, or even keep their doors open. Finally, uncompensated care costs burden state budgets, because many states cover a portion of these costs, at least for public hospitals and other safety net providers.
The most recent data show that the uninsured rate and uncompensated care costs fell in tandem in 2016, dropping 9 percent and 12 percent respectively (in addition to the declines that occurred between 2013 and 2015).
But the share of people without health insurance coverage has risen slightly since 2016, according to the Census Bureau. That’s at least partly due to Trump Administration efforts to weaken health coverage programs, such as by cancelling most federal outreach about ACA marketplace coverage, supporting new state policies that make it harder for people to enroll or stay enrolled in Medicaid, and taking a harsh anti-immigrant stance that has sown widespread fear and confusion in immigrant communities, likely increasing uninsured rates in families that include immigrant members because some of them may fear the immigration-related consequences of signing up for Medicaid and other public services. Meanwhile, the Administration is supporting a lawsuit by Republican state officials urging the courts to overturn the entire ACA. Such a ruling almost certainly would cause uncompensated care costs to jump.
| TABLE 1 | ||||||
|---|---|---|---|---|---|---|
| Uncompensated Care Costs Fall as Uninsured Rate Falls | ||||||
| State | Medicaid expansion status as of July 2016 | Uncompensated Care Costs as Share of Hospital Budgets | % Change in uninsured rate, 2013 to 2016 | |||
| 2013 | 2016 | % change, 2013 to 2016 | $ change, 2013 to 2016 (in millions, $2016) |
|||
| United States | 5.8% | 3.6% | -38% | -21,578 | -41% | |
| Medicaid expansion states | 31 | 5.1% | 2.3% | -55% | -17,931 | -49% |
| Non expansion states | 20 | 7.3% | 6.0% | -18% | -4,426 | -31% |
| Alabama | 6.7% | 4.5% | -33% | -251 | -33% | |
| Alaska | 5.3% | 3.6% | -32% | -50 | -24% | |
| Arizona | y | 6.7% | 1.9% | -72% | -779 | -42% |
| Arkansas | y | 6.3% | 2.7% | -57% | -255 | -51% |
| California | y | 5.3% | 1.5% | -72% | -4,577 | -58% |
| Colorado | y | 5.7% | 2.1% | -63% | -549 | -47% |
| Connecticut | y | 4.1% | 1.8% | -56% | -266 | -48% |
| Delaware | y | 3.1% | 2.1% | -32% | -34 | -37% |
| District of Columbia | y | 2.6% | 1.5% | -43% | -55 | -42% |
| Florida | 8.9% | 6.8% | -24% | -1,038 | -38% | |
| Georgia | 8.4% | 7.4% | -11% | -241 | -31% | |
| Hawaii | y | 1.6% | 1.3% | -17% | -10 | -48% |
| Idaho | 4.5% | 3.4% | -25% | -50 | -38% | |
| Illinois | y | 6.0% | 3.6% | -40% | -975 | -49% |
| Indiana | y | 6.7% | 3.3% | -51% | -776 | -42% |
| Iowa | y | 4.9% | 2.4% | -51% | -229 | -47% |
| Kansas | 3.8% | 3.2% | -16% | -55 | -29% | |
| Kentucky | y | 6.6% | 1.9% | -71% | -677 | -64% |
| Louisiana | y | 7.1% | 4.2% | -41% | -403 | -38% |
| Maine* | 4.7% | 3.3% | -30% | -81 | -29% | |
| Maryland | y | 5.3% | 3.1% | -41% | -354 | -40% |
| Massachusetts | y | 2.5% | 1.9% | -25% | -184 | -32% |
| Michigan | y | 4.1% | 1.5% | -63% | -848 | -51% |
| Minnesota | y | 2.2% | 1.4% | -35% | -142 | -50% |
| Mississippi | 7.9% | 6.8% | -14% | -88 | -31% | |
| Missouri | 5.7% | 4.6% | -19% | -233 | -32% | |
| Montana | y | 5.0% | 2.6% | -48% | -99 | -51% |
| Nebraska | 5.1% | 3.3% | -35% | -122 | -24% | |
| Nevada | y | 7.3% | 2.8% | -61% | -277 | -45% |
| New Hampshire | y | 6.1% | 2.4% | -60% | -174 | -45% |
| New Jersey | y | 6.3% | 3.7% | -41% | -630 | -39% |
| New Mexico | y | 8.1% | 2.3% | -71% | -330 | -51% |
| New York | y | 5.0% | 3.3% | -34% | -1,268 | -43% |
| North Carolina | 6.8% | 6.6% | -2% | -41 | -33% | |
| North Dakota | y | 3.5% | 2.2% | -38% | -53 | -33% |
| Ohio | y | 5.6% | 2.0% | -64% | -1,637 | -49% |
| Oklahoma | 6.5% | 5.2% | -20% | -138 | -22% | |
| Oregon | y | 5.4% | 1.7% | -68% | -454 | -58% |
| Pennsylvania | y | 3.2% | 1.9% | -41% | -595 | -42% |
| Rhode Island | y | 5.3% | 2.0% | -62% | -121 | -63% |
| South Carolina | 9.3% | 6.8% | -27% | -324 | -37% | |
| South Dakota | 3.5% | 2.4% | -31% | -47 | -23% | |
| Tennessee | 5.6% | 4.7% | -16% | -152 | -35% | |
| Texas | 10.2% | 8.1% | -20% | -1,454 | -25% | |
| Utah | 6.0% | 4.5% | -25% | -111 | -37% | |
| Vermont | y | 2.4% | 1.7% | -28% | -16 | -49% |
| Virginia* | 6.3% | 6.7% | 7% | 86 | -29% | |
| Washington | y | 4.7% | 1.7% | -64% | -639 | -57% |
| West Virginia | y | 6.8% | 2.1% | -69% | -297 | -62% |
| Wisconsin | 2.9% | 2.0% | -30% | -178 | -42% | |
| Wyoming | 7.2% | 6.1% | -15% | -18 | -14% | |