BEYOND THE NUMBERS
A War on Poverty Success: Safety Net Cuts Child Poverty
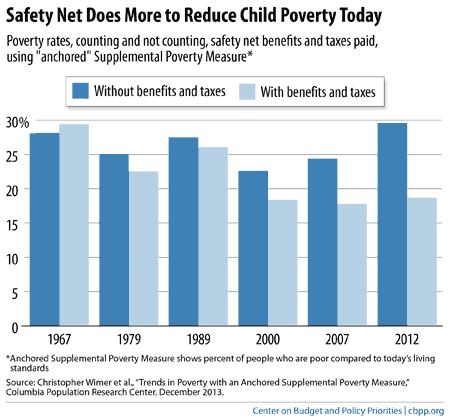
The child poverty rate fell from 29 percent in 1967 to 19 percent in 2012, according to data from researchers at Columbia University. A key reason: the safety net became increasingly effective at lifting children out of poverty, as we illustrate in our new chart book.
The chart below shows how much more the safety net does to reduce child poverty today than it did five decades ago. In 1967, the safety net did very little to reduce child poverty. In fact, low-income Americans paid more in taxes than they received in safety net benefits, thus increasing rather than decreasing child poverty on balance.
The story in 2007, before the Great Recession, was very different: the safety net cut child poverty from 24 percent of children to 18 percent. In 2012, it did even more, shrinking child poverty from 30 percent to 19 percent. (The figures use a new measure of poverty, the “anchored Supplemental Poverty Measure,” which counts both cash and non-cash benefits, subtracts necessary medical and work expenses from income, and compares income to a modernized 2012 poverty line adjusted for inflation.)
Medicaid and the Children’s Health Insurance Program (CHIP) have played particularly important roles in supporting low-income children and their families. Over the past 15 years, Medicaid’s expansions and CHIP’s creation have further reduced the share of children who are uninsured. By 2012, the uninsured rate among children had fallen to 8.9 percent, a historic low and 25 percent below the 1999 level.
Click here for the full chart book.