BEYOND THE NUMBERS
2014’s Historic Gain in Health Coverage
The 2.9 percentage-point decline in 2014 in the share of Americans who are uninsured — and the 8.8 million decline in the number of uninsured — mark the largest single-year reductions on record.
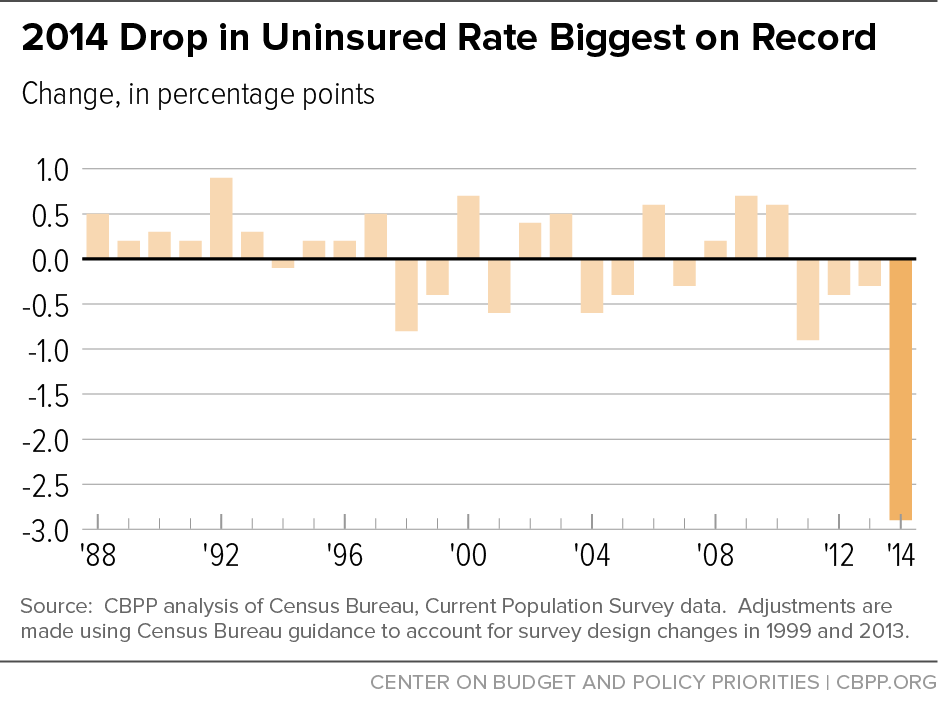
As we’ve explained, today’s Census report doesn’t allow for a direct long-term comparison of the uninsured rate because the Census Bureau periodically updates its survey questions to improve the reliability of its health coverage estimates. However, we can still compare this year’s decline in the uninsured rate to the year-to-year changes within previous Census series of health insurance data (each of which contains comparable data). That comparison shows that the drop in the uninsured rate in 2014 is several times greater than in any year since the Census Bureau began collecting health coverage data in 1987.
Other government and private survey data sources that didn’t change their survey questions over time allow for direct historical comparisons. These include the Centers for Disease Control and Prevention’s National Health Interview Survey (which began in 1997), the Census Bureau’s American Community Survey, and Gallup’s Well-Being Index (both of which commenced in 2008). All of these survey data show that the 2014 decline in the uninsured rate is clearly the largest since each of these surveys began.
These other surveys also show that the 2014 uninsured rate is the lowest on record as well. For example, the National Health Interview Survey finds that 11.5 percent of Americans were uninsured in 2014, nearly one-fifth lower than the previous low of 14.2 percent in 1999. The American Community Survey and Gallup Well-Being Index also both show the 2014 uninsured rate to be lower than in any year since these two surveys began.