
Social Security and Poverty Among the
Elderly:
A National and State Perspective
Executive Summary*
by Kathryn H.
Porter, Kathy Larin and Wendell Primus
View press release State Fact Sheets: |
Census data show that without Social Security, nearly half — 47.6 percent— of the U.S. population age 65 and older would have been poor in 1997.(1) Social Security reduced the poverty rate among elderly people in 1997 by three-quarters, to 11.9 percent. Social Security lifted 11.4 million elderly people out of poverty in that year.
State-by-State Effects
Census data also demonstrate that Social Security substantially reduces poverty among the elderly in every state. (See Table 1.)
- In the largest state, California, an estimated 43.2 percent of elderly people would have been poor without Social Security. Social Security reduced to 12.5 percent the proportion of elderly people in the state who were poor. Thus, 30.7 percent of all elderly people in California were lifted from poverty by Social Security. (These and all other state-by-state figures in the report are five-year average figures for 1993 through 1997.)
- In Florida, Social Security reduced the elderly poverty rate from 48.7 percent to 11.9 percent. Social Security benefits lifted out of poverty 36.9 percent of the elderly in that state.
- In New York, Social Security lowered the proportion of elderly people living in poverty from 50 percent to 15.1 percent. In Illinois, it reduced the elderly poverty rate from 48.4 percent to 10.1 percent.
Nationally, Social Security lowered the number of elderly poor from 15.3 million to 3.8 million in 1997, lifting from poverty nearly three of every four elderly people who would have been poor without it. Similarly, in a substantial majority of states, Social Security lifted from poverty approximately three-quarters of the elderly who would be poor in its absence. (See Table 2.)
- In California, Social Security reduced the number of elderly people living in poverty from 1.45 million to 421,000, lifting more than one million elderly out of poverty. Stated another way, 71 percent of the elderly people in California who would have been poor in the absence of Social Security benefits were lifted from poverty by these benefits.
- Social Security reduced the number of elderly poor in Florida by an estimated 883,000, from 1.17 million such people to 282,000. Some 76 percent of elderly Floridians who would have been poor without Social Security were lifted from poverty by it.
- In Illinois, Social Security lifted from poverty four of every five elderly people who otherwise would have been poor. In New York, seven of 10 elderly people who would have been poor without Social Security were lifted from poverty by the program.
Effects on Women
The majority of elderly people whom Social Security lifts from poverty are women. In 1997, women accounted for more than three of every five elderly people lifted from poverty by Social Security; the program lifted 7 million elderly women and 4.4 million men out of poverty that year. It lowered the number of poor elderly women from 9.8 million to 2.7 million and shrank the number of poor elderly men from 5.5 million to 1.1 million.
Dispelling Possible Confusion About the State Numbers At first blush, a few of the state figures presented here may seem a bit confusing. In California, for example, Social Security lifted 30.7 percent of all elderly people from poverty. Also in the Golden State, 71 percent of the elderly people who would have been poor in the absence of Social Security benefits were lifted from poverty by these benefits. What is the difference between these two percentages? During the period we examined, the Census data show there were an average of 3.35 million elderly people in California. Some 1.45 million of these 3.35 million people — 43.2 percent of them — were poor before receipt of Social Security benefits. After Social Security benefits are considered, 421,000 — or 12.5 percent of the elderly people in the state — remained poor. Social Security thus lifted 1.03 million elderly people from poverty. These 1.03 million people whom Social Security lifted from poverty represented 30.7 percent of the 3.35 million elderly people in California. These 1.03 million people also represented 71 percent of the 1.45 million elderly people in the state who would have been poor in the absence of Social Security benefits. |
Without Social Security benefits, 52.6 percent of elderly women would have had incomes below the poverty line in 1997. Social Security reduced the poverty rate for elderly women to 14.7 percent. Here, too, the state figures track the national figures. (See Tables 3 and 4.)
- In California, Social Security reduced the proportion of elderly women living below the poverty line from 48.7 percent to 15.3 percent. It lifted an estimated 635,000 elderly women out of poverty. More than two of every three elderly women in the state who would have been poor without Social Security — 69 percent of such women — were lifted from poverty by it.
- In Florida, Social Security lowered the poverty rate among women 65 and over from 52.8 percent to 14.4 percent, lifting more than one half million elderly women from poverty. Some 73 percent of the elderly women in the Sunshine State who otherwise would have been poor were removed from poverty by Social Security.
Impact of Social Security on Elderly People |
|||||||
| Percentage of
Elderly Who are Poor Before Social Security |
Percentage
of Elderly Who are Poor After Social Security |
Percentage
of Elderly Lifted from Poverty by Social Security |
|||||
| Alabama | 56.0% | 17.6% | 38.4% | ||||
| Arizona | 43.4% | 10.5% | 32.9% | ||||
| Arkansas | 60.4% | 19.9% | 40.5% | ||||
| California | 43.2% | 12.5% | 30.7% | ||||
| Colorado | 37.2% | 8.5% | 28.8% | ||||
| Connecticut | 40.2% | 6.2% | 34.0% | ||||
| Florida | 48.7% | 11.9% | 36.9% | ||||
| Georgia | 49.7% | 15.6% | 34.1% | ||||
| Hawaii | 30.9% | 9.2% | 21.7% | ||||
| Idaho | 49.3% | 9.4% | 40.0% | ||||
| Illinois | 48.4% | 10.1% | 38.3% | ||||
| Indiana | 54.0% | 9.7% | 44.3% | ||||
| Iowa | 49.5% | 9.8% | 39.7% | ||||
| Kansas | 49.4% | 11.6% | 37.8% | ||||
| Kentucky | 52.6% | 13.8% | 38.8% | ||||
| Louisiana | 54.9% | 19.0% | 35.9% | ||||
| Maine | 54.6% | 13.0% | 41.5% | ||||
| Maryland | 41.3% | 11.0% | 30.3% | ||||
| Massachusetts | 47.4% | 11.4% | 36.0% | ||||
| Michigan | 47.9% | 10.0% | 37.9% | ||||
| Minnesota | 51.7% | 11.5% | 40.2% | ||||
| Mississippi | 60.3% | 21.3% | 39.0% | ||||
| Missouri | 48.1% | 11.4% | 36.7% | ||||
| Nebraska | 52.7% | 10.9% | 41.8% | ||||
| Nevada | 45.1% | 9.3% | 35.8% | ||||
| New Hampshire | 48.3% | 8.6% | 39.8% | ||||
| New Jersey | 43.8% | 9.7% | 34.0% | ||||
| New Mexico | 48.4% | 17.0% | 31.3% | ||||
| New York | 50.0% | 15.1% | 34.9% | ||||
| North Carolina | 54.0% | 15.7% | 38.2% | ||||
| Ohio | 48.9% | 10.6% | 38.2% | ||||
| Oklahoma | 54.7% | 14.9% | 39.9% | ||||
| Oregon | 46.4% | 6.7% | 39.7% | ||||
| Pennsylvania | 53.0% | 10.6% | 42.4% | ||||
| Rhode Island | 54.6% | 12.7% | 42.0% | ||||
| South Carolina | 57.0% | 18.2% | 38.8% | ||||
| Tennessee | 53.6% | 19.1% | 34.6% | ||||
| Texas | 50.3% | 16.5% | 33.8% | ||||
| Utah | 40.0% | 6.4% | 33.6% | ||||
| Virginia | 44.7% | 13.8% | 30.8% | ||||
| Washington | 42.3% | 9.4% | 32.9% | ||||
| West Virginia | 58.5% | 15.5% | 43.0% | ||||
| Wisconsin | 47.7% | 9.0% | 38.6% | ||||
| U.S. Total* | 48.7% | 12.6% | 36.1% | ||||
| Note: The following states have
been omitted because the sample sizes in these states are too small to obtain reliable
estimates: Alaska, Delaware, District of Columbia, Montana, North Dakota, South Dakota,
Vermont, and Wyoming. * The US total figures in this table differ from the national figures in the text of the report because the US total figures in this table, like the state figures, are based on pooled Census data for the five years from 1993 to 1997. The national figures in the text are based on data for 1997 only. |
|||||||
| Impact of Social Security on the Elderly Poor | |||||||||
| Number
of Elderly Who Are Poor Before Social Security (in Thousands) |
Number
of Elderly Who are Poor After Social Security ( in Thousands) |
Number
of Elderly Lifted from Poverty by Social Security (in Thousands) |
Percentage of Elderly Who Would be Poor Without Social Security Who are Lifted from Poverty by Social Security | ||||||
| Alabama | 324 | 101 | 222 | 68.6% | |||||
| Arizona | 235 | 57 | 177 | 75.8% | |||||
| Arkansas | 200 | 66 | 134 | 67.1% | |||||
| California | 1,450 | 421 | 1,029 | 71.0% | |||||
| Colorado | 128 | 30 | 98 | 77.1% | |||||
| Connecticut | 180 | 28 | 152 | 84.6% | |||||
| Florida | 1,166 | 282 | 883 | 75.6% | |||||
| Georgia | 369 | 116 | 253 | 68.5% | |||||
| Hawaii | 46 | 14 | 33 | 69.8% | |||||
| Idaho | 65 | 12 | 52 | 81.1% | |||||
| Illinois | 654 | 137 | 517 | 79.1% | |||||
| Kansas | 161 | 37 | 124 | 76.5% | |||||
| Kentucky | 253 | 66 | 186 | 73.8% | |||||
| Louisiana | 257 | 88 | 169 | 65.3% | |||||
| Maine | 88 | 21 | 67 | 75.9% | |||||
| Maryland | 251 | 67 | 183 | 73.3% | |||||
| Massachusetts | 357 | 86 | 271 | 76.0% | |||||
| Michigan | 561 | 116 | 445 | 79.3% | |||||
| Minnesota | 242 | 54 | 188 | 77.7% | |||||
| Mississippi | 186 | 66 | 120 | 64.5% | |||||
| Missouri | 348 | 83 | 265 | 76.6% | |||||
| Nebraska | 106 | 22 | 84 | 79.3% | |||||
| Nevada | 85 | 17 | 67 | 79.4% | |||||
| New Hampshire | 65 | 12 | 54 | 82.0% | |||||
| New Jersey | 433 | 96 | 337 | 77.7% | |||||
| New Mexico | 90 | 32 | 58 | 64.5% | |||||
| New York | 1,165 | 353 | 812 | 69.6% | |||||
| North Carolina | 479 | 140 | 339 | 70.9% | |||||
| Ohio | 686 | 149 | 537 | 78.3% | |||||
| Oklahoma | 226 | 61 | 165 | 72.8% | |||||
| Oregon | 174 | 25 | 149 | 85.8% | |||||
| Pennsylvania | 914 | 182 | 732 | 80.0% | |||||
| Rhode Island | 83 | 20 | 64 | 76.8% | |||||
| South Carolina | 223 | 71 | 152 | 68.2% | |||||
| Tennessee | 305 | 108 | 198 | 65.0% | |||||
| Texas | 904 | 298 | 607 | 67.1% | |||||
| Utah | 72 | 11 | 61 | 83.8% | |||||
| Virginia | 312 | 96 | 216 | 69.1% | |||||
| Washington | 237 | 54 | 183 | 77.8% | |||||
| West Virginia | 170 | 45 | 125 | 73.5% | |||||
| Wisconsin | 271 | 51 | 221 | 80.8% | |||||
| U.S. Total* | 15,373 | 3,968 | 11,405 | 74.2% | |||||
| Note: The following states have been omitted
because the sample sizes in these states are too small to obtain reliable estimates:
Alaska, Delaware, District of Columbia, Montana, North Dakota, South Dakota, Vermont, and
Wyoming. * The US total figures in this table differ from the national figures in the text of the report because the US total figures in this table, like the state figures, are based on pooled Census data for the five years from 1993 to 1997. The national figures in the text are based on data for 1997 only. |
|||||||||
- In New York, as well, Social Security lifted one half million elderly women from poverty, or about two-thirds of the elderly women who otherwise would have been poor. Social Security reduced the poverty rate for elderly women in the Empire State from 55.4 percent to 18.9 percent.
- Social Security lifted from poverty 456,000 elderly women in Pennsylvania, 366,000 in Texas, 335,000 in Ohio, 324,000 in Illinois, 279,000 in Michigan, and 224,000 in New Jersey. In all of these states except Texas, Social Security lifted from poverty about three of every four elderly women who otherwise would have been poor. In Texas, it lifted out nearly two-thirds of those who would have been poor without it.
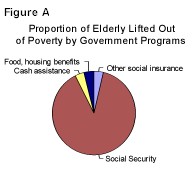
Overall Effects on Elderly Poverty
Social Security has a much larger impact in lifting elderly people from poverty than all other government programs combined. Nine of every 10 elderly people lifted from poverty by government benefit programs, including state and local cash assistance programs, are lifted out by Social Security.
Social Security also reduces the depth, or severity, of poverty among elderly people who remain poor. Researchers use a measure known as the "poverty gap" to examine the depth of poverty; the poverty gap is the total amount by which the incomes of all poor people fall below the poverty line. In 1997, the poverty gap for the elderly was $70 billion before Social Security. Social Security reduced the poverty gap among the elderly from $70 billion to $10 billion.
 Social Security also is important to millions of elderly people who are not
poor. It constitutes at least 50 percent of the total income of more than half of all
elderly people. It constitutes at least 90 percent of income for one-quarter of the
elderly. For 15 percent of the elderly, Social Security is their sole source of income.
Social Security also is important to millions of elderly people who are not
poor. It constitutes at least 50 percent of the total income of more than half of all
elderly people. It constitutes at least 90 percent of income for one-quarter of the
elderly. For 15 percent of the elderly, Social Security is their sole source of income.
Social Security is the principal source of income for many middle-income elderly people as well as for those of lesser means. It makes up approximately 80 percent of the income of both the poorest fifth of elderly people and the next-to-the-poorest fifth. It provides 62 percent of the income of those in the middle fifth of the elderly population. It even provides 41.5 percent of the income of the elderly in the next-to-highest income fifth. By contrast, it makes up only 17 percent of the income of those in the top fifth of the elderly population.
Effects on Elderly Women
Social Security is particularly beneficial to women. Women receive 53 percent of Social Security retirement and survivor benefits, while paying 38 percent of Social Security payroll taxes.
Social Security is highly favorable to women for several reasons. It provides lifetime retirement benefits that are fully indexed for inflation. Since women tend to live longer than men, this feature of Social Security is especially important to them. In addition, Social Security has a progressive benefit structure — it provides benefits that replace a higher percentage of the earnings of low-wage workers than of highly paid workers. Since women have lower average wages than men, this aspect of the program is beneficial to them as well. Finally, women are the primary beneficiaries of Social Security's special benefits for spouses (including divorced spouses who were married at least 10 years and have not remarried) and for widows and widowers.
Women outnumber men in the elderly population, and elderly women are more likely than elderly men to be poor. This is in large part because elderly women receive less income than elderly men from earnings, pensions, and investments. Older women tend to have fewer financial assets than older men.
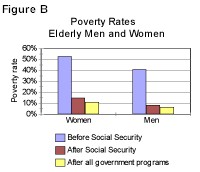
In 1997, some 52.6 percent of women age 65 and older were poor before receipt of Social Security benefits, compared to 40.8 percent of elderly men. After Social Security, 14.7 percent of elderly women and 8.2 percent of elderly men remained poor. Social Security narrows the gap in poverty rates between elderly women and elderly men.
 In 1997, nearly two-thirds of elderly women received a majority of their
income from Social Security. For almost one-third of elderly women, Social Security
provided at least 90 percent of income. It was the sole source of income for nearly one in
five elderly women. For elderly women overall, Social Security benefits provided more than
three-fifths of total income.
In 1997, nearly two-thirds of elderly women received a majority of their
income from Social Security. For almost one-third of elderly women, Social Security
provided at least 90 percent of income. It was the sole source of income for nearly one in
five elderly women. For elderly women overall, Social Security benefits provided more than
three-fifths of total income.
Effects by Marital Status
Married women and widows are entitled to special Social Security benefits.(2) Social Security lifts from poverty a larger proportion of elderly women who are married than of those who are widowed and a larger proportion of those who are widowed than of those otherwise unmarried.
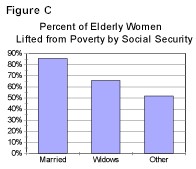 In 1995-1997, Social Security benefits lifted from poverty 85.6 percent of married
women who would be poor without it — or six of every seven such women. (These figures
are based on averages of three years of Census data. Three years of data were used to
provide adequate sample sizes.)
In 1995-1997, Social Security benefits lifted from poverty 85.6 percent of married
women who would be poor without it — or six of every seven such women. (These figures
are based on averages of three years of Census data. Three years of data were used to
provide adequate sample sizes.)
- Among elderly widows, Social Security lifted from poverty two-thirds — 65.8 percent — of those who would have been poor in the absence of these benefits.
- Social Security lifted from poverty about half — 51.8 percent — of never-married, divorced, and separated elderly women who would have been poor without its benefits.
| Impact of Social Security on Elderly Women | |||||||||
| Percentage of Elderly Women Who are Poor Before Social Security |
Percentage
of Elderly Women Who are Poor After Social Security |
Percentage
of Elderly Women Lifted from Poverty by Social Security |
|||||||
| Alabama | 60.9% | 21.4% | 39.5% | ||||||
| Arizona | 46.5% | 11.8% | 34.7% | ||||||
| Arkansas | 66.4% | 25.1% | 41.2% | ||||||
| California | 48.7% | 15.3% | 33.4% | ||||||
| Colorado | 41.8% | 10.5% | 31.3% | ||||||
| Connecticut | 45.9% | 8.4% | 37.4% | ||||||
| Florida | 52.8% | 14.4% | 38.4% | ||||||
| Georgia | 54.8% | 20.6% | 34.2% | ||||||
| Hawaii | 34.0% | 11.3% | 22.7% | ||||||
| Idaho | 53.1% | 11.8% | 41.3% | ||||||
| Illinois | 54.9% | 13.7% | 41.2% | ||||||
| Indiana | 58.3% | 11.9% | 46.4% | ||||||
| Iowa | 55.3% | 12.6% | 42.6% | ||||||
| Kansas | 52.2% | 12.7% | 39.5% | ||||||
| Kentucky | 56.9% | 18.3% | 38.6% | ||||||
| Louisiana | 57.4% | 21.3% | 36.1% | ||||||
| Maine | 57.0% | 14.6% | 42.4% | ||||||
| Maryland | 44.5% | 13.2% | 31.3% | ||||||
| Massachusetts | 53.3% | 13.9% | 39.4% | ||||||
| Michigan | 52.6% | 12.7% | 39.9% | ||||||
| Minnesota | 55.9% | 14.6% | 41.3% | ||||||
| Mississippi | 63.8% | 26.1% | 37.7% | ||||||
| Missouri | 53.5% | 14.8% | 38.7% | ||||||
| Nebraska | 57.5% | 14.4% | 43.0% | ||||||
| Nevada | 50.1% | 12.1% | 38.0% | ||||||
| New Hampshire | 53.9% | 12.0% | 41.8% | ||||||
| New Jersey | 50.0% | 11.8% | 38.2% | ||||||
| New Mexico | 52.5% | 20.2% | 32.3% | ||||||
| New York | 55.4% | 18.9% | 36.5% | ||||||
| North Carolina | 58.5% | 20.0% | 38.4% | ||||||
| Ohio | 54.2% | 14.1% | 40.1% | ||||||
| Oklahoma | 59.2% | 18.9% | 40.3% | ||||||
| Oregon | 51.6% | 7.3% | 44.3% | ||||||
| Pennsylvania | 58.1% | 13.5% | 44.6% | ||||||
| Rhode Island | 60.1% | 16.3% | 43.9% | ||||||
| South Carolina | 58.8% | 22.2% | 36.6% | ||||||
| Tennessee | 60.6% | 25.6% | 35.0% | ||||||
| Texas | 55.0% | 19.3% | 35.6% | ||||||
| Utah | 43.6% | 7.7% | 35.9% | ||||||
| Virginia | 49.7% | 17.6% | 32.1% | ||||||
| Washington | 45.4% | 11.4% | 34.0% | ||||||
| West Virginia | 64.6% | 19.4% | 45.3% | ||||||
| Wisconsin | 51.8% | 12.0% | 39.9% | ||||||
| Note: The following states have been omitted because the sample sizes in these states are too small to obtain reliable estimates: Alaska, Delaware, District of Columbia, Montana, North Dakota, South Dakota, Vermont, and Wyoming. | |||||||||
| Impact of Social Security on Poor Elderly Women | |||||||||||
| Number
of Elderly Women Who are Poor Before Social Security (in Thousands) |
Number
of Elderly Women Who are Poor After Social Security (in Thousands) |
Number
of Elderly Women Lifted from Poverty by Social Security (in Thousands) |
Percentage
of Elderly Women Who Would be Poor Without Social Security Who are Lifted from Poverty by Social Security |
||||||||
| Alabama | 216 | 75 | 140 | 64.7% | |||||||
| Arizona | 138 | 35 | 103 | 74.3% | |||||||
| Arkansas | 127 | 48 | 79 | 62.3% | |||||||
| California | 927 | 292 | 635 | 68.6% | |||||||
| Colorado | 80 | 21 | 59 | 75.0% | |||||||
| Connecticut | 124 | 23 | 101 | 81.5% | |||||||
| Florida | 720 | 196 | 524 | 72.7% | |||||||
| Georgia | 243 | 91 | 152 | 62.4% | |||||||
| Hawaii | 29 | 10 | 19 | 66.8% | |||||||
| Idaho | 40 | 9 | 31 | 77.7% | |||||||
| Illinois | 432 | 108 | 324 | 75.0% | |||||||
| Indiana | 244 | 49 | 195 | 79.8% | |||||||
| Iowa | 120 | 28 | 92 | 77.3% | |||||||
| Kansas | 101 | 24 | 77 | 75.2% | |||||||
| Kentucky | 153 | 50 | 104 | 67.8% | |||||||
| Louisiana | 153 | 56 | 97 | 63.0% | |||||||
| Maine | 52 | 13 | 39 | 74.5% | |||||||
| Michigan | 367 | 88 | 279 | 76.0% | |||||||
| Minnesota | 149 | 39 | 110 | 73.5% | |||||||
| Mississippi | 114 | 47 | 67 | 58.9% | |||||||
| Missouri | 225 | 62 | 163 | 72.8% | |||||||
| Nebraska | 67 | 17 | 50 | 74.8% | |||||||
| Nevada | 53 | 13 | 40 | 75.7% | |||||||
| New Hampshire | 39 | 9 | 30 | 77.4% | |||||||
| New Jersey | 292 | 69 | 224 | 76.5% | |||||||
| New Mexico | 55 | 21 | 34 | 61.7% | |||||||
| New York | 777 | 265 | 512 | 65.8% | |||||||
| North Carolina | 301 | 103 | 197 | 65.8% | |||||||
| Ohio | 453 | 118 | 335 | 74.0% | |||||||
| Oklahoma | 143 | 45 | 97 | 68.3% | |||||||
| Oregon | 104 | 15 | 89 | 86.0% | |||||||
| Pennsylvania | 594 | 139 | 456 | 76.7% | |||||||
| Rhode Island | 58 | 16 | 42 | 72.9% | |||||||
| South Carolina | 139 | 52 | 87 | 62.3% | |||||||
| Tennessee | 203 | 86 | 118 | 58.2% | |||||||
| Texas | 564 | 199 | 366 | 64.8% | |||||||
| Utah | 43 | 7 | 36 | 82.9% | |||||||
| Virginia | 208 | 74 | 134 | 64.6% | |||||||
| Washington | 151 | 39 | 112 | 74.9% | |||||||
| West Virginia | 114 | 34 | 80 | 70.2% | |||||||
| Wisconsin | 168 | 39 | 129 | 76.9% | |||||||
| Note: The following states have been omitted because the sample sizes in these states are too small to obtain reliable estimates: Alaska, Delaware, District of Columbia, Montana, North Dakota, South Dakota, Vermont, and Wyoming. | |||||||||||
- Social Security reduced the poverty rate among elderly married women from 42.2 percent to 4.8 percent. Among elderly widows, it reduced the poverty rate from 62.1 percent to 20.3 percent. It cut poverty among other unmarried women from 56.7 percent to 27 percent.
Although Social Security lifts more elderly married women from poverty, widows are the group that relies on Social Security for the greatest portion of their income. Social Security made 67.6 percent of the total income of elderly widows in 1995-97. It constituted 55.5 percent of the income of elderly married women and 56.3 percent of the income of other unmarried elderly women.
Indeed, nearly three of every four elderly widows rely on Social Security for a majority of their income. Two-fifths depend on it for at least 90 percent of their income. For one-quarter, it is their only income source.
Effects by Age
Elderly women are more likely to fall into poverty as they grow older. Among women age 65 to 75, nearly half — 46 percent — were poor in 1995-97 before counting Social Security. By contrast, among those 85 and older, 65.3 percent were poor before Social Security.
Social Security benefits narrow the disparity in poverty rates between the younger and older elderly. After receiving Social Security benefits, 12.7 percent of women 65 to 75 remain in poverty. Among women 75 to 85, some 16.6 percent remain poor after receipt of Social Security. Among those 85 and older, 20.6 percent are poor after Social Security.
Just as women become poorer as they get older, so do they rely more heavily on Social Security. The proportion of women who rely on Social Security for at least half of their income rises from 58 percent for women 65 to 75 to 75 percent for those 85 and older. Similarly, 15 percent of women age 65 to 75 rely on Social Security as their only source of income. Some 26 percent of those 85 and older do.
Effects by Racial and Ethnic Group
Poverty is higher among elderly people in minority racial and ethnic groups than among the white elderly. In 1997, some 46.3 percent of the white elderly were poor before receipt of Social Security.(3) Some 54.9 percent of Hispanic elderly people were poor before Social Security, as were 59.9 percent of the black elderly.
Social Security cuts poverty rates by about half or more among elderly people in all three groups. In 1997, Social Security benefits reduced the poverty rate for the Hispanic elderly from 54.9 percent to 28.1 percent. These benefits shrank the poverty rate for the black elderly from 59.9 percent to 29.1 percent. The poverty rate among the white elderly plummeted from 46.3 percent to 9.1 percent.
In numerical terms, Social Security reduced the number of white elderly poor from 12.5 million to 2.4 million in 1997. These benefits cut the number of black elderly poor from 1.6 million to 800,000 and the number of Hispanic elderly poor from 900,000 to 500,000.
Much of the difference among racial and ethnic groups in the anti-poverty effects of Social Security is due to differences in wages. Social Security benefit levels are tied to beneficiaries' wages during their working years. Many of those who are old today worked for years before the passage of civil rights laws, when wage differentials between whites and minorities were even larger than they are today. During these periods, black and Hispanic workers often were limited to low-paying occupations. The smaller impact of Social Security on poverty among the Hispanic elderly also reflects the fact that many Hispanic people who are elderly today emigrated to the United States too late in life to amass a sufficient number of years of employment to qualify for substantial Social Security benefits.
For elderly people of all races, Social Security provides a larger share of income than does any other income source. Some 43 percent of the total income of the black elderly, 41 percent of the total income of the Hispanic elderly, and 36 percent of the total income of the white elderly comes from Social Security. The black and Hispanic elderly populations rely on Social Security for somewhat larger shares of their income than the white elderly do because they tend to have less income from other sources.
End Notes:
* The entire report can be viewed as a PDF file at https://www.cbpp.org/4-8-99socsec.pdf
1. This report examines the effect of Social Security and other government programs on poverty by comparing the number of people who would be poor if government benefits were not counted as part of their incomes to the number who are poor when certain government benefits are counted. If no government benefits were counted as part of their incomes, 49.1 percent of elderly people would be poor. Counting social insurance benefits, such as federal pensions and unemployment insurance benefits, but not Social Security, brings the elderly poverty rate down slightly to 47.6 percent. Counting Social Security brings the poverty rate down to 11.9 percent. Thus, the impact of Social Security is to reduce the poverty rate among elderly people from 47.6 percent to 11.9 percent. In this report, the phrase "before (or without) Social Security" means after counting social insurance benefits other than Social Security, but without counting any other government benefits.
2. Social Security benefits are structured so one spouse can receive Social Security benefits based on the earnings of the other spouse. This is particularly important to women because their earnings tend to be lower than the earnings of their husbands. The lower-earning spouse is entitled to a Social Security benefit based on her own earnings or a benefit equal to half of the benefit her spouse receives, whichever is greater. Similarly, widows and widowers can receive Social Security benefits based on the earnings of their deceased spouses; a widow(er) is entitled to a Social Security benefit based on her own earnings or a benefit equal to 100 percent of her deceased spouse's benefit, whichever is greater.
3. In this report, "white" means non-Hispanic white and "black" means non-Hispanic black.
|
|