
Pathbreaking CBO Study Shows
Dramatic Increases in Income Disparities in 1980s and 1990s:
An Analysis of the CBO Data
by Isaac
Shapiro, Robert Greenstein,
and Wendell Primus
| PDF version of
this
report HTML of press release PDF of press release If you cannot access the files through the links, right-click on the underlined text, click "Save Link As," download to your directory, and open the document in Adobe Acrobat Reader. |
A pathbreaking study of income and tax trends since 1979 that the Congressional Budget Office issued last week(1) shows that dramatic increases in income disparities — especially between the wealthiest one percent of Americans and the rest of the society — occurred in both the 1980s and the 1990s. The study also shows that the percentage of income that Americans pay in federal taxes declined for every income group between 1979 and 1997 (the period the study covers) and, by one key measure, fell the most for those with the highest incomes. The CBO study provides the most comprehensive and reliable information that any researcher or research institution has developed on these matters and will now become the definitive data on these issues for the period examined.
Average
After-Tax |
|
Top 1% |
$414,200 |
Middle fifth |
$3,400 |
Bottom fifth |
-$100 |
The CBO study shows that from 1979 to 1997:
- The average after-tax income of the poorest 20 percent of U.S. households was stagnant. This group's average after-tax income fell by $100. (All figures are adjusted for inflation and expressed in 1997 dollars.)
- For the middle fifth of households, average after-tax income rose a modest 10 percent over this 18-year period (an average of about one-half of one percent per year), or $3,400.
- By contrast, average after-tax income climbed 157 percent — or $414,000 — among the top one percent of households.
- As a result, income disparities between rich and poor — and between the rich and the middle class — were much wider in 1997 than at any other time in the period examined.
The CBO study lays to rest the oft-stated, but now clearly mistaken, notion that although income disparities grew rapidly in the 1980s, they stopped growing in the 1990s. To the contrary, the study shows that income disparities continued to grow sharply over the past decade.
- From 1989 to 1997, the average after-tax income of the top one percent of households increased 36 percent, or $180,000 per household. This was six times the average percentage gain the middle fifth of households received. It was 90 times the average dollar gain the middle fifth received.
- Nor did income disparities stop growing after 1997. Although CBO does not yet have comprehensive data for the years after 1997, the CBO study states that the "rapid rise in the share of income going to the top of the distribution" continued at least into 1998 and 1999.
Average
After-Tax Income |
|
| Top 1% | $179,600 |
| Middle fifth | $2,000 |
| Bottom fifth | $0 |
In addition to these data on income trends, the CBO study provides the most comprehensive data available on federal tax burdens over the past two decades. The study includes data from 1979 through 2001 on the percentage of income that each income group pays in federal taxes. The CBO study highlights one striking finding in this area — the percentage of income that Americans pay in federal taxes declined between 1979 and 2001 among every income group. Furthermore, the study reports that "Households in the top 1 percent of the distribution had the largest percentage-point fall in effective tax rates" (i.e., in the percentage of income paid in federal taxes). Thus, even before enactment of tax legislation that will provide very large tax cuts to the top one percent of households, that group already has received larger federal tax reductions over the past 22 years than any other income group.
The tax legislation President Bush is about to sign will accelerate the trends of growing income disparities between the wealthiest individuals and other Americans. The average percentage gain in after-tax income that will result from the legislation will be about three times greater for those in the top one percent of the income distribution than for those in the middle of the income spectrum, and more than seven times greater than the average percentage gain among the bottom fifth of the population. After-tax income disparities, already larger now than at any other time in more than two decades, will widen further as a result of the tax legislation.
This analysis examines the CBO study and the data it contains. The analysis begins with a brief discussion of why the data in the study eclipse data previously available on these matters.
The New CBO Data
In its report, CBO combines Census data with Internal Revenue Service data from income tax returns. In developing this data set, CBO consulted many of the nation's foremost experts on the measurement of incomes.
The data in this study are superior to other data on income trends. Census data are often cited on these matters, but experts agree that the CBO data are substantially stronger.
- The CBO data provide information on income and income trends among the top one percent of the population. Census data do not. The Census Bureau has acknowledged that it lacks reliable data on the incomes of those at the top of the income scale, both because its official measure of income does not include income from capital gains and because (for confidentiality reasons) it records only part — rather than all — of the income of individuals at very high income levels. The Census Bureau does not even attempt to provide information on the incomes of the top one percent of the population because its data on that group are not reliable. CBO solves this problem by supplementing Census data with data from the Internal Revenue Service's "Statistics of Income" series, which includes actual income information from tax returns, including the tax returns of the top one percent of the population.
- CBO includes detailed information on income levels after taxes are taken into account. The Census Bureau focuses mainly on income levels before taxes are subtracted. The CBO data also count as income the payments that low- and moderate-income working families receive from the Earned Income Tax Credit. The official Census data do not include EITC payments. In short, the CBO measure of after-tax income provides a better measure of the income that households have at their disposal.
- The CBO data include in-kind or non-cash income, such as income from food stamps, housing assistance, and health insurance coverage. The standard income information that the Census Bureau presents does not include in-kind or non-cash benefits. Both the Census Bureau and CBO have been criticized in the past for neglecting in-kind benefits and consequently understating the amount of resources that low-income households have at their disposal. The new CBO study remedies that problem.(2)
In short, CBO draws upon both Census data and IRS data. Each of those data sets is better than the other for certain types of data on certain income groups. CBO has used the strongest elements of each of these data sets to build a data set that is superior to either the Census or IRS data by themselves.(3)
The Long-term Trend
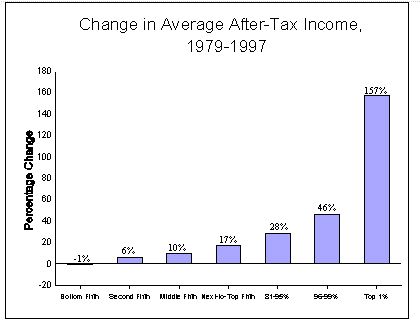
The CBO data cover nearly two decades. These data show that the income gains among those at the top of the income spectrum greatly outpaced the gains among all other income groups throughout the 1979-1997 period. Between 1979 and 1997, average income stagnated among the bottom part of the population, increased modestly for the middle of the population, and soared among those at the top of the income spectrum.
- The bottom fifth of households had average after-tax income of $10,800 in 1997. In 1979, their average income stood at $10,900. (As noted, CBO has adjusted these figures for inflation and expressed them in 1997 dollars. Also, CBO does not compare the same households over time; the households comprising the bottom fifth of households in 1979 are not exactly the same as the households that comprise the bottom fifth of households in 1997. See the appendix for a fuller discussion of this issue.)
- Among the middle fifth of the population, average after-tax income rose by 10 percent — or about half a percentage point a year — from 1979 to 1997, climbing from $33,800 to $37,200.
- By contrast, the average after-tax income of the top fifth of households jumped by more than half, and the average after-tax income of the top one percent of the population rose a stunning 157 percent. The average after-tax income of the top one percent of the population climbed from $263,700 in 1979 to $677,900 in 1997.
- The average household in the top one percent of the population had $414,000 more in after-tax income in 1997 than its counterpart had in 1979. The average household in the middle of the population was $3,400 better off in 1997 than its 1979 counterpart. The average household in the bottom fifth of the population was no better off than its 1979 counterpart. Those with the highest incomes are far better off in 1997 than those with the highest incomes were two decades ago, but this statement does not apply to low- and middle-income households.
Shares of
National |
||
1979 |
1997 |
|
| Top 1% | 7.5% |
13.6% |
| Bottom 40% | 18.5% |
15.0% |
As a result, the gaps between the top and the middle of the income distribution are much larger now than they were at the end of the 1970s, as are the gaps between the top and the bottom of the income distribution. After-tax income disparities were larger in 1997 than in any other year measured by CBO — and dramatically larger than they were two decades ago. This also can be seen in the data the CBO study presents on changes in the proportion of the national income that each income group receives.
- In 1979, the top one percent of the population received 7.5 percent of the after-tax income in the nation. In 1997, it received 13.6 percent of the income, nearly twice its share in 1979.
- Among the bottom 40 percent of the population, the story is reversed. This group received a markedly smaller share of the national income in 1997 than in 1979. In fact, in 1979, the bottom 40 percent of the population received nearly two and one half times as much in after-tax income as the top one percent of the population, but by 1997, the top one percent received nearly as much income as the bottom 40 percent. (See Table 3.)
- In 1997, the 2.6 million people who made up the top one percent of the population had as much after-tax income as the 100 million Americans with the lowest incomes.
- The top 20 percent of the population received half of the nation's after-tax income in 1997, the remaining 80 percent of the population shared the other half. The share of after-tax income received by each of the bottom four-fifths of the population fell from 1979 to 1997.
The CBO data go back to 1979. It is likely that if these data were available for years before 1979, they would show the disparities in after-tax income are wider now than for a much longer period. Census data on before-tax income show that income disparities were wider in the latter half of the 1990s than at any point in the post-World War II era; it is possible the CBO methodology would find the same result for after-tax income if the relevant data were available.
Average
After-Tax Gains, 1989 to 1997 |
|||||||
Top 1% |
Next 4% |
Next 15% |
Fourth 20% |
Middle 20% |
Second 20% |
Lowest 20% |
|
| Percentage gains | 36.0% |
16.8% |
9.7% |
5.9% |
5.7% |
5.6% |
0.0% |
| Dollar gains | $179,600 |
$20,700 |
$6,900 |
$2,900 |
$2,000 |
$1,300 |
$0 |
Source: Congressional Budget Office |
|||||||
Income Disparities Grew Rapidly in the 1990s
It is conventional wisdom that income disparities grew sharply in the 1980s. Some observers have argued, however, that income disparities have stabilized since then rather than continuing to grow. This argument is based on Census data that appear to show that income disparities have remained relatively constant since 1993.
These Census data are seriously deficient, however, because they fail to capture much of the income growth that has occurred at the top of the income spectrum in recent years. As noted, the Census data do not include capital gains income and omit a significant portion of other income that households with the highest incomes receive. The Census Bureau regards its data on those who have very high incomes as being sufficiently unreliable that it does not publish — or even attempt to break out — information on the top one percent of households.
The more complete CBO data provide a more accurate picture. The pace of the growth in income disparities may have slowed somewhat in the 1990s, but income gains continued to be remarkably uneven. From 1989 to 1997, the average after-tax income of the bottom fifth of the population remained unchanged, while income rose by an average of less than six percent for the middle fifth of the population. But the average after-tax income of the top one percent continued to shoot up, rising 36 percent — close to $180,000 per household — over this period. (See Table 4.) With the release of the CBO study, there is no longer any question that income disparities continued to widen in the 1990s.
Income disparities grew especially quickly from 1995 to 1997
Furthermore, income disparities grew more sharply between 1995 and 1997 — the last two years the CBO study covers — than in any other two-year period since 1979. This suggests the possibility that the growth in disparities in after-tax income may have accelerated in the latter half of 1990s.
- From 1995 to 1997, the top one percent of households racked up a gain of 40 percent in average after-tax income. This far outpaced the average four-percent gain for the middle fifth of households and the one-percent gain for the bottom fifth.
- The 40 percent increase in the after-tax income of the top one percent is a larger two-year gain by far than the gain any income group experienced at any point in the 18-year period that CBO examined.
Disparities appear to have grown further since 1997
Census data for 1998 and 1999 indicate that all income groups have gained somewhat since 1997. The CBO study concludes, however, that at least through 1999, those gains continued to be concentrated at the top. CBO reports: "Although CBO's database on taxes and income ends in 1997, information from tax returns suggests that the recent rapid rise in the share of income going to the top of the distribution and in the share of individual income taxes those households pay has continued in 1998 and 1999."
IRS data are currently available through 1998. Those data show that the average after-tax income of the top one percent of the population grew 13 percent between 1997 and 1998, and that this was more than three times the average percentage income gain for the bottom 90 percent of the population. (These IRS data reflect income after federal income taxes are subtracted but do not net out other taxes.)
The Effects of Changes in Tax Burdens
CBO notes in its study that the share of federal income taxes that is paid by those at the top of the income distribution has increased over the past two decades. CBO finds, however, that this is primarily the result of the increased concentration of income among the very affluent and is not the result of an increase in tax burdens on high-income households. Since high-income households receive a much larger share of the nation's income than they did two decades ago, they pay more of the nation's taxes. As CBO puts it, "increasing inequality of income led to similar shifts in the distribution of tax liabilities."
Indeed, the CBO study demonstrates that the effective tax rates paid by those at the top of the income spectrum — that is, the percentage of income that they pay in federal taxes — have not increased. To the contrary, the effective federal tax rate these households pay declined between 1979 and 1997, as did the effective tax rates that all other income groups pay.
Moreover, the top one percent of taxpayers experienced a larger percentage-point drop in their effective tax rate over this period than did any other group. In 1979, the top one percent of households paid an average of 37.3 percent of income in federal taxes. In 1997, they paid 33.3 percent, a decline of four percentage points. (The bottom fifth of households experienced the next-largest percentage point drop in its effective federal tax rate. Since the average tax rate these households pay was lower to begin with, this group received the largest proportionate reduction in tax burdens. Even with this decline in federal taxes, however, the average after-tax income of the bottom fifth of households fell $100 over the 1979 - 1997 period.)
The CBO study also found that the average tax rates that all income groups pay declined further from 1997 to 2001. This is a result of the tax cuts enacted in 1997.
At first blush, this story of declines in the effective federal tax rates that every income group pays may seem to be in conflict with the often-repeated fact that federal taxes are at a post-World War II high as a percentage of the U.S. economy. The CBO study explains this seeming discrepancy. As the study notes, the reason is the increased concentration of income at the top of the income spectrum, which has resulted in a larger share of the nation's income being received by those who pay a larger percentage of their income in taxes than the rest of the population does.
These data demonstrate conclusively that claims that American families have been shouldering heavier tax burdens and paying a larger share of their incomes in taxes to the federal government are inaccurate (and deceptive). As the data in the CBO study show, the average tax rates that those at the top pay — along with the average rates that the rest of the population pays — can decline at the same time that federal revenues increase as a share of the economy.
The CBO study also breaks out federal tax burdens by different types of taxes, including individual income taxes, payroll taxes, the corporate income tax, and excise taxes. For the bottom four-fifths of the population, payroll taxes are the largest federal tax. The dominance of payroll taxes has grown over time. CBO reports that in 1979 payroll taxes exceeded income taxes for 56 percent of the population. In 1997, payroll taxes were greater than income taxes for 79 percent of the population.
The Effects of the Tax Bill
It is possible to use the budget surplus to help mitigate these trends of widening income disparities. This could be done by deploying the surplus (whether through tax cuts or program increases) in a manner that raises the after-tax income of low- and middle-income households by a larger percentage than it raises the after-tax income of high-income households. High-income households could still receive a tax cut under such an approach, but not as large a cut as is now in store for them.
The tax bill about to become law would have the opposite effect. It would widen income disparities further.
- When fully phased in, the tax reductions in the bill would increase the after-tax income of the top one percent of households by an average of six to seven percent — or $46,000 to $53,000 per household. (These figures are based on Citizens for Tax Justice's estimates of the effect of the income-tax provisions and on both CTJ and Department of Treasury methodologies for estimating who pays the estate tax.) The tax cut for the top one percent from the income tax reductions alone, not accounting for the effect of estate tax changes, would average $29,000.
- The average after-tax income of the middle fifth of households would rise by 2.2 percent. The average after-tax income of the bottom fifth of households would rise 0.8 percent.
- Thus, after-tax income would rise about three times as fast among the top one percent of families as among those in the middle of the income scale, and more than seven times faster among the top one percent of families than among the bottom 20 percent of families.
At a time when the most comprehensive government study of income trends ever conducted demonstrates that disparities in after-tax income grew sharply in both of the last two decades, the tax bill would widen such disparities further and provide much greater benefits to those who have gained the most since the late 1970s than it would provide to other Americans.
Average
After-Tax Income by Income Group |
|||||
| Income Category | 1979 |
1989 |
1997 |
Percent Change 1979-1997 |
Dollar Change 1979-1997 |
| Lowest fifth | $10,900 |
$10,800 |
$10,800 |
-0.9% |
$-100 |
| Second fifth | 23,300 |
23,400 |
24,700 |
6.0% |
$1,400 |
| Middle fifth | 33,800 |
35,200 |
37,200 |
10.1% |
$3,400 |
| Fourth fifth | 44,700 |
49,300 |
52,200 |
16.8% |
$7,500 |
| Highest fifth | 79,100 |
103,300 |
121,000 |
53.0% |
$41,900 |
| 81st-95th Percentile | 61,000 |
71,300 |
78,200 |
28.2% |
$17,200 |
| 96th-99th Percentile | 98,200 |
123,100 |
143,800 |
46.4% |
$45,600 |
| Top 1 Percent | 263,700 |
498,300 |
677,900 |
157.1% |
$414,200 |
Average
Pre-Tax Income by Income Group |
|||||
| Income Category | 1979 |
1989 |
1997 |
Percent Change 1979-1997 |
Dollar Change 1979-1997 |
| Lowest Fifth | $11,800 |
$11,700 |
$11,400 |
-3.4% |
-$400 |
| Second Fifth | 27,100 |
27,300 |
28,600 |
5.5% |
1,500 |
| Middle Fifth | 41,400 |
42,700 |
45,100 |
8.9% |
3,700 |
| Fourth Fifth | 56,800 |
61,900 |
65,600 |
15.5% |
8,800 |
| Highest Fifth | 109,500 |
138,000 |
167,500 |
53.0% |
58,000 |
| 81st-95th Percent | 80,300 |
92,900 |
102,900 |
28.1% |
22,600 |
| 96th-99th Percent | 136,800 |
165,800 |
199,500 |
45.8% |
62,700 |
| Top 1 Percent | 420,200 |
694,000 |
1,016,900 |
142.0% |
596,700 |
Effective
Total Federal Tax Rate |
||||
| Income Category | 1979 |
1989 |
2001 |
Percentage Point
Change |
| Lowest Fifth | 8.1 |
8.5 |
5.3 |
-2.8 |
| Second Fifth | 14.0 |
14.3 |
12.8 |
-1.2 |
| Middle Fifth | 18.2 |
17.6 |
16.7 |
-1.5 |
| Fourth Fifth | 21.2 |
20.3 |
20.0 |
-1.2 |
| Highest Fifth | 27.8 |
25.1 |
27.4 |
-0.4 |
|
|
|||
| 81st-95th Percentiles | 24.1 |
23.3 |
23.8 |
-0.3 |
| 96th-99th Percentiles | 28.2 |
25.8 |
27.8 |
-0.4 |
| Top 1 Percent | 37.3 |
28.2 |
32.7 |
-4.6 |
Appendix 1. The CBO Study and Income Mobility
The CBO study provides data for each odd-numbered year from 1979 to 1997. For each such year, it places households into different income groups, based on their average income in that year. The study thus shows how the incomes and tax burdens of different income groups compare over time. For example, the study compares the average incomes of the poorest 20 percent of the population in 1979 to the average incomes of the poorest 20 percent of the population in 1997.
Just who is in each income group changes over time. Some families have low incomes for only a few years and move quickly into the middle class. For example, the parents of a young child may be working part time while finishing college. The family's income may be low for a few years, but after both parents graduate from college and obtain better-paying jobs, the family's income may increase substantially.
Although some families see their incomes increase over time, studies of income mobility have shown that the majority of low-income families continue to have low incomes for many years. A recent study of earnings mobility by Peter Gottschalk of Boston College and Sheldon Danziger of the University of Michigan found that in the early 1990s, 75 percent of the people whose incomes placed them among the poorest fifth of the population in one year remained in the poorest fifth of the population the following year. While income mobility is greater when a longer period of time is analyzed, Gottschalk and Danziger found that almost half of the young adults (those age 22 to 39) who were in the bottom fifth of the income distribution in 1968 still were in the bottom fifth some 23 years later, in 1991. Moreover, nearly three-quarters of those who were in the bottom fifth in 1968 were in the bottom two-fifths in 1991.(4)
Another question is whether income mobility has increased over time. This is an important issue. Increases in income mobility can offset increases in income inequality. If, however, income mobility has not increased — that is, if it has remained about the same or declined since the 1970s — then the sharp increases in income disparities since the late 1970s reflect true growth in disparities and not merely a reshuffling of the income distribution. The Gottschalk and Danziger study finds that income mobility declined somewhat between the late 1960s and the early 1990s, as the percentage of people changing income category from one year to the next diminished.
The Gottschalk and Danziger study is one of the most recent studies on income mobility. A review of the literature in the field conducted by researchers at the Urban Institute (before release of the Gottschalk-Danziger study) also found that mobility has not increased. The Urban Institute study, by Daniel McMurrer and Isabel Sawhill, concluded: "The evidence on this point is clear: Mobility has not changed significantly over the last 25 years. Indeed, a number of different studies indicate that relative mobility rates in the United States — both short term and long term — have been remarkably stable."(5)
End Notes
1. The Congressional Budget Office, Historical Effective Tax Rates, 1979-1997, Preliminary Edition, May 2001. <http://www.cbo.gov/ftpdoc.cfm?index=2838&type=1>
2. Two other, somewhat more technical, differences between the CBO data and Census data should be noted. First, CBO places households into income categories after making an adjustment for the number of people in the household. Take two households with incomes of $20,000. Household A has four people in it; Household B has one person in it. Recognizing that it is harder for four people to live on $20,000 than it is for one person, CBO's method considers the household with one person to be better off, and to have higher adjusted household income, than the household with four people. The Census Bureau makes no adjustments for family size, so that a household of four with an income of $20,000 can be placed in a higher income category than a single-person household with income of $19,500.
Second, CBO places an equal number of people into each income fifth. The Census Bureau places equal numbers of households into each income fifth. Since many low-income households consist of elderly individuals, under the Census approach the bottom fifth of the population contains a smaller number of people than each of the other fifths of the population do. As a result, the Census approach understates the amount of income going to the bottom fifth of the population.
3. Over the past year, the Center on Budget and Policy Priorities has released two reports on income distribution based on the IRS data. These reports were written because CBO was still developing its new methodology and had not provided income data for any year after 1995 under its old methodology. The IRS data contained information not otherwise available on income trends among the top one percent of the population through 1998. For the latest of these two reports, see Isaac Shapiro, "The Latest IRS Data on After-tax Income Trends," Center on Budget and Policy Priorities, February 26, 2001.
4. Peter Gottschalk and Sheldon Danziger, "Family Income Mobility - How Much is There, and Has It Changed?" in James A. Auerback, and Richard S. Belous, eds. The Inequality Paradox: Growth of Income Disparity. (Washington, DC: National Policy Association) 1998.
5. Daniel P. McMurrer and Isabel V. Sawhill, "How Much Do Americans Move Up and Down the Economic Ladder," The Urban Institute, November 1996.

Search | Publication Library | Job Opportunities | Internship Information

To join the Center's e-mail notification list, ask questions,
or send comments, write to [email protected]
Center on Budget and Policy Priorities
820 First Street, NE, Suite 510
Washington, DC 20002
Ph: (202) 408-1080
Fax: (202) 408-1056