
HOW STRONG IS THE CASE FOR MAJOR RATE
REDUCTIONS
FOR HIGH-INCOME TAXPAYERS?
| PDF of this factsheet View PDF of full report HTML of full report View PDF of summary If you cannot access the file through the link, right-click on the underlined text, click "Save Link As," download to your directory, and open the document in Adobe Acrobat Reader. |
On March 6, the Center on Budget and Policy Priorities released Income Tax Rates and High-Income Taxpayers: How Strong Is the Case for Major Rate Reductions? The report finds that the share of income taxes paid by high-income families has grown over the past decade primarily because these families have experienced dramatic increases in their incomes, not as is often claimed because of marginal tax rate increases enacted in the early 1990s. The after-tax income of the top one percent of tax filers grew 47 percent between 1992 and 1998, nearly six times more than the percentage increase for the bottom 95 percent of filers. The Administration's plan and the House bill would both exacerbate the trend over the past several decades of increasing disparities in incomes.
The report primarily uses the latest Internal Revenue Service tax and income data available, which sometimes is for 1997 and other times is for 1998. The findings include:
- The percentage of overall income that taxpayers pay in income taxes — the average income tax rate — is considerably lower than the marginal tax rate and has increased to a much lesser degree over the past decade. Average income tax rates remain below 20 percent even for most higher-income taxpayers. In addition, the average tax rates for the top one percent of families fell significantly between 1996 and 1998.
- While the top one percent of filers now pay a much larger share of all income taxes than they did at the end of the 1980s, the primary reason is that their share of national income has risen significantly. This increased income concentration is responsible for about two-thirds of the increase in their share of income taxes paid. In addition, the share of all federal taxes paid by the top one percent is much lower than their share of income taxes.
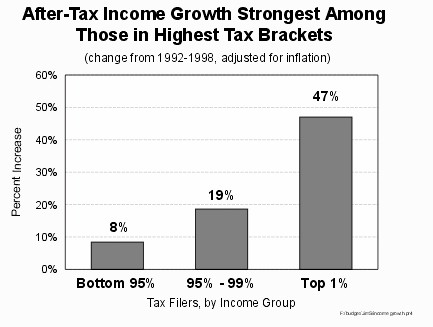
Even after taxes are taken out, incomes among filers with the highest incomes have risen fastest. Between 1992 (the year before the highest marginal rate brackets were created) and 1998, the average after-tax incomes of the top one percent of tax filers rose by nearly half; among the bottom 95 percent of the population, after-tax incomes increased a modest eight percent.
- Combining the recent data on after- and before-tax income from the IRS with older data from the Congressional Budget Office and the Census Bureau, it appears that income disparities are greater now than at any time since the end of World War II.
- The sharp rise in incomes among filers in the highest tax brackets — the group whose marginal tax rates were raised in the early 1990s — calls into question the claim that these higher marginal tax rates somehow sapped risk-taking, entrepreneurship, and work effort among high-income individuals.
The report concludes that any tax cut should tilt against the trend of widening income disparities or, at a minimum, not exacerbate this trend. This goal can be achieved only if the share of the tax cuts that high-income families receive is no greater than their share of the national after-tax income. The Administration's tax proposal, as well as the bill on which the House of Representatives will vote on March 8, fail to meet this standard. (Also see the Center analysis, "Bush Tax Cut and House Rate Cut Widen Record After-tax Income Disparities.")
- The House bill includes the Administration's proposal to reduce marginal tax rates above 15 percent. These rate reductions, which constitute the costliest part of the President's overall tax package, would have no effect on a significant majority of tax filers. In 1997, less than one-quarter of all tax filers were in tax brackets higher than the 15 percent bracket, and only four percent of tax filers were in the top three tax brackets.
- Most low- and many moderate-income families would not be affected by any of the Bush proposals, including the one to establish a new 10 percent bracket, because they do not owe federal income taxes. Many of these families pay significant amounts of other taxes.
- An analysis of the House bill by Citizens for Tax Justice finds that 44 percent of the tax-cut benefits would flow to the top one percent of taxpayers. This is substantially larger than the share of after-tax income these individuals receive. As a result, under the House bill the average after-tax incomes of the top one percent of taxpayers would rise by 3.8 percent, more than three times the after-tax income gain of 1.2 percent for those in the middle fifth of the income spectrum.
- The trend is very similar when looking at the entire Bush tax-cut package. Based in part on estimates of the distribution of the estate tax from a comprehensive Treasury Department study, the Center estimates the top one percent of taxpayers would receive 39 percent of the overall Bush tax cuts, far more than their share of after-tax income. After-tax income for the top one percent would grow by 6.2 percent, compared to a growth of 1.9 percent and 0.6 percent for the middle- and lowest-income fifths of families, respectively.
| Top 1% | Next 4% | Next 15% | Fourth 20% | Middle 20% | Second 20% | Lowest 20% | |
| Bush Package | 6.2% | 2.4% | 2.4% | 2.3% | 1.9% | 1.2% | 0.6% |
| House Bill | 3.8% | 0.6% | 1.1% | 1.2% | 1.2% | 1.0% | 0.5% |