House Budget Resolution Would Require Much Deeper Cuts in Key Low-Income Programs than Senate Budget Plan
Depth and Breadth of Cuts a Key Issue in the Budget Resolution Conference
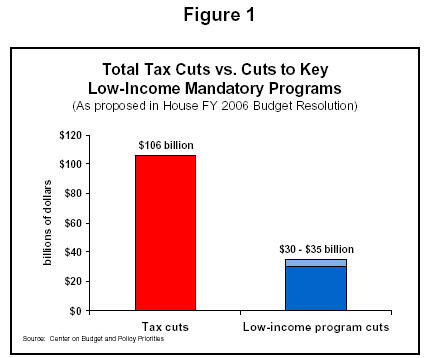
The budget resolutions passed by the House and Senate in mid-March differ sharply in the size of their cuts in key “mandatory” (or “entitlement”) programs that assist low-income families with children, the elderly, and people with disabilities. The House Budget Resolution calls for an estimated $30 billion to $35 billion in cuts over the next five years in Medicaid, food stamps, and low-income programs under the jurisdiction of the House Ways and Means Committee, such as the Earned Income Tax Credit (EITC), the Supplemental Security Income (SSI) program, foster care and adoption assistance, the Temporary Assistance for Needy Families (TANF) block grant, and child care.
The Senate Budget Resolution, by contrast, does not include cuts in low-income mandatory programs other than the Food Stamp Program. The Senate budget plan would require the Agriculture Committee to make $2.8 billion in cuts over five years to farm and nutrition programs, a portion of which is expected to come from food stamps.
In other words, the House budget plan’s cuts to low-income mandatory programs would be at least ten times larger than those in the Senate budget plan. This difference will be a key issue when congressional conferees meet to develop a compromise budget resolution. How the issue is resolved will have a significant impact on vulnerable populations, in areas such as:
- Health care. The House Budget Resolution would require between $14.9 and $20 billion in cuts to Medicaid and/or the State Children’s Health Insurance Program (SCHIP). Medicaid will serve an estimated 58 million Americans over the course of 2005, including 28 million children, 9 million people with disabilities, and 5 million elderly individuals.[1] SCHIP serves more than 5 million children. The House budget plan does not indicate how these cuts — which are significantly larger than those the Bush Administration proposed (as estimated by the Congressional Budget Office) — would be made. But cuts of this magnitude are virtually certain to leave states with fewer resources to meet the health care needs of vulnerable residents and to result in significant reductions in the number of people covered by Medicaid or the quality of the coverage they receive.
- Tax Relief and Wage Supplements for Low-Income Working Families. The House Budget Resolution would require the House Ways and Means Committee to cut $18.7 billion from programs under its jurisdiction. When asked how the Budget Committee assumed the Ways and Means Committee would achieve this cut, Budget Committee Chairman Jim Nussle mentioned only one program: the EITC, a refundable tax credit that provides tax relief and wage supplements to low-income working families.
If the Ways and Means Committee were to achieve all of its $18.7 billion in cuts from the EITC, the credit would have to be cut by $3.9 billion in 2006, or 11 percent. This could be achieved by reducing the average EITC by about $190 annually. If the Committee sought to achieve half of its required cuts from the EITC, it would have to cut the EITC by nearly $2 billion in 2006. - Income assistance for the elderly and people with disabilities. If the Ways and Means Committee does not achieve all of its required cuts from the EITC, it might choose to make some cuts in the Supplemental Security Income (SSI) program, which provided modest income assistance to 6.9 million poor seniors and individuals with disabilities in 2003.[2] If, for example, the Committee met its target by cutting all low-income programs under its jurisdiction by the same percentage, SSI would be cut by $4.8 billion over five years and by $1.2 billion in 2006 alone. Achieving this cut by reducing the number of recipients would mean dropping some 222,000 poor elderly individuals and people with disabilities from the program.
- Funding for states for key human services. The Ways and Means Committee also has jurisdiction over a set of programs that provide funding for states for key human services, including basic assistance and welfare-to-work programs for poor families with children, child care subsidies, services and assistance for abused and neglected children and foster and adoptive families, child support enforcement services, and adult day care for the elderly. If all low-income programs under the Ways and Means Committee were cut by the same percentage, this set of programs would be cut by $4.1 billion over five years and by $1.1 billion in 2006 alone. That would leave states with the choice of cutting these services or spending more of their own money on them — money that would have to come from tax increases or other state priorities, such as education or transportation.
Budget Plans Also Call for Significant Cuts to Domestic Discretionary Programs
This analysis compares the level of cuts in low-income mandatory programs in the House and Senate budget plans. Both plans also call for more than $200 billion in reductions to domestic discretionary programs. (These are programs whose funding is set each year through the appropriations process; they fund government services such as education, environmental protection, federal law enforcement, and transportation.)
- Food stamps. The House budget plan assigns $5.3 billion in cuts to the Agriculture Committee, which has jurisdiction over various farm, nutrition, and conservation programs, including the Food Stamp Program. In 2004, the Food Stamp Program provided 23.9 million low-income individuals with help buying groceries.[3] House Agriculture Committee leaders have indicated they are likely to make cuts to food stamps that are significantly deeper than the $600 million in cuts the Administration has proposed. The U.S. Department of Agriculture estimated that the Administration’s cuts would cause 300,000 people to lose food stamps. Most of those affected would be members of low-income working families with children. If Congress enacts deeper cuts, more people could lose some or all of their food stamps. Food Stamp benefits currently average about $1 per person per meal. (The Senate Budget plan, by contrast, assigns $2.8 billion in cuts to the Agriculture Committee.)
While differing sharply in their treatment of low-income mandatory programs, the House and Senate budget resolutions largely agree in calling for significant tax cuts that largely benefit higher-income Americans: the House plan contains $106 billion in tax cuts over five years; the Senate plan contains $129 billion. In fact, because both budget resolutions include these tax cuts and sizeable defense spending increases, both the House and Senate budget plans would increase the deficit as compared to the budget shortfall that would result under current policies.
Thus, if the House prevails on the issue of cuts in low-income mandatory programs, the final budget resolution will set the stage for budget legislation later this year that provides tax benefits primarily to higher-income households while cutting health care, nutrition assistance, and other forms of aid for poor children, working-poor families, the elderly, and individuals with disabilities. Quite possibly, these cuts could include raising taxes for some working poor households as a result of cuts in the Earned Income Tax Credit.
Half of All Cuts in Mandatory Programs Could Come from Low-Income Programs
The House Budget Resolution approved on March 17 would cut mandatory programs by a total of $68.6 billion over the five-year period from 2006 through 2010. About half of these cuts likely would come from programs assisting low-income Americans[4]:
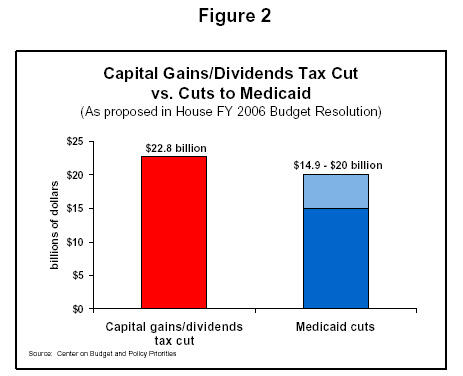
- Medicaid/SCHIP cuts would total between $14.9 billion and $20 billion.[5] For the purpose of comparison, this is roughly equal to the amount that the three to four percent of households with incomes above $200,000 would receive from the budget resolution’s extension of capital gains and dividend tax cuts (see page 10 below).[6]
- The House Ways and Means Committee, which oversees many key low-income mandatory programs, would be required to cut its programs by $18.7 billion. At least $14.8 billion of these cuts would likely come from programs designed to assist vulnerable people, such as: the EITC, SSI, foster care and adoption assistance, the low-income (or refundable) portion of the child tax credit, TANF, child care funding, the Social Services Block Grant, and child support enforcement.[7]
This $14.8 billion amount is roughly equivalent to the total amount that households with incomes exceeding $1 million will receive in tax cuts over the next five years from two tax cuts enacted in 2001 that are not yet in effect and are slated to phase in starting in 2006. The two tax cuts in question, which repeal existing restrictions on the personal exemption and itemized deductions for taxpayers at high income levels, affect only high-income households. (See below.)
Background on Programs Targeted for Cuts Under the House Budget Resolution
Medicaid/SCHIP: In 2005, Medicaid will provide health care to an estimated 58 million low-income Americans, including 28 million children, 5 million seniors, and 9 million people with disabilities. Prior to Medicaid’s creation in 1965, poor uninsured Americans depended on a patchwork system of care and were essentially reliant on the charity of public and nonprofit hospitals, clinics, and certain physicians. Research has shown that Medicaid improves health — particularly among children, who are much more likely to have seen a doctor recently or to have received preventive care if they have Medicaid than if they are uninsured. (While more than 70 percent of Medicaid costs are for the elderly and people with disabilities, about half of all Medicaid recipients are children.) The State Children’s Health Insurance Program (SCHIP) was created in 1998 to provide health insurance coverage for more low-income children who would otherwise be uninsured. It currently serves more than 5 million children and has, along with Medicaid, significantly reduced the number of low-income children who lack health care coverage.
EITC: Established in 1975, the Earned Income Tax Credit provided tax relief and supplemented wages for 21 million low-income working families and individuals in 2003. Research shows the EITC significantly increases employment levels and lifts more children out of poverty than any other program. In 2002, some 2.7 million children — and 4.9 million people overall — were lifted out of poverty by the EITC.
Supplemental Security Income: SSI provided a modest but important level of income security to 6.9 million poor seniors and people with severe disabilities in 2003. SSI benefits are too low by themselves to lift someone above the poverty line, but in combination with other income sources such as the income of family members, SSI helped lift 2.1 million people above the poverty line in 2002. SSI also enabled 2.3 million people to escape deep poverty by lifting their incomes above half of the poverty line.
Food Stamps: The Food Stamp Program was created in the 1960s in response to concern about widespread hunger in poor communities. While hunger still exists in the United States, the Food Stamp Program — along with the school meal programs and WIC — has made hunger (and the health problems associated with it) relatively rare. In 2004, food stamps helped 24 million people, including about 12 million children and 2 million elderly individuals, buy food each month by providing them with electronic debit cards that can be used only to purchase food. Food stamp benefits, often together with other benefits, lifted 2.7 million people out of poverty in 2002 and another 2.0 million people above half of the poverty line.
TANF: States use TANF block grant funds for a broad array of benefits and services for low-income families with children. While less than 40 percent of TANF funds are spent for basic income assistance for poor families, this remained an important support for 5.4 million of the poorest Americans in 2004. States also use TANF funds for welfare-to-work programs, child care assistance, transportation aid, teen pregnancy prevention, and services for abused and neglected children.
Child care: In 2004, some 2.3 million low-income children receive child care subsidies funded through the child care block grant, TANF, and the Social Services Block Grant. Child care subsidies help low-income working parents afford care for their children while they are at work. Thus, child care assistance is an essential part of welfare reform — several studies have shown that it has played a major role in increasing the share of low-income single mothers who are employed. Child care subsidies also may help some parents afford higher-quality child care that may be safer and better prepare them for school.
Child Support Enforcement: In 2003, the Child Support Enforcement (CSE) system collected $21 billion in child support for almost 9 million children and established paternity (legal father-child relationships) for 1.5 million children. In 2002, child support income lifted 1 million people out of poverty. Since 1996, when a series of changes were made to the CSE system, child support collections have risen dramatically and the number of legal father-child relationships established by CSE has more than tripled. Moreover, a recent study by leading researchers in the field shows that a significant share of the decline in the AFDC\TANF caseload in recent years may be due to improvements in child support enforcement.
Foster care, adoption assistance, and other child welfare services: Federal funding helps states provide services to abused and neglected children and provide financial support to foster and adoptive families. In 2003, some 557,000 children received federally-funded foster care and adoption assistance. Federal funds also are to help find appropriate foster care placements, to provide supportive services to families who adopt children from foster care, and to help prepare older children in foster care for independent living.
| Table 1: | ||
| Program Areas | House | Senate |
| Medicaid/SCHIP | at least $14.9 billion | $0 |
| Food Stamps | up to $5.3 billion | up to $2.8 billion |
| Ways and Means Committee programs, such as: EITC, SSI, foster care/adoption assistance, TANF, child care, child support, Social Services Block Grant | $14.8 billion | $0 |
| Total | $30 billion - $35 billion[8] | up to $2.8 billion |
| Source: Center on Budget and Policy Priorities calculations based on data provided in the House Budget Resolution and the Congressional Budget Office re-estimate of the proposals included in the President’s FY 2006 proposed budget. | ||
- The Agriculture Committee would be required to cut farm, nutrition, and conservation programs by $5.3 billion, much of which could come from food stamps. The President’s budget called for $600 million in food stamp reductions between 2006 and 2010; these reductions would drop an estimated 300,000 individuals from the Food Stamp Program. Some Agriculture Committee members have indicated that they intend to make much deeper cuts in food stamps than the Administration has proposed so they can substantially minimize (or even eliminate) the need to make cuts in farm price supports. Food stamps consequently could be cut by as much as $5.3 billion.
A $5.3 billion cut in the Food Stamp Program would be equivalent to about half of the benefits that households with incomes over $1 million would receive as a result of action to extend the capital gains and dividend tax cuts through 2010.
Altogether, these cuts in low-income mandatory programs would total between $30 and $35 billion over five years; this represents between 44 percent and 51 percent all the cuts proposed in mandatory programs under the House Budget Resolution.[9] The lower figure assumes $600 million in food stamp cuts — the level of cuts in the President’s budget; the higher figure assumes $5.3 billion in food stamp cuts. Both figures assume a Medicaid cut of $14.9 billion rather than the possible cut of as much as $20 billion. Both figures also assume that $14.8 billion of the total $18.7 billion in cuts in programs in the Ways and Means Committee would come from low-income programs.)
The Senate Budget Resolution, by contrast, includes no cuts in Medicaid or other programs under the jurisdiction of the Senate Finance Committee (which oversees the EITC, SSI, TANF, and other low-income programs under the jurisdiction of the Ways and Means Committee in the House). The Senate Budget Resolution would require the Agriculture Committee to cut $2.8 billion from farm, conservation, and nutrition programs; the committee chair has indicated that some of these cuts will come from food stamps. Unlike the chair of the House Agriculture Committee, however, the Senate Agriculture Committee chair has also said he intends to achieve some savings from farm subsidy and conservation programs.
How Would the Cuts Affect Vulnerable Americans?
Budget resolutions do not explain how the cuts they call for would be achieved. For example, the House budget plan does not specify which programs under the jurisdiction of the Ways and Means Committee would be cut to achieve that committee’s required $18.7 billion in reductions.
Nevertheless, it is clear that if the final budget resolution includes cuts at or near the levels required by the House plan, low-income working families would be likely to face cuts in key work supports, poor seniors and individuals with disabilities could face cuts in basic assistance and health care, and poor children could face cuts in services such as child support enforcement and foster care and adoption services.
- Less health care for poor elderly individuals, people with disabilities, children and others. The House Budget Resolution calls for between $14.9 and $20 billion in Medicaid/SCHIP cuts over the next five years. This is significantly more than the $7.6 billion in savings, as estimated by the Congressional Budget Office, that would be achieved by the Medicaid and SCHIP proposals in the President’s budget.
A reduction of this magnitude is equivalent to the complete elimination of federal funding for the SCHIP program for three to four of the next five years. Alternatively, the cuts are equivalent to the savings that would be achieved by eliminating federal funding for Medicaid coverage for between 1.8 million and 2.5 million low-income parents, primarily working mothers, for each of the next five years. (These comparisons are meant to illustrate the magnitude of the cuts, not project how Congress would change the Medicaid or SCHIP program to achieve this level of cuts.) - Less tax relief and reduced wage supplements for low-income working families. The EITC was the only program House Budget Committee Chairman Jim Nussle mentioned when asked how his committee assumed the Ways and Means Committee would achieve its required cuts. If the Ways and Means Committee made all of its required cuts through the EITC, the credit would be cut by $3.9 billion (11 percent) in 2006. To achieve reductions of this magnitude, 2 million families could be cut from the program or the average EITC for the 21 million low-income working families that receive the credit could be cut by about $190 annually. If the committee made half of its required cuts through the EITC, the credit would be cut by about $2 billion in 2006. A cut of that magnitude could be achieved by terminating EITC benefits to 1 million low-income working families or by reducing the average EITC by nearly $100 annually.
If the Ways and Means Committee did not target the EITC for disproportionate cuts but instead cut all low-income programs under its jurisdiction by the same percentage, the EITC would be cut by $4.2 billion over five years and by $1.1 billion in 2006.[10] Under such a scenario, the refundable portion of the child tax credit available to low-income working families would be cut as well, by $1.6 billion over five years. - Less income assistance to poor seniors and people with disabilities. SSI, which provided modest income assistance to 6.9 million poor seniors and individuals with disabilities in 2003, is the largest low-income program under the jurisdiction of the Ways and Means Committee. The program currently provides a single individual with benefits equal to only three-quarters of the federal poverty line.
If the Ways and Means Committee does not achieve all or nearly all of its required cuts through the EITC, it could decide to look to SSI and other low-income programs for reductions. If the Committee cut SSI by the same percentage as all other low-income programs under its jurisdiction, SSI would absorb about one-third of the total cuts, or $4.8 billion over five yearsand $1.2 billion in 2006.[11] If that cut in 2006 were achieved by reducing the number of people who receive SSI benefits, 222,000 seniors and individuals with disabilities would have to be terminated from the program.[12] - Reduced state human service funding for states. The Ways and Means Committee has jurisdiction over a set of programs that provide funding to states for important services, including: income assistance and welfare-to-work programs for families with children, child care subsidies for low-income families, child support enforcement services, services for abused and neglected children and foster and adoptive families, and services such as meals-on-wheels and adult day care for the elderly. If the committee were to cut all of the low-income programs under its jurisdiction by the same percentage, the programs that support state human services — the Temporary Assistance for Needy Families block grant, the child support enforcement program, the Social Services Block Grant (SSBG), the child care block grant, and the foster care and adoption assistance programs — would be cut by $4.1 billion over five years, and by $1.1 billion in 2006 alone.
Under this scenario, states would lose $2.4 billion over the next five years, and $660 million in 2006, in TANF and child care funding. In 2006, this is equivalent to the cost of providing child care assistance (which is funded with both TANF and child care block grant funds) to 132,000 children.
In addition, cuts in child support enforcement funding could lead to a reduction in the amount of child support collected. On average, states collect more than $4 in child support for every $1 they spend on child support enforcement, so a $560 million cut in child support enforcement funding — the cut that would result if all low-income programs were cut by the same percentage — could lead to a loss of up to $2.4 billion in child support collections.
Also, critical services and assistance for abused and neglected children are funded through the foster care and adoption assistance programs, the Independent Living Program, SSBG, and TANF. Cuts in federal funding for these programs would force states to use more of their own funds for these services or reduce the aid they provide these children. The danger of such reductions is made stark by data from HHS showing that more than 4 of every 10 children that have been found by a child protection agency to suffer from abuse or neglect already receive no services.[13]
| Table 2: | |
| Supplemental Security Income | $4.8 billion |
| Earned Income Tax Credit (refundable portion) | $4.2 billion |
| TANF and Child Care Block Grant (combined) | $2.4 billion |
| Child Tax Credit (refundable portion) | $1.6 billion |
| Foster Care and Adoption Assistance | $910 million |
| Child Support Enforcement | $560 million |
| Social Services Block Grant | $210 million |
| Source: Center on Budget and Policy Priorities. Note: These calculations assume that Medicare and Social Security are not cut, that Administration proposals regarding cuts in unemployment insurance and elimination of payments related to trade “dumping” disputes are adopted, and that all other programs in the committee’s jurisdiction are cut by the same percentage. | |
Budget Finds Room for Tax Cuts for High-Income Households
Both the House and Senate budget resolutions call for substantial tax cuts over the next five years: $106 billion in the House, and $129 billion in the Senate. (The combination of these tax cuts and the budgets’ increases in funding for defense mean that both the House and Senate budgets increase deficits over the next five years, compared to the deficits that would occur under current federal fiscal policies.) High-income households, which have benefited the most from the tax cuts already enacted, would again be the biggest winners from many of the proposed tax cuts being discussed.
For example, both budget plans assume that the capital gains and dividend tax cuts now scheduled to expire in 2008 would be extended.[14] Data from the Urban Institute-Brookings Tax Policy Center show that more than half of the benefits from extending these tax cuts would go to taxpayers with incomes over $500,000. About three-quarters of the benefits would go to taxpayers with incomes over $200,000.
The dividends/capital gains proposal would cost $23 billion through 2010. This equals about two-thirds of the House budget plan’s cuts in low-income mandatory programs. In other words, the budget plan could have eliminated most of its cuts in low-income mandatory programs without worsening the deficit if it did not extend this set of tax cuts.
Alternatively, Congress could have extended the capital gains and dividend tax cuts but offset their cost by adopting revenue-raising measures that close unproductive tax breaks and reduce tax avoidance. In January, the Congressional Joint Committee on Taxation issued a major report outlining options to achieve about $190 billion in tax savings over the next five years (and $400 billion over ten years) through such types of measures.[15]
Another alternative to making large cuts in low-income mandatory programs would have been to cancel two tax cuts enacted in 2001 that have not yet started to take effect and that will benefit only households with high incomes.[16] Analysis by the TaxPolicyCenter shows that 97 percent of these two tax cuts — which repeal existing limits on personal exemptions and certain itemized deductions for high-income taxpayers — will go to the 3 percent to 4 percent of taxpayers with incomes above $200,000. Canceling these two tax cuts before they take effect would increase revenues by $27 billion over the next five years, an amount that is equal to most of the cuts in low-income mandatory programs in the House budget and is greater than the proposed cuts in Medicaid and food stamps combined.
It is worth noting that even if Congress were to allow the capital gains and dividend tax cuts to expire (or cancel the two tax cuts that have yet to take effect) high-income households would continue to fare extremely well under other tax cuts adopted since 2001. Households with incomes of over $1 million, for instance, will receive an average of $65,000 in tax breaks in 2005 even without counting the average tax cut of $38,000 they will receive from the capital gains and dividend tax cuts.
Conclusion
The cuts in low-income mandatory programs in the House budget plan would likely result in more low-income Americans being uninsured or underinsured, fewer key supports for low-income working families with children, increased poverty among seniors and people with disabilities, and less nutrition assistance for poor households. In addition, shortfalls in state human service budgets could lead to reductions in services such as child care, assistance for abused and neglected children, and seniors’ programs.
These reductions are not part of a shared-sacrifice budget that reins in the deficit and restores fiscal discipline. Both the House and Senate budget plans include large tax cuts that would primarily benefit high-income households. A budget plan that includes the cuts in low-income programs that the House budget does alongside the tax cuts called for under both the House and Senate budget plans, is one that demands painful sacrifices from the lowest-income Americans while conferring more tax benefits on wealthy Americans and increasing the federal deficit at the same time.
Appendix: Potential State-by-State Impacts of Cuts in Low-Income Mandatory Programs Under the House Budget Resolution
As discussed in the analysis, a Congressional budget resolution does not provide specifics about how cuts assigned to each congressional committee will be achieved. Committees can select which of the mandatory programs under their jurisdiction to cut and which program rules to change to achieve savings.
The tables below show the state-by-state distribution of cuts that could be made under the House budget plan in Medicaid, in food stamps, and in some key low-income programs under the jurisdiction of the House Ways and Means Committee. The data in the tables are not precise estimates of how final budget reconciliation legislation would affect each state, since the precise level of cuts and the state-by-state distribution of those cuts ultimately will depend on how the legislation is designed. The data presented here are intended to provide policymakers and the public with a sense of how their states might be affected by cuts of the magnitude called for in the House Budget Resolution.
- Medicaid: Table A-1 shows estimated Medicaid cuts by state. This table provides an estimated range for the cut for each state. The estimate at the low end of the range reflects the projected cuts if the total Medicaid cut equals $14.9 billion nationally — this is the level of cuts that would be required if the House Energy and Commerce (the committee with jurisdiction over the Medicaid program) adopted the Administration’s proposals in the areas of electromagnetic spectrum sales and the power marketing administrations and achieved the remaining reductions through cuts to Medicaid. The estimate at the top of the range reflects the projected cuts if the total national cut to the Medicaid program is $20 billion, the total level of cuts assigned to the Energy and Commerce Committee.
- Food Stamps: Table A-2 shows estimated food stamp cuts by state. This table also provides an estimated range for the cut in each state. The lower-end estimate assumes that half of the cuts assigned to the House Agriculture Committee are achieved by food stamp cuts. The upper-end estimate assumes that all of the cuts assigned to the Agriculture Committee are achieved by cutting food stamps. (The House Agriculture Committee could choose to achieve less than half of the cuts from food stamps; these estimates are intended to provide estimates of two possible scenarios.)
- Programs under the jurisdiction of the Ways and Means Committee: Table A-3 provides estimates for a set of key low-income mandatory programs under the jurisdiction of the House Ways and Means Committee. In this table, the total level of cuts nationally in each of program was estimated by assuming that: (1) the Ways and Means Committee would not cut the Medicare program, consistent with statements by House Budget Committee Chairman Nussle; (2) cuts to the unemployment insurance program would be those proposed by the Administration (as estimated by the Congressional Budget Office); and (3) all other programs under the jurisdiction of the committee would be cut by the same percentage.
- Total Cuts in Key Low Income Programs: Table A-4 provides estimates of the combined level of cuts from each of the programs analyzed in Tables A1- A3: Medicaid, food stamps, EITC, SSI, TANF and child care, foster care and adoption assistance, child support enforcement, and the social services block grant.
It should be noted that this analysis does not distribute cuts in the refundable portion of the child tax credit by state. If all low-income programs under the Ways and Means Committee are cut by the same percentage, the refundable portion of the child tax credit — the portion of this tax credit provided to some low-income working families with children that exceeds the family’s income tax liability — would be cut by $1.6 billion over the next five years. It appears unlikely that Congress would cut this particular tax credit. If Congress chose not to reduce the refundable child tax credit, however, other programs under the Ways and Means Committee would need to be cut more deeply than shown in this analysis to achieve the overall $18.7 billion in required reductions. - Recipients in Key Low-Income Programs: Table A-5 provides figures on the number of individuals in each state that participate in many of the key low-income programs analyzed in this report. These figures are provided for reference purposes.
For each program, the state-by-state estimates were computed by assuming that each state’s share of the cut in a particular program would equal its share of federal funding for that program in the most recent year for which data are available.
Legislation to make changes in these programs to secure savings could adopt changes that do not affect all states equally. For this reason, these figures should be treated as rough estimates of how individual states (and low-income families in each state) might be affected by cuts of the magnitude that the House Budget Resolution requires.
How to Read the Tables
To illustrate how to use these tables, the findings for a sample state are presented here. Over the period from 2006 to 2010, the effects of the House budget resolution in Alabama include:
- Potential cuts in Medicaid funding could total between $215 million and $288 million. (See Table A-1.)
- Food stamp cuts could total $55 million, if the food stamp program absorbs half of the Agriculture Committee’s cuts, and $110 million, if all of that Committee’s assigned cuts come from the Food Stamp Program. (See Table A-2.)
- Poor elderly individuals and people with disabilities could lose $100.7 million in SSI benefits, while low-income working families could see their EITC cut by $108 million. Federal funding for key human service programs in the state could be reduced by a total of $29.1 million, reflecting a $15 million cut in TANF and child care; a $4.4 million cut in foster care and adoption assistance programs, a $6.3 million cut in child support enforcement, and a $3.3 million cut in the Social Serves Block Grant. (See Table A-3.)
- In combination, all of the above reductions in low-income mandatory programs would amount to between $507 million and $636 million. (See Table A-4.)
The number of recipients who would potentially be affected by the cuts in Alabama would be large. As Table A-5 indicates, in Alabama:
- In June 2003, some 652,000 people received Medicaid. Data from December 2003 show that 59,000 children that also received health care through SCHIP.
- In 2003, some 465,000 households received the Earned Income Tax Credit.
- In December 2003, some 164,000 people with disabilities and elderly individuals received SSI benefits.
- In Fiscal Year 2004, an average of 498,000 people received food stamps each month.
- In 2004, an average of 46,300 people received TANF income assistance each month.
- In fiscal year 2003, an average of 3,000 children each month received federally-funded foster care and adoption assistance.
Cuts under the Senate Budget Resolution
The Senate Budget Resolution calls for cuts in one low-income mandatory program, the Food Stamp Program. The Senate Budget Resolution requires the Agriculture Committee to cut farm, conservation, and nutrition programs by $2.8 billion over the next five years. Agriculture Committee Chairman Chambliss has indicated that a portion of this will come from the Food Stamp Program, but that some of the cuts would be achieved by cuts in other programs as well. Based on the overall level of cuts required, there is a reasonable chance that the food stamp cuts that would be made under the Senate Budget Resolution would not exceed (and could be less than) the President’s proposed cuts in the program, which total $600 million over five years.
Because the Administration’s budget achieved these cuts by a change to a particular food stamp rule that does not affect all states equally and because the cuts under the Senate Budget Resolution in the Food Stamp Program could reflect this Administration proposal, this analysis does not provide state-by-state estimates of the food stamp cuts under the Senate budget plan.
State-by-State Tables
| Table A-1: | |||
| United States | Lower End Estimate $14,900 | Upper End Estimate $20,000 | |
| Alabama | $215 | to | $288 |
| Alaska | 51 | to | 69 |
| Arizona | 333 | to | 447 |
| Arkansas | 187 | to | 251 |
| California | 1,553 | to | 2,085 |
| Colorado | 118 | to | 159 |
| Connecticut | 166 | to | 223 |
| Delaware | 36 | to | 49 |
| District of Columbia | 72 | to | 97 |
| Florida | 670 | to | 900 |
| Georgia | 366 | to | 491 |
| Hawaii | 49 | to | 66 |
| Idaho | 61 | to | 81 |
| Illinois | 427 | to | 573 |
| Indiana | 284 | to | 382 |
| Iowa | 129 | to | 173 |
| Kansas | 107 | to | 144 |
| Kentucky | 241 | to | 323 |
| Louisiana | 282 | to | 379 |
| Maine | 114 | to | 153 |
| Maryland | 208 | to | 279 |
| Massachusetts | 420 | to | 564 |
| Michigan | 411 | to | 552 |
| Minnesota | 237 | to | 319 |
| Mississippi | 226 | to | 304 |
| Missouri | 346 | to | 465 |
| Montana | 44 | to | 60 |
| Nebraska | 79 | to | 106 |
| Nevada | 55 | to | 74 |
| New Hampshire | 55 | to | 74 |
| New Jersey | 358 | to | 481 |
| New Mexico | 148 | to | 199 |
| New York | 2,044 | to | 2,744 |
| North Carolina | 467 | to | 626 |
| North Dakota | 30 | to | 40 |
| Ohio | 622 | to | 835 |
| Oklahoma | 165 | to | 222 |
| Oregon | 159 | to | 213 |
| Pennsylvania | 752 | to | 1,009 |
| Rhode Island | 83 | to | 112 |
| South Carolina | 232 | to | 311 |
| South Dakota | 37 | to | 49 |
| Tennessee | 398 | to | 534 |
| Texas | 906 | to | 1,217 |
| Utah | 85 | to | 113 |
| Vermont | 43 | to | 58 |
| Virginia | 196 | to | 263 |
| Washington | 249 | to | 335 |
| West Virginia | 126 | to | 169 |
| Wisconsin | 215 | to | 288 |
| Wyoming | 21 | to | 28 |
| Note: Assumes that the cut to each state is proportionate to its estimated federal Medicaid funding in FY 2005, as determined from estimates states submitted to CMS in November 2004. The national totals include cuts for the territories, not shown above. | |||
| Table A-2: | ||
| If food stamps absorb half of Agriculture Committee cut | If food stamps absorb entire Agriculture Committee cut | |
| United States | $2,639 | $5,278 |
| Alabama | $55 | $110 |
| Alaska | 7 | 14 |
| Arizona | 62 | 124 |
| Arkansas | 37 | 74 |
| California | 213 | 426 |
| Colorado | 27 | 54 |
| Connecticut | 21 | 42 |
| Delaware | 6 | 12 |
| District of Columbia | 10 | 21 |
| Florida | 136 | 272 |
| Georgia | 99 | 198 |
| Hawaii | 16 | 33 |
| Idaho | 10 | 19 |
| Illinois | 130 | 260 |
| Indiana | 59 | 118 |
| Iowa | 19 | 38 |
| Kansas | 17 | 34 |
| Kentucky | 58 | 116 |
| Louisiana | 81 | 162 |
| Maine | 15 | 30 |
| Maryland | 31 | 61 |
| Massachusetts | 33 | 65 |
| Michigan | 96 | 192 |
| Minnesota | 27 | 53 |
| Mississippi | 39 | 77 |
| Missouri | 71 | 142 |
| Montana | 8 | 17 |
| Nebraska | 12 | 23 |
| Nevada | 13 | 26 |
| New Hampshire | 5 | 9 |
| New Jersey | 40 | 81 |
| New Mexico | 23 | 47 |
| New York | 201 | 402 |
| North Carolina | 81 | 161 |
| North Dakota | 4 | 9 |
| Ohio | 108 | 216 |
| Oklahoma | 43 | 85 |
| Oregon | 44 | 89 |
| Pennsylvania | 100 | 200 |
| Rhode Island | 8 | 16 |
| South Carolina | 54 | 107 |
| South Dakota | 6 | 12 |
| Tennessee | 87 | 174 |
| Texas | 247 | 494 |
| Utah | 13 | 26 |
| Vermont | 4 | 9 |
| Virginia | 51 | 102 |
| Washington | 49 | 98 |
| West Virginia | 25 | 50 |
| Wisconsin | 29 | 58 |
| Wyoming | 3 | 5 |
| Note: Assumes that cuts to states are proportionate to each state's share of nationwide food stamp payments in 2004, the most recent available year. | ||
| Table A-3: | |||||||||
| Grants to States for Human Services | |||||||||
| State | SSI | EITC | TANF and Child Care | Foster Care and Adoption Assistance Programs | Child Support Enforcement | Social Services Block Grant | Subtotal, Grants to States (Ways and Means Programs) | ||
| United States | $4,758.6 | $4,243.7 | $2,432.0 | $914.7 | $557.0 | $208.0 | $4,111.7 | ||
| Alabama | $100.7 | $108.0 | $15.0 | $4.4 | $6.3 | $3.3 | $29.1 | ||
| Alaska | 6.7 | 6.0 | 10.2 | 2.6 | 2.1 | 0.5 | 15.3 | ||
| Arizona | 60.6 | 76.1 | 35.5 | 10.0 | 6.2 | 3.8 | 55.5 | ||
| Arkansas | 51.4 | 57.8 | 9.1 | 6.1 | 4.0 | 2.0 | 21.1 | ||
| California | 1,033.0 | 460.6 | 537.7 | 228.1 | 103.1 | 25.1 | 894.1 | ||
| Colorado | 33.6 | 45.1 | 21.6 | 13.5 | 8.0 | 3.2 | 46.3 | ||
| Connecticut | 33.6 | 28.4 | 38.4 | 11.8 | 6.2 | 2.7 | 59.0 | ||
| Delaware | 8.2 | 10.6 | 4.7 | 1.5 | 2.4 | 0.6 | 9.1 | ||
| Dist. of Columbia | 14.5 | 9.4 | 13.3 | 4.5 | 2.4 | 0.4 | 20.6 | ||
| Florida | 259.4 | 303.9 | 89.7 | 22.8 | 26.1 | 11.8 | 150.4 | ||
| Georgia | 122.1 | 178.8 | 53.0 | 10.3 | 12.1 | 5.7 | 81.2 | ||
| Hawaii | 15.4 | 14.2 | 14.2 | 4.0 | 1.1 | 0.9 | 20.3 | ||
| Idaho | 12.7 | 18.3 | 5.1 | 1.4 | 3.8 | 1.0 | 11.3 | ||
| Illinois | 174.0 | 164.2 | 84.3 | 64.2 | 17.9 | 9.2 | 175.7 | ||
| Indiana | 61.3 | 79.1 | 29.8 | 10.7 | 5.5 | 4.8 | 50.8 | ||
| Iowa | 24.5 | 29.6 | 18.9 | 6.9 | 4.5 | 2.3 | 32.6 | ||
| Kansas | 23.6 | 32.0 | 14.7 | 6.5 | 6.1 | 2.0 | 29.3 | ||
| Kentucky | 113.4 | 64.7 | 26.1 | 9.7 | 5.6 | 2.7 | 44.2 | ||
| Louisiana | 104.8 | 122.8 | 26.1 | 10.4 | 5.6 | 3.8 | 46.0 | ||
| Maine | 18.8 | 14.6 | 11.3 | 5.2 | 1.6 | 0.9 | 19.0 | ||
| Maryland | 61.0 | 63.3 | 33.0 | 24.5 | 10.4 | 3.9 | 71.8 | ||
| Massachusetts | 117.4 | 50.4 | 66.2 | 14.3 | 14.2 | 4.6 | 99.3 | ||
| Michigan | 148.6 | 119.6 | 111.7 | 34.4 | 29.2 | 7.3 | 182.6 | ||
| Minnesota | 43.7 | 42.8 | 38.6 | 13.4 | 13.1 | 3.9 | 69.0 | ||
| Mississippi | 76.4 | 86.1 | 13.8 | 2.3 | 4.9 | 2.0 | 23.0 | ||
| Missouri | 73.1 | 81.8 | 31.3 | 12.6 | 6.4 | 4.2 | 54.4 | ||
| Montana | 8.8 | 12.9 | 6.7 | 2.2 | 1.5 | 0.7 | 11.2 | ||
| Nebraska | 13.3 | 19.6 | 8.4 | 4.6 | 4.3 | 1.3 | 18.5 | ||
| Nevada | 20.4 | 28.5 | 6.9 | 3.3 | 3.8 | 1.4 | 15.4 | ||
| New Hampshire | 7.9 | 10.0 | 5.5 | 2.5 | 4.6 | 1.0 | 13.7 | ||
| New Jersey | 100.1 | 90.1 | 58.2 | 12.0 | 17.1 | 6.1 | 93.5 | ||
| New Mexico | 30.5 | 38.9 | 19.1 | 5.2 | 9.6 | 1.3 | 35.2 | ||
| New York | 458.0 | 279.7 | 351.8 | 97.2 | 29.5 | 13.2 | 491.7 | ||
| North Carolina | 113.8 | 150.4 | 48.7 | 11.2 | 10.9 | 6.1 | 77.0 | ||
| North Dakota | 4.5 | 6.9 | 3.8 | 2.0 | 5.2 | 0.5 | 11.5 | ||
| Ohio | 164.6 | 147.2 | 104.8 | 57.1 | 28.1 | 8.5 | 198.5 | ||
| Oklahoma | 47.0 | 61.4 | 21.3 | 5.9 | 4.4 | 2.5 | 34.2 | ||
| Oregon | 37.3 | 37.8 | 24.2 | 8.6 | 9.7 | 3.1 | 45.5 | ||
| Pennsylvania | 218.4 | 137.3 | 103.6 | 58.3 | 21.3 | 9.1 | 192.3 | ||
| Rhode Island | 20.3 | 11.7 | 13.7 | 3.2 | 0.9 | 0.8 | 18.5 | ||
| South Carolina | 63.5 | 87.1 | 14.4 | 5.2 | 4.5 | 2.8 | 27.0 | ||
| South Dakota | 7.2 | 9.8 | 3.2 | 1.1 | 6.2 | 0.6 | 11.1 | ||
| Tennessee | 100.3 | 108.6 | 30.7 | 5.7 | 7.9 | 4.5 | 48.8 | ||
| Texas | 264.9 | 462.2 | 77.6 | 31.4 | 25.7 | 14.5 | 149.2 | ||
| Utah | 14.0 | 25.1 | 12.3 | 4.1 | 4.8 | 1.0 | 22.1 | ||
| Vermont | 7.8 | 6.1 | 6.8 | 2.8 | 5.0 | 0.4 | 15.1 | ||
| Virginia | 80.7 | 93.5 | 22.8 | 17.2 | 7.3 | 5.8 | 53.1 | ||
| Washington | 75.8 | 61.0 | 58.2 | 12.8 | 10.9 | 4.4 | 86.3 | ||
| West Virginia | 48.7 | 27.0 | 15.9 | 5.3 | 2.9 | 1.4 | 25.5 | ||
| Wisconsin | 54.7 | 50.8 | 45.8 | 17.0 | 11.4 | 4.0 | 78.2 | ||
| Wyoming | 3.5 | 5.9 | 3.1 | 0.4 | 1.0 | 0.4 | 4.9 | ||
| Note: For each program, cuts are allocated by state in proportion to each state’s share of nationwide federal program funding in the most recent available year. | |||||||||
| Table A-4: | |||
| Lower End Estimate | Upper End Estimate | ||
| Alabama | $507 | to | $636 |
| Alaska | 86 | to | 111 |
| Arizona | 587 | to | 763 |
| Arkansas | 354 | to | 455 |
| California | 4,154 | to | 4,899 |
| Colorado | 270 | to | 337 |
| Connecticut | 308 | to | 386 |
| Delaware | 70 | to | 89 |
| District of Columbia | 127 | to | 162 |
| Florida | 1,520 | to | 1,885 |
| Georgia | 847 | to | 1,071 |
| Hawaii | 115 | to | 148 |
| Idaho | 113 | to | 143 |
| Illinois | 1,071 | to | 1,347 |
| Indiana | 534 | to | 691 |
| Iowa | 234 | to | 297 |
| Kansas | 209 | to | 262 |
| Kentucky | 521 | to | 662 |
| Louisiana | 637 | to | 814 |
| Maine | 181 | to | 235 |
| Maryland | 435 | to | 536 |
| Massachusetts | 720 | to | 897 |
| Michigan | 958 | to | 1,195 |
| Minnesota | 420 | to | 528 |
| Mississippi | 451 | to | 567 |
| Missouri | 627 | to | 816 |
| Montana | 86 | to | 110 |
| Nebraska | 142 | to | 181 |
| Nevada | 132 | to | 164 |
| New Hampshire | 91 | to | 115 |
| New Jersey | 682 | to | 845 |
| New Mexico | 276 | to | 350 |
| New York | 3,474 | to | 4,375 |
| North Carolina | 888 | to | 1,129 |
| North Dakota | 57 | to | 72 |
| Ohio | 1,240 | to | 1,562 |
| Oklahoma | 351 | to | 450 |
| Oregon | 324 | to | 422 |
| Pennsylvania | 1,400 | to | 1,757 |
| Rhode Island | 141 | to | 178 |
| South Carolina | 463 | to | 596 |
| South Dakota | 71 | to | 89 |
| Tennessee | 743 | to | 966 |
| Texas | 2,030 | to | 2,587 |
| Utah | 159 | to | 201 |
| Vermont | 77 | to | 96 |
| Virginia | 474 | to | 592 |
| Washington | 521 | to | 655 |
| West Virginia | 252 | to | 320 |
| Wisconsin | 427 | to | 529 |
| Wyoming | 38 | to | 47 |
| Note: Figures in this table are the sum of the figures provided in Tables A1-3. | |||
| Table A-5: | |||||||
| Medicaid June 2003 (monthly* individuals) | SCHIP December 2003 (children) | EITC 2003 preliminary (tax filers) | SSI December 2003 (individuals) | Food Stamps FY 2004 (avg. monthly number of individuals) | TANF Oct. 2003 - June 2004 (avg. monthly number of individuals) | Foster Care/ AdoptionAssistanceFY 2003 (avg. monthly number of children) | |
| U.S. Total | 40,553,000 | 3,927,000 | 20,809,000 | 6,902,000 | 23,854,000 | 5,384,000 | 557,000 |
| Alabama | 652,000 | 59,000 | 465,000 | 164,000 | 498,000 | 46,300 | 2,900 |
| Alaska | 95,000 | 14,000 | 35,000 | 11,000 | 49,000 | 14,100 | 1,500 |
| Arizona | 813,000 | 51,000 | 371,000 | 92,000 | 530,000 | 116,900 | 7,600 |
| Arkansas | 457,000 | ** | 265,000 | 87,000 | 346,000 | 22,800 | 3,700 |
| California | 6,408,000 | 723,000 | 2,282,000 | 1,161,000 | 1,856,000 | 1,279,900 | 106,000 |
| Colorado | 340,000 | 50,000 | 245,000 | 54,000 | 242,000 | 38,400 | 7,800 |
| Connecticut | 377,000 | 14,000 | 158,000 | 51,000 | 196,000 | 56,000 | 4,600 |
| Delaware | 125,000 | 5,000 | 54,000 | 13,000 | 56,000 | 13,300 | 800 |
| Dist. of Col. | 136,000 | 4,000 | 48,000 | 20,000 | 89,000 | 45,200 | 2,300 |
| Florida | 1,982,000 | 319,000 | 1,479,000 | 410,000 | 1,202,000 | 123,700 | 19,200 |
| Georgia | 1,254,000 | 197,000 | 798,000 | 200,000 | 867,000 | 130,700 | 9,900 |
| Hawaii | 179,000 | 11,000 | 79,000 | 22,000 | 99,000 | 36,400 | 2,500 |
| Idaho | 157,000 | 11,000 | 94,000 | 20,000 | 91,000 | 3,400 | 1,300 |
| Illinois | 1,531,000 | 92,000 | 815,000 | 255,000 | 1,070,000 | 89,200 | 50,800 |
| Indiana | 736,000 | 62,000 | 410,000 | 94,000 | 526,000 | 146,300 | 8,500 |
| Iowa | 261,000 | 31,000 | 165,000 | 42,000 | 179,000 | 54,600 | 5,700 |
| Kansas | 229,000 | 31,000 | 167,000 | 38,000 | 170,000 | 42,900 | 4,700 |
| Kentucky | 672,000 | 51,000 | 329,000 | 179,000 | 545,000 | 78,200 | 5,900 |
| Louisiana | 883,000 | 95,000 | 512,000 | 168,000 | 706,000 | 47,400 | 5,900 |
| Maine | 221,000 | 13,000 | 81,000 | 31,000 | 142,000 | 31,900 | 2,900 |
| Maryland | 581,000 | 90,000 | 328,000 | 91,000 | 274,000 | 70,600 | 8,700 |
| Massachusetts | 914,000 | 62,000 | 288,000 | 168,000 | 335,000 | 108,100 | 10,300 |
| Michigan | 1,310,000 | 54,000 | 609,000 | 217,000 | 944,000 | 212,100 | 27,400 |
| Minnesota | 555,000 | 3,000 | 243,000 | 69,000 | 247,000 | 110,400 | 7,700 |
| Mississippi | 585,000 | 61,000 | 360,000 | 126,000 | 377,000 | 43,400 | 1,500 |
| Missouri | 932,000 | 90,000 | 414,000 | 115,000 | 700,000 | 114,600 | 12,200 |
| Montana | 81,000 | 11,000 | 69,000 | 14,000 | 77,000 | 14,500 | 3,000 |
| Nebraska | 191,000 | 23,000 | 104,000 | 22,000 | 114,000 | 30,400 | 2,300 |
| Nevada | 169,000 | 25,000 | 149,000 | 31,000 | 120,000 | 23,600 | 2,600 |
| New Hampshire | 99,000 | 6,000 | 58,000 | 13,000 | 48,000 | 14,400 | 1,100 |
| New Jersey | 810,000 | 98,000 | 464,000 | 149,000 | 369,000 | 114,400 | 10,300 |
| New Mexico | 375,000 | 11,000 | 188,000 | 50,000 | 223,000 | 45,700 | 3,700 |
| New York | 3,761,000 | 457,000 | 1,397,000 | 624,000 | 1,598,000 | 507,500 | 61,300 |
| North Carolina | 1,075,000 | 105,000 | 716,000 | 195,000 | 747,000 | 77,600 | 8,600 |
| North Dakota | 55,000 | 3,000 | 38,000 | 8,000 | 41,000 | 8,000 | 900 |
| Ohio | 1,565,000 | 129,000 | 752,000 | 244,000 | 945,000 | 186,600 | 23,600 |
| Oklahoma | 498,000 | 46,000 | 295,000 | 75,000 | 412,000 | 34,500 | 7,200 |
| Oregon | 382,000 | 20,000 | 204,000 | 58,000 | 420,000 | 41,900 | 10,600 |
| Pennsylvania | 1,567,000 | 137,000 | 739,000 | 310,000 | 961,000 | 227,100 | 20,100 |
| Rhode Island | 174,000 | 11,000 | 62,000 | 29,000 | 78,000 | 39,000 | 2,100 |
| South Carolina | 728,000 | 46,000 | 407,000 | 106,000 | 497,000 | 44,900 | 4,500 |
| South Dakota | 93,000 | 10,000 | 53,000 | 13,000 | 53,000 | 6,000 | 1,100 |
| Tennessee | 1,305,000 | ** | 524,000 | 161,000 | 806,000 | 195,100 | 8,700 |
| Texas | 2,577,000 | 438,000 | 2,040,000 | 455,000 | 2,259,000 | 273,300 | 20,800 |
| Utah | 189,000 | 28,000 | 129,000 | 21,000 | 123,000 | 23,200 | 2,500 |
| Vermont | 99,000 | 3,000 | 36,000 | 13,000 | 43,000 | 13,500 | 1,900 |
| Virginia | 540,000 | 56,000 | 475,000 | 134,000 | 486,000 | 83,000 | 7,700 |
| Washington | 861,000 | 9,000 | 328,000 | 109,000 | 453,000 | 143,200 | 11,800 |
| West Virginia | 289,000 | 23,000 | 142,000 | 75,000 | 256,000 | 41,100 | 2,300 |
| Wisconsin | 631,000 | 38,000 | 280,000 | 89,000 | 324,000 | 55,400 | 7,800 |
| Wyoming | 54,000 | 3,000 | 32,000 | 6,000 | 26,000 | 700 | 500 |
| Notes: *These data represent the number of recipients who were enrolled in the Medicaid program in June 2003, according to the Kaiser Commission on Medicaid and the Uninsured. Medicaid figures are often cited in annual terms. For example, the Congressional Budget Office estimates cited in the text of this report show that 58 million individuals are projected to receive Medicaid in at least one month over the course of 2005. The figures in this table, by contrast show the number of recipients in one particular month, June 2003. Similarly, the SCHIP figures show the number of children enrolled in SCHIP in a single month, December 2003. ** Prior to the enactment of SCHIP, these states had expanded Medicaid eligibility to low-income children. When SCHIP was enacted, these states declined to use SCHIP funds to expand eligibility further and, thus, do not use their allotted SCHIP funds. | |||||||
Sources:
Medicaid figures are data reported by states to the Kaiser Commission on Medicaid and the Uninsured, rounded to the nearest thousand. (See: http://www.kff.org/medicaid/7237.cfm).
SCHIP figures are data reported by states to the Kaiser Commission on Medicaid and the Uninsured, rounded to the nearest thousand. (See: http://www.kff.org/medicaid/7134.cfm).
EITC figures are unpublished IRS data for tax year 2003 and are preliminary, covering taxes filed through June 2004. They are rounded to the nearest thousand.
SSI figures are from the Social Security Administration, and are rounded to the nearest thousand. (See http://www.ssa.gov/policy/docs/statcomps/ssi_sc/2003/ssi_sc03-1.pdf, Table 1.)
Food stamp figures are an average of monthly data for persons from the U.S. Department of Agriculture, rounded to the nearest thousand. (See http://www.fns.usda.gov/pd/fspmain.htm.)
TANF figures are from the U.S. Department of Health and Human Services, rounded to the nearest hundred and represent the average monthly number of recipients from October 2003 to June 2004. http://www.acf.hhs.gov/programs/ofa/caseload/caseloadindex.htm.)
Foster Care and Adoption Assistance figures are unpublished data from the U.S. Department of Health and Human Services, rounded to the nearest hundred.
End Notes
[1] These are Congressional Budget Office estimates of the number of individuals who will participate in the Medicaid program at any point during 2005. Unlike participation figures in other programs, these do not represent the average monthly Medicaid caseload.
[2] The 6.9 million figure reflects the number of SSI recipients in December 2003.
[3] The 23.9 million figure represents the average monthly number of individuals who received food stamps in FY 2004.
[4] Based on the proposals in the President’s budget, most of the non-low-income cuts in the House-passed budget resolution are likely to come from increased Pension Benefit Guarantee Corporation premiums (which count as reductions in mandatory spending), proceeds from the sale or lease of cellular broadcast rights, proposals related to power marketing administrations, changes that reduce federal costs in the student loan programs, repeal of a law related to the treatment of payments of "anti-dumping" duties collected on imports, proceeds from the sale of certain federal lands in Nevada, changes in the unemployment insurance program, and increasing veterans’ health care fees for certain groups of veterans.
[5] The House Energy and Commerce Committee is required to secure $20 billion in cuts. A modest portion of these cuts may be achieved through the sale of cellular broadcast rights, which the President’s budget proposes, and an Administration proposal related to power marketing administrations. The Administration’s proposals in these areas would save $5.1 billion. If those proposals are adopted in full, the remaining $14.9 billion in cuts almost certainly would come from Medicaid and SCHIP. It also is possible that the full $20 billion in savings could come out of Medicaid. See Victoria Wachino, “The House Budget Committee’s Proposed Medicaid and SCHIP Cuts Are Larger Than Those the Administration Proposed,” Center on Budget and Policy Priorities, March 10, 2005..
[6] This calculation is based on estimates of the effects of the tax cuts on different income groups from the UrbanInstitute-BrookingsTaxPolicyCenter and from cost estimates from the Joint Committee on Taxation.
[7] This estimate is calculated by assuming that the Ways and Means Committee will not cut Medicare (as House Budget Committee Chairman Nussle stated during the House Budget Committee mark-up of the budget resolution) or Social Security (under Congressional rules, changes to Social Security cannot be made through the budget reconciliation process). This estimate also assumes that cuts to the unemployment insurance program will not exceed those proposed by the Administration; it seems unlikely that the Congress would cut unemployment insurance, which provides broad-based relief and has a dedicated funding source, more deeply than the President has proposed. Finally, the estimate assumes that Congress will adopt the President’s proposal related to fees recovered from the resolution of “dumping” trade disputes. It is possible that the Congress will not accept the Administration’s unemployment insurance or trade dumping proposals, in which case cuts to low-income programs would likely be higher than assumed here. On the other hand, some members of Congress have suggested that cuts could be made to the Medicare program. If the Medicare program were cut, low-income programs could be targeted for somewhat smaller reductions than estimated here.
[8] This estimate could understate the overall level of cuts if the Energy and Commerce Committee — the committee with jurisdiction over the Medicaid and SCHIP programs — does not accept Administration proposals related to spectrum sales or the power marketing administrations and thus achieves more than $14.9 billion of its $20 billion in assigned cuts from the Medicaid and SCHIP programs. This estimate also could understate the level of cuts that the Ways and Means Committee makes in low-income programs. This estimate could overstate the cuts if these committees decided to cut non-low-income programs in their jurisdictions by a greater amount than the Administration’s budget proposed.
[9]] By contrast, spending on low-income mandatory programs represents a much lower share — 26 percent — of total spending on mandatory programs. Furthermore, the share of the reductions in mandatory programs that would come from low-income programs would far outstrip the much more modest contribution that these programs have made to the return of budget deficits. Measured as a share of the economy, expenditures for low-income mandatory programs increased by 0.6 percent of the Gross Domestic Product between 2000 and 2005 (in substantial part due to increased enrollments in programs caused by the economic slump). This is a very modest fraction of the overall deterioration in the fiscal situation over this period, which amounted to 5.7 percent of GDP. The large majority of the deterioration was due to the fall in revenues.
[10] This estimate of potential cuts to the EITC program was calculated by assuming that low-income programs would absorb $14.8 billion of the $18.7 billion in cuts assigned to the Ways and Means Committee and that all low-income programs under the jurisdiction of the committee would be cut by the same percentage. The remaining savings would come from the adoption of the Administration’s unemployment insurance proposals and the President’s proposal related to dumping trade disputes.
[11]] This estimate assumes that low-income programs would absorb $14.8 billion of the $18.7 billion in assigned cuts to the Ways and Means Committee.
[12] If the cut were implemented by reducing the average benefit for all recipients, they would lose an average of $170 in annual benefits in 2006.
[13] See, U.S. Department of Health and Human Services, Administration on Children, Youth, and Families, Child Maltreatment 2002, (Washington, DC: U.S. Government Printing Office, 2004).
[14] For a full analysis of these tax cuts, see Joel Friedman, “Dividend and Capital Gains Tax Cuts Unlikely to Yield Touted Economic Gains,” Center on Budget and Policy Priorities, March 10, 2005.
[15] Options to Improve Tax Compliance and Reform Tax Expenditures, Joint Committee on Taxation, January 2005. http://www.house.gov/jct/s-2-05.pdf.
[16] See Robert Greenstein, Joel Friedman, and Isaac Shapiro, “Two Tax Cuts That Benefit Only High-Income Households — Primarily Millionaires — Slated to Start Taking Effect in 2006,” Center on Budget and Policy Priorities, revised February
More from the Authors


Areas of Expertise
