
THE NEW, DEFINITIVE CBO DATA
ON INCOME AND TAX TRENDS
By
Robert Greenstein and
Isaac Shapiro
Executive Summary
|
PDF of
full report HTM of press release PDF of press release |
| If you cannot access the files through the links, right-click on the underlined text, click "Save Link As," download to your directory, and open the document in Adobe Acrobat Reader. |
Data issued on August 29 by the Congressional Budget Office[1] show that the income gap between the very wealthy and the rest of the nation widened dramatically in the 1990s for the second consecutive decade. The CBO data, which cover the period from 1979 to 2000, provide the most comprehensive information available on changes in incomes for different income groups.
These data show that the income gap in 2000 was the widest it has been since 1979, and likely was the widest it has been in 70 years, when other corroborating data are taken into account. Because the CBO data go only through 2000, they reflect neither the impact of the recent tax cuts, which have the effect of widening income disparities, nor the effects of recent reductions in capital gains income and executive compensation, which likely mitigated these trends. Nevertheless, the evidence suggests that, by historical standards, those at the top of the income scale continue to receive an exceptionally large share of the nation’s income.
This analysis of the CBO data examines three primary areas: the growth in income experienced by different income groups over the 1979-2000 period, the share of total income received by these different groups, and the federal tax burden faced by these income groups.
Income growth
|
Average after-tax income gain, 1979-2000 |
|
|
Top 1% |
$576,400 |
|
Middle fifth |
$5,500 |
|
Bottom fifth |
$1,100 |
| Source: Congressional Budget Office | |
In both the 1980s and the 1990s, those at the very top of the income scale gained dramatically, with their income gains far surpassing those of other groups.
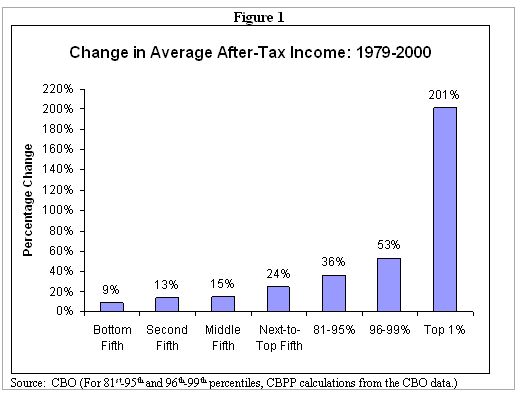
- The CBO data show that between 1979 and 2000, the average after-tax income of the top one percent of the U.S. population tripled, rising by $576,000. Average after-tax income for the top one percent rose from $286,000 in 1979 to $507,000 in 1989 and then to $863,000 in 2000, an increase of 201 percent over the 1979-2000 period. (All figures in this analysis are adjusted for inflation and expressed in their dollar value in 2000.)
- By contrast, between 1979 and 2000, the average after-tax income of the middle fifth of the population rose 15 percent — or $5,500 — to $41,900. The average after-tax income of the bottom fifth rose 9 percent, or $1,100, to $13,700.
Of further interest, although those at the top of the income scale experienced rapid income growth in both the 1980s and 1990s, income growth was more widespread in the 1990s than in the 1980s, with low- and middle-income households faring better — and sometimes substantially better — in the more recent decade. For example, the bottom fifth of the population experienced double-digit after-tax income gains in the 1990s. In the 1980s, it experienced declines. Despite this improvement in the 1990s, low- and middle-income households still fell further behind the most affluent.
Shares of Total Income
As a result of the widely divergent income gains among different groups, the gaps between households at the top of the income scale and those in both the middle and lower end of the scale were much greater in 2000 than they had been two decades earlier.
-
In 1979, the share of the nation’s after-tax income flowing to the top one percent of the population was less than half the share received by the bottom 40 percent of the population. But in 2000, the share of income received by the top one percent exceeded that of the bottom 40 percent. As a result, the 2.8 million people who made up the top one percent of the population received more after-tax income in 2000 than did the 110 million Americans in the bottom 40 percent of the population.
- Other data show that before-tax income was more concentrated among the top one percent of the population in 2000 than at any point since 1929. (These data are from a National Bureau for Economic Research study that covers years through 1998 and subsequently has been extended through 2000.) When these data and the CBO data are examined together, they suggest that the top one percent of the population received a larger share of the national after-tax income in 2000 than at any time in the past 70 years.
Federal Tax Burden
Contrary to claims that taxes were at or near record levels before the 2001 tax cut, the CBO data show that the percentage of income that most Americans paid in federal taxes declined between 1979 and 2000 and was actually at relatively low levels in 2000, in historical terms.
- Among the middle fifth of families, for example, the percentage of income paid in federal taxes — including income, payroll, and excise taxes — dropped from 18.6 percent of income in 1979 to 16.7 percent of income in 2000. The 16.7 percent level was the lowest during the 21-year period the CBO data cover.
- Among the top one percent of taxpayers, the percentage of income paid in federal taxes fell sharply in the 1980s and then rose part of the way back during the 1990s. Still in 2000, this high-income group paid a smaller share of its income in federal taxes than it did in 1979, amounting to a reduction of about $50,000 in the average tax bill of these upper-income households.
- The CBO data also show that before-tax incomes shot up faster among the top one percent of the population during the 1990s — when their federal taxes were increased — than during the 1980s, when their federal taxes were reduced. These results — and the fact that investment and productivity growth accelerated, rather than slowed, in the 1990s — cast doubt on the simple theory that action to increase the tax burdens of those households is economically destructive.
The CBO data indicate that changes in the federal tax system exacerbated the growth in income disparities during the 1980s, but narrowed the growth in the 1990s. In both decades the growth in income disparities largely reflected changes in before-tax income, but the different effects of tax system changes in the two decades is one of several factors that account for the more broad-based income growth that occurred in the 1990s. A primary goal of government policies in the decade ahead should be to replicate this more broad-based growth.
Other Policy Implications
From 1979 to 2000, the incomes of those at the top of the income scale increased sharply, and the share of the national income they receive reached a level apparently not seen since 1929. The general existence of these trends has been known for some time, due to an earlier CBO study that covered years through 1997, as well as a number of other studies.
Tax policy decisions made since 2000, however, have taken little account of these trends. Analyses conducted by the Urban Institute-Brookings Tax Policy Center have found that the 2001 and 2003 tax cuts are providing an average tax cut this year of $26,300 to those in the top one percent of the population and $113,000 to those whose incomes exceed $1 million. The average tax cut for those in the middle fifth of the population, by contrast, is $680.
The large tax cuts of the past few years, with their pronounced tilt toward those with high incomes, have been justified in part on the theory that high-income households needed tax reductions to spur their economic activity and thereby to boost economic growth. Yet this theory is not consistent with the evidence from the 1990s, when incomes among the top one percent of the population jumped sharply even though their taxes increased.
The 2001 tax cuts also were justified, in part, by the notion that tax burdens were high across the board and needed to be reduced. Yet the CBO data show that most groups faced lower average tax burdens in 2000 than in either 1989 or 1979. (1979, 1989, and 2000 represent the peak years in the last three business cycles and thus are appropriate years to compare.)
The new CBO data cover years through 2000, and hence do not reflect changes in incomes since then, including significant declines in capital gains income and CEO salaries that are likely to have reduced average incomes at the top of the income spectrum. The CBO data also do not reflect the effects of the tax cuts enacted in 2001 and 2003. Even with the declines in capital gains income and executive pay in the past few years (declines that could start to be reversed as early as 2003), the evidence suggests that the top one percent of the population continues to receive an exceptionally large share of the national income, by historical standards.
The CBO Data
The Congressional Budget Office developed its data by combining Census Bureau data with Internal Revenue Service data drawn from federal income tax returns. The result is a data set that experts generally agree to be stronger than the standard Census data.
As explained in the appendix, the CBO data include key sources of income that are missing from the standard Census data. The Census data do not include capital gains income; the CBO data do. In addition, for confidentiality reasons, the Census data exclude earnings above $999,999, so that 80 percent of the earnings of someone making $5 million a year is excluded from the Census data. The CBO data include such income in full. The CBO data consequently are much more accurate than the Census data in measuring the incomes of those at the top of the income scale.
The standard Census data also fail to include income from such sources as food stamps, housing subsidies, and the Earned Income Tax Credit. The CBO data include these forms of income. Finally, the CBO data take federal income and payroll taxes into account and provide information on income after these taxes are subtracted. The standard Census data do not.
As noted, the CBO data cover the period from 1979 to 2000. In this analysis, we focus on data for 1979, 1989, and 2000, with the 1979-to-1989 period referred to as the “1980s” and the 1989-to-2000 period termed the “1990s.” These three end points — 1979, 1989, and 2000 — all represent the peak years of economic recoveries and thus are useful years for comparison purposes. CBO has adjusted all of the dollar figures from different years for inflation and expressed them in 2000 dollars.
In its depiction of income trends, CBO does not compare the same households over time. The households that comprise the bottom fifth of households in 1979 are not all the same as the households that comprise the bottom fifth of households in 2000.
The Dramatic Growth in Incomes at the Top
The CBO data show that between 1979 and 2000, with each step up the income scale, the income gains were larger.
- The average after-tax income of the bottom fifth of households increased by nine percent from 1979 to 2000. Among the next-to-bottom fifth of families after-tax income rose an average of 13 percent.
- Among the middle fifth of the population, average after-tax income increased 15 percent — or about two-thirds of a percentage point a year — from 1979 to 2000, rising from $36,400 to $41,900.
- Among the next-to-the-top fifth of the population, average after-tax income rose 24 percent.
- The gains were largest for the top fifth. Within the top fifth, the gains for the top one percent were extraordinary. The average after-tax income of the top one percent of the population increased a stunning 201 percent over the period.
The average household in the top one percent of the population had $576,000 more in after-tax income in 2000 than its counterpart had in 1979. The average household in the middle of the population was $5,500 better off in 2000 than its 1979 counterpart, while the average household in the bottom fifth of the population was $1,100 better off. Thus, those with the highest incomes were dramatically better off in 2000 than two decades earlier, but low- and middle-income households made only relatively modest gains.
|
Average After-Tax
Income by Income Group |
|||||
|
Income Category |
1979 |
1989 |
2000 |
Percent Change |
Dollar Change |
|
Lowest fifth |
$12,600 |
$12,100 |
$13,700 |
8.7% |
$1,100 |
| Second fifth | 25,600 | 25,100 | 29,000 | 13.3% | 3,400 |
| Middle fifth | 36,400 | 37,500 | 41,900 | 15.1% | 5,500 |
| Fourth fifth | 47,700 | 51,800 | 59,200 | 24.1% | 11,500 |
|
Highest fifth |
84,000 | 108,000 | 141,400 | 68.3% | 57,400 |
| 81st-95th Percentile | 65,300 | 75,800 | 88,700 | 35.9% | 23,400 |
| 96th-99th Percentile | 103,600 | 129,100 | 158,600 | 53.1% | 55,000 |
| Top 1 Percent | 286,300 | 506,500 | 862,700 | 201.3% | 576,400 |
| Overall Average | 40,700 | 46,700 | 57,000 | 40% | 16,300 |
|
Source: CBO (For 81st-95th and 96th-99th percentiles, CBPP calculations from the CBO data.) |
|||||
Income Concentration
|
Shares of National After-Tax Income |
||
|
|
1979 |
2000 |
|
Top 1% |
7.5% |
15.5% |
|
Bottom 40% |
19.1% |
14.6% |
|
Source: CBO |
||
As a result of the widely divergent income gains among different groups, the gaps between households at the top of the income scale and those in the middle were much greater in 2000 than they had been two decades earlier. So were the gaps between those at the top and those at the bottom. After-tax income disparities were larger in 2000 than in any other year in the 1979-2000 period. This can be seen in the CBO data on changes in the proportion of the national income that goes to each income group.
- In 1979, the total after-tax income of the top one percent of the population was less than half the total after-tax income of the bottom 40 percent. In 2000, the after-tax income the top one percent received exceeded the total after-tax income of the bottom 40 percent of the population. (See Table 3.)
-
Correspondingly, the bottom 40 percent of the population received a significantly smaller share of the national income in 2000 than in 1979. In 1979, this group received 19.1 percent of the national income. In 2000, it received 14.6 percent.
-
The 2.8 million people who made up the top one percent of the population received more after-tax income in 2000 than did the 110 million Americans in the bottom 40 percent of the population.
-
The shares of after-tax income going to each of the four bottom fifths of the population declined between 1979 and 2000. By 2000, the share of the national income that each of these groups received was at the lowest level recorded over the 1979-2000 period.
The CBO data go back to 1979. If these data were available for earlier years, they almost certainly would show that disparities in after-tax income were greater in 2000 than in the decades before 1979, as well. Such a conclusion emerges from data included in a National Bureau of Economic Research study on before-tax income trends between 1913 and 1998, which one of the authors of the study extended through 2000.[2]
- These data indicate in 2000, the top one percent of the population received a larger share of the before-tax income in the nation than in any year since 1929.
- Our examination of the data from the CBO and NBER studies suggests that after-tax income also was more concentrated in 2000 than at any point since 1929.
The 1990s versus the 1980s
It is well known that income disparities grew sharply in the 1980s. Some commentators have written or said, however, that income disparities then stabilized in the 1990s rather than continuing to grow. Such statements are based on Census data that appear to show that income disparities have remained relatively constant since 1993.
Those Census data are not especially meaningful, however, because they fail to capture much of the income growth that has occurred at the top of the income spectrum in recent years. As noted earlier, the Census data do not include capital gains income and also omit a significant share of other income that households at the highest income levels receive. In fact, the Census Bureau declines to publish information on the top one percent of households.
The more complete CBO data provide a more accurate picture. These data show that while the pace of the growth in income disparities slowed somewhat in the 1990s, income still continued to rise at a much faster rate for those at the top of the income scale than for other Americans.
- After growing a remarkable 77 percent in the 1980s, after-tax income among the top one percent of households increased an only slightly-less-remarkable 70 percent in the 1990s. (See Table 4.) The percentage increase in after-tax income among the top one percent of the population was six times greater in the 1990s than the percentage increase among the middle fifth of the population.
- The average after-tax income of the top one percent of households increased by a whopping $356,000 in the 1990s, as compared to a $4,400 average gain for the middle fifth of the population and a $1,600 average gain for the bottom fifth.
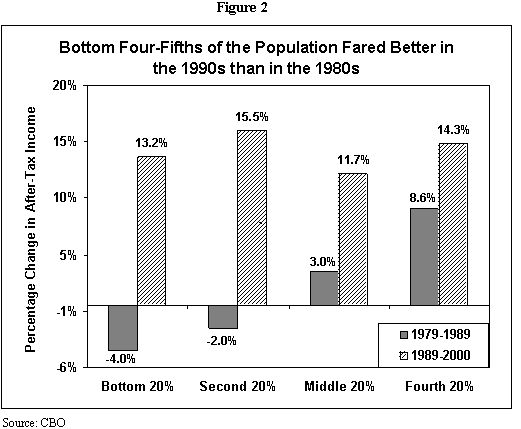
This is not the whole story, however. The bottom four-fifths of the population fared better — and in some cases, much better — in the 1990s than in the 1980s. (See Table 4 and Figure 2.)
- Among the bottom fifth of households, after-tax incomes fell four percent from 1979 to 1989. Their after-tax incomes increased by 13 percent between 1989 and 2000.
- Income gains among the middle fifth of households also were more significant in the 1990s. From 1979 to 1989, the after-tax income of this group rose an average of only three percent. From 1989 to 2000, their after-tax income rose 12 percent.
- Unlike in the 1980s, income gains were fairly even across income groups in the 1990s, except for the larger gains that those in the top five percent secured. Income gains in the 1990s for all income groups, except the top five percent of households, stood at between 12 percent and 17 percent.
| Top 1% | Next 4% | Next 15% | Fourth 20% | Middle 20% | Second 20% | Lowest 20% | |
| 1979 - 1989 | 76.9% | 24.7% | 16.1% | 8.6% | 3.0% | -2.0% | -4.0% |
| 1989 – 2000 | 70.3% | 22.8% | 17.1% | 14.3% | 11.7% | 15.5% | 13.2% |
| Source: CBO. (For “next 4%” and “next 15%,” CBPP calculations from the CBO data.) | |||||||
Federal Tax Trends
The CBO study provides the most comprehensive data available on federal tax burdens from 1979 to 2000. The study includes data on the percentage of income that each income group paid in federal taxes (referred to here as each group’s “federal tax rate”) for the years that the study covers. For the bottom four-fifths of the income spectrum as well as for the top one percent, federal tax rates were lower in 2000 than in 1979. (Tax rates ticked up slightly over this period for those in the top fifth, except those in the top one percent — in other words, for those between the 80th and 99th percentiles.)
- Among the bottom three-fifths of households, federal tax rates — the percentage of income paid in federal taxes — dropped during both the 1980s and the 1990s. The declines were more substantial in the 1990s, reflecting such developments as the expansion in the Earned Income Tax Credit and the establishment of the child tax credit.
- In 2000, the average federal tax rate for the middle fifth of households — at 16.7 percent of income — was lower than in any other year the CBO study covers.
- Among the top one percent of taxpayers, the federal tax rate was much lower in 1989 than in 1979, and then rose part of the way back between 1989 and 2000.[3]
Still, in 2000, the average tax rate for this group was 3.8 percentage points below its 1979 level. This drop in the average tax rate for the top one percent of households between 1979 and 2000 reduced the average tax bill for this high-income group by about $50,000 per household in 2000.[4] The percentage-point decline in the federal tax rate for the top one percent of households exceeded the decline for all other income groups.
To be sure, developments in the private economy have been the principal driving force behind the widening gaps between those at the top of the income scale and everyone else. In the 1980s, however, changes in federal tax policy exacerbated the trend toward widening income disparities, while in the 1990s, changes in federal tax policy moderated this trend. Although federal tax rates declined across the income spectrum in the 1980s, they fell much more sharply for the top one percent of households than for other groups. By contrast, in the 1990s, tax burdens rose among the top one percent of the population while falling for the bottom three fifths of households.
|
Table 5
Source: CBO. (For 81st -95th and 96th-99th percentiles, CBPP calculations from the CBO data.) |
|||||||||||||||||||||||||||||||||||||||||||||||||||||||
The Share of Taxes that High-income Households Pay
The CBO data show that the top one percent of households paid 36.5 percent of all federal income taxes in 2000. Figures such as this one — and the fact that the share of federal taxes paid by the top one percent was at a significantly higher level in 2000 than in earlier years such as 1979 — are often cited as a basis for the large tax cuts for high-income households enacted in 2001 and 2003. Data in the new CBO report help to assess this justification as well.
- The CBO report shows that while the top one percent paid 36.5 percent of federal income taxes in 2000, it paid much smaller shares of certain other taxes; in particular, the top one percent paid only 4.3 percent of payroll taxes. Overall, the CBO data indicate that the top one percent paid 25.6 percent of total federal taxes in 2000.[5] The CBO data also show that the top one percent received 17.8 percent of all pre-tax income in 2000.
- The CBO data thus show that the share of federal taxes that the top one percent paid in 2000, before the recent tax cuts, was larger than this group’s share of the national income, but not dramatically so. That the share of federal taxes which the top one percent paid exceeded its share of the national income reflects the fact that the federal tax system is progressive. It should be noted, however, that the degree to which the federal tax system is progressive is offset somewhat by the regressive nature of state and local taxes. In the vast majority of states, the share of state and local taxes that the top one percent of the population pays is less than its share of income.[6]
- Finally, the CBO data show that although the share of federal taxes that those at the top pay rose from 1979 to 2000, this increase was primarily the result of the increased concentration of income among the very affluent, not of increases in tax rates imposed on high-income households. High-income households received a much larger share of the national income in 2000 than they did two decades ago, and that naturally resulted in their paying a larger percentage of the nation's taxes. As noted above, average tax rates on those at the top of the income scale were lower — not higher — in 2000 than in 1979.
Developments Since 2000
Average compensation of chief executive officers fell substantially in both 2001 and 2002[7] (in part because of a drop in income from stock options), and capital gains income declined sharply in 2001. (Data on capital gains income in 2002 are not yet available.) This suggests there may have been sizable income declines among the top one percent of the population between 2000 and 2002. Other income groups have also experienced reductions in their income with the slowdown in the economy and the rise in unemployment, with these reductions in income resulting in more hardship than the declines at the top. Still, the pronounced decline at the top of the income spectrum is likely to have caused income disparities between the wealthy and the rest of the population to have narrowed somewhat from 2000 to 2002. With the recovery of the stock market, the trend toward especially large income gains at the top may reassert itself this year or next.
In any event, given the exceptional degree to which income became more concentrated at the top of the income scale over the two-decade period through 2000, income is likely to remain quite concentrated by historical standards even with a partial (and probably temporary) reversal of the trend toward widening income gaps in 2001 and 2002. For example, the decline in the average pay of chief executive officers brought their pay back to its 1996 level. This raises the possibility that the share of the pre-tax income in the nation that the top one percent of households received in 2002 similarly slipped back to its 1996 level. If that is the case, then the share of pre-tax income that the top one percent received in 2002 would still be larger than the share in any year from 1938 to 1995, with the possible exception of 1986.[8]
Of further relevance here is data which show that income exclusive of capital gains has become more concentrated at the top in recent years. The updated tables from the NBER study include data on income other than capital gains. These data show that pre-tax, non-capital-gains income was more concentrated among the top one percent of households in 2000 than in any year since 1936. This suggests that despite the decline in the stock market since 2000, incomes remain quite concentrated, measured by historical standards.
Recent Changes in Tax Policy
The primary factors behind the growth in income disparities involve developments in the private economy. Nevertheless, government policies can play a significant role in accelerating or moderating the widening of income gaps. This is a lesson that emerges from the comparison between the 1980s — when tax policies exacerbated the trend toward wider income disparities — and the 1990s, when tax and other policies moderated that trend.
The tax legislation enacted since 2000 is widening income disparities further. The Urban Institute-Brookings Tax Policy Center has examined the combined effects of the tax cut enacted in 2001 and the tax cut enacted this May. Even without considering the effects of the estate tax changes, which are heavily tilted toward high-income households, the Tax Policy Center found that:
-
The income-tax cuts enacted in 2001 and 2003 will increase the after-tax income of households with incomes that exceed $1 million by nearly $113,000 per household in 2003. This represents an average increase in the after-tax income of this group of 5.4 percent. Among the top one percent of households, the average after-tax income gain is $26,300 per household, or 4.6 percent.
-
Among the middle fifth of households, the tax cuts are increasing average after-tax income by $680 this year, or 2.6 percent.
|
Average Increase in After-Tax Income in 2003, from 2001 and 2003 Tax Cuts |
||
|
|
Percent |
Dollars |
|
Millionaires |
5.4% | $112,925 |
|
Top 1% |
4.6% | 26,335 |
|
Middle fifth |
2.6% | 676 |
|
Bottom fifth |
0.2% | 3 |
| Source: The Tax Policy Center of the Urban Institute and Brookings Institution. | ||
The income tax cuts thus are increasing the after-tax incomes of millionaires by twice as large a percentage as they are raising the after-tax incomes of those in the middle of the income scale. They also are raising after-tax income 27 times faster among millionaires than among those in the bottom fifth of the income spectrum. (In dollar terms, of course, the magnitude of the differences is even larger.)
Conclusion
The CBO study, which contains the most comprehensive information now available on recent income trends, demonstrates that disparities in after-tax income grew sharply in both of the last two decades and that in 2000, income gaps appear to have reached their widest level in 70 years. Since 2001, policymakers have enacted legislation that is further widening disparities between the most well-off and other Americans, and doing so at the cost of large increases in budget deficits and the national debt and diminished resources for other national priorities and needs.
Appendices
|
Income Category |
1979 |
1989 |
2000 |
Percent Change 1979-2000 |
Dollar Change 1979-2000 |
||
| Lowest Fifth |
$13,700 |
$13,100 |
$14,600 |
6.6% |
|
$900 |
|
| Second Fifth |
29,800 |
29,100 |
33,300 |
11.7% |
|
3,500 |
|
| Middle Fifth |
44,700 |
45,700 |
50,300 |
12.5% |
|
5,600 |
|
| Fourth Fifth |
60,500 |
65,100 |
74,500 |
23.1% |
|
14,000 |
|
| Highest Fifth |
115,800 |
144,400 |
196,500 |
69.7% |
|
80,700 |
|
|
|
|
|
|
|
|
|
|
| 81st-95th Percent |
85,900 |
98,900 |
117,200 |
36.5% |
|
31,300 |
|
| 96th-99th Percent |
143,300 |
173,100 |
220,200 |
53.6% |
|
76,900 |
|
| Top 1 Percent |
454,200 |
712,100 |
1,290,800 |
184.2% |
|
836,600 |
|
| Source: CBO (for 81st-95th and 96th-99th percentiles, CBPP calculations from the CBO data) | |||||||
|
Shares of After-Tax Income by Income Group |
||||
| Income Category |
1979 |
1989 |
2000 |
Percentage Point Change in Shares 1979-2000 |
| Lowest Fifth |
6.8% |
5.1% |
4.9% |
-1.9 |
| Second Fifth |
12.3% |
10.8% |
9.7% |
-2.6 |
| Middle Fifth |
16.5% |
15.7% |
14.6% |
-1.9 |
| Fourth Fifth |
22.3% |
21.9% |
20.2% |
-2.1 |
| Highest Fifth |
42.4% |
47.6% |
51.3% |
+8.9 |
|
|
|
|
|
|
| 81st-95th Percent |
24.3% |
24.6% |
23.8% |
-0.5 |
| 96th-99th Percent |
10.6% |
11.7% |
12.0% |
+1.4 |
|
Top 1 Percent |
7.5% |
11.3% |
15.5% |
+8.0 |
| Source: CBO (for 81st-95th and 96th-99th percentiles, CBPP calculations from the CBO data) | ||||
Appendix
The Strengths of the CBO Data
CBO draws upon both Census data and IRS data. Each of those data sets is better than the other for certain types of data on certain income groups. CBO has used the strongest elements of each of these data sets to build a data set that is superior to either the Census or IRS data by themselves.
- The CBO data provide information on income and income trends among the top one percent of the population. Census data do not. The Census Bureau has acknowledged that it lacks reliable data on the incomes of those at the top of the income scale, both because its official measure of income does not include income from capital gains and because (for confidentiality reasons) it records only part — rather than all — of the income of individuals at very high income levels. CBO solves this problem by supplementing Census data with data from the Internal Revenue Service's "Statistics of Income" series, which includes actual income information from tax returns, including the tax returns of the top one percent of the population.
- CBO includes detailed information on income levels after taxes are taken into account. The standard Census Bureau data focus on income levels before taxes are subtracted. The CBO data also count as income the payments that low- and moderate-income working families receive from the Earned Income Tax Credit. The standard Census data do not include EITC payments. In short, the CBO measure of after-tax income provides a better measure of the income that households have at their disposal.
- The CBO data include in-kind or non-cash income, such as income from food stamps, housing assistance, and health insurance coverage. The standard income information that the Census Bureau presents does not include in-kind or non-cash benefits. Both the Census Bureau and CBO have been criticized in the past for neglecting in-kind benefits and consequently understating the amount of resources that low-income households have at their disposal. The new CBO study remedies that problem.
Two other, somewhat more technical, differences between the CBO data and Census data should be noted. First, CBO places households into income categories after making an adjustment for the number of people in the household. Take two households with incomes of $20,000. Household A has four people in it; Household B has one person in it. Recognizing that it is harder for four people to live on $20,000 than it is for one person, CBO's method considers the household with one person to be better off, and to have higher adjusted household income, than the household with four people. The Census Bureau makes no adjustments for family size, so that a household of four with an income of $20,000 can be placed in a higher income category than a single-person household with income of $19,500.
Second, CBO places an equal number of people into each income fifth. The Census Bureau places equal numbers of households into each income fifth. Since many low-income households consist of elderly individuals, under the Census approach the bottom fifth of the population contains a smaller number of people than each of the other fifths of the population do. As a result, the Census approach understates the amount of income going to the bottom fifth of the population.
End Notes:
[1] These data are contained in Congressional Budget Office, Effective Federal Tax Rates, 1997-2000, August 2003. Most data cited here come directly from Tables B1-A, B1-B, and B1-C of the CBO report.
[2] Thomas Piketty and Emmanuel Saez, “Income Inequality in the United States, 1913-1998,” National Bureau of Economic Research, Working Paper 8467, September 2001. The tables updating this study through 2000 can be found at Saez’s website, see http://emlab.berkeley.edu/users/saez/.
[3] The rate for these taxpayers rose from 1989 to 1995 before declining through 2000.
[4] This is a simplified calculation that multiplies the differential in the effective tax rate between 1979 and 2000 (3.8 percentage points) times the average pre-tax income of the top one percent in 2000.
[5] The CBO study accounts for about 95 percent of federal revenues. It does not account for estate and gift taxes, customs duties, and some other miscellaneous sources.
[6] The Institute on Taxation & Economic Policy, Who Pays? A Distributional Analysis of the Tax Systems in All 50 States, January 2003.
[7] "Executive Pay: Special Report," Business Week Online, April 21, 2003, available at http://www.businessweek.com/magazine/content/03_16/b3829002.htm. "Executive Pay: Special Report," Business Week Online, April 15, 2002, available at http://www.businessweek.com/magazine/content/02_15/b3778012.htm. "Executive Pay: Special Report," Business Week Online, April 16, 2001, available at http://www.businessweek.com/magazine/content/01_16/b3728013.htm.
[8] The NBER study indicates that the share of pre-tax income received by the top one percent in 1996 was larger than in any year since 1937. The CBO study differs slightly on this point; it indicates that the share of pre-tax income received by the top one percent in 1996 was larger than in any year covered by its study, except for 1986. The data for 1986, however, are distorted by the passage of tax reform legislation that year, which led to a substantial shift of capital gains income into that year to take advantage of the lower capital gains tax rates that the Tax Reform Act eliminated for years after 1986.