
Looking at The
Details of The New Budget Legislation
Social Program Initiatives Decline Over Time While Upper-Income
Tax Cuts Grow
Some accounts of the new budget and tax legislation signed into law August 5 have portrayed the legislation as balancing substantial social program initiatives, such as increased funding for child health insurance, with tax cuts favored by the Congressional majority, such as capital gains and estate tax reductions. Examination of the new legislation, however, shows that its program initiatives — which primarily assist low- and moderate-income children and families, legal immigrants, and elderly people — are modest in size and dissipate over time. By contrast, its tax reductions for high-income individuals swell substantially and grow to large levels over time.
Within a few years, tax cuts targeted primarily on very high-income individuals will far exceed the combined cost of all the program initiatives in the new legislation. For example, by 2007, the estate tax reductions alone — which will benefit the heirs only of the wealthiest two percent of individuals who have died — will cost more than all social program initiatives combined.
In total, funding for
these social program initiatives and restorations
declines from $10.2 billion in fiscal year 1999 to $7.3
billion in fiscal year 2003, a decline of 37 percent,
after adjusting for inflation. The funding level for
these initiatives rises slightly in 2005 and in 2007, due
largely to modest increases in those years in funding for
the child health block grant, following a substantial
reduction in the block grant funding level in 2002. In
2007, the funding level for these social program
initiatives totals $8.6 billion, a 34 percent decline
from the 1999 level, after adjustment for inflation.
Looked at another way, funding for these social program
initiatives declines from $46.7 billion in the first five
years (fiscal years 1998 through 2002) to $39 billion in
the second five years.
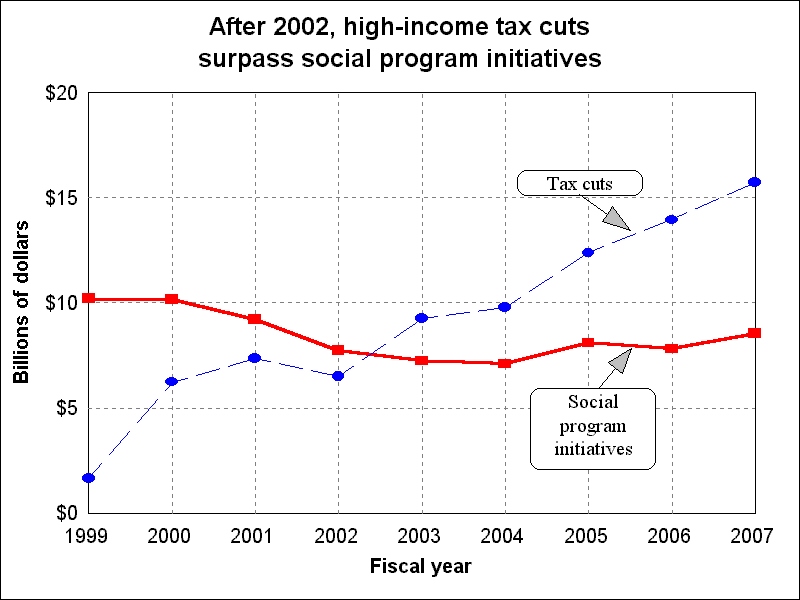
Table 1 |
||||||||||
FY 1998 |
FY 1999 |
FY 2000 |
FY 2001 |
FY 2002 |
FY 2003 |
FY 2007 |
1st 5 years |
2nd 5 years | ||
| (changes in outlays and revenues in billions of dollars) | ||||||||||
| Social Program Initiatives | 9.1 | 10.2 | 10.2 | 9.2 | 7.7 | 7.3 | 8.6 | 46.7 | 39.1 | |
| Reductions in Social Programs that are Entitlements | -7.8 | -19.3 | -34.5 | -26.8 | -48.8 | -48.5 | -68.6 | -137.6 | -318.1 | |
| Reductions in Discretionary Programs | 8.5 | -2.9 | -15.1 | -32.3 | -53.8 | -55.4 | -62.6 | -95.6 | -294.7 | |
| Total Tax Cuts2 | -9.33 | -9.8 | -26.8 | -27.6 | -21.6 | -32.7 | -39.2 | -95.13 | -180.1 | |
| High Income Tax Cuts | 7.33 | -1.7 | -6.2 | -7.3 | -6.5 | -9.3 | -15.7 | -14.43 | -61.1 | |
| High Income Tax Cuts Plus IRAs | 6.83 | -2.6 | -7.1 | -8.8 | -8.5 | -12.5 | -23.4 | -20.23 | -89.8 | |
| Source: Congressional Budget Office and Joint Committee on Taxation tables, as analyzed by the Center
on Budget and Policy Priorities and adjusted to reflect effects of
line-item vetoes. Note: Columns and rows may not add due to rounding. 1 Spending reductions are indicated with a minus sign. Tax cuts also are indicated by a minus sign to indicate a reduction in revenue. 2 "Total tax cuts" refers to total net tax cuts, after the legislation's revenue-raising measures, such as the increases in the airline ticket tax and cigarette tax, are taken into account. 3 Includes 1997 revenue effects. |
||||||||||
While the new law's social program initiatives erode over time, the reductions the legislation makes in those benefit entitlement programs that sustain cuts mount substantially over time. The reductions the legislation makes in discretionary (or non-entitlement) programs also grow sharply in ensuing years.
Tax Benefits and Low- and Moderate-Income Households
The new legislation also includes provisions that cut taxes for many families with children, principally through the child tax credit. The new law extends the child credit to substantially more moderate-income families than the House and Senate tax bills would have done, including many families in the $15,000 to $25,000 range. At the same time, working poor families and some working families just above the poverty line will not benefit. The 31 percent of children with the lowest family incomes will not qualify for the new child credit.
The child credit will erode in value over time because it is not indexed for inflation. The tax benefits this credit provides decline from $21.6 billion in fiscal year 2000 (when the $500-per-child credit level is provided for the first time) to $18.3 billion in 2007, a 31 percent decline after adjusting for inflation.(7) The benefits the child credit provides continue to erode after 2007. The erosion in the value of the child credit contrasts with the large increases over time in the value of the tax cuts focused primarily on high-income households.
A number of moderate-income families and many middle-income families also will benefit from the education tax credits. Because these credits are not refundable, however, poor and near-poor families will derive little or no benefit from them. In addition, many moderate-income families that have one or more children in college and also have one or more children under age 17 will not receive the full benefit of both the child credit and the education tax credits; use of one of these credits can reduce the income tax liability of these families to a very low level or eliminate the tax liability, making the other credit of little or no value to them. (8) (For these and other reasons, critics of these credits have argued that while the credits will ease the burdens of middle-class families with children in college, the credits will not do much to make college more affordable to those who can least afford to attend college and are deterred by the costs. Some critics also forecast that as a result of the education tax credits, college tuition costs will rise and financial aid packages will be reduced, lessening the value of the credits.(9))
The tax bill also includes empowerment zone and "Brownfields" provisions intended to promote economic growth in low-income communities and an increased tax subsidy for employers who have welfare recipients. These provisions are small, and their principal elements expire or phase out after several years. These provisions cost $1.2 billion in the first five years and $400 million in the second five years. In 2007, their cost is $20 million.
In short, the tax cuts that are more broad-based still exclude working poor families, are of only modest value to a significant number of moderate-income families, and (in the case of the child credit) erode over time. The tax provisions targeted at poor communities are small and fade out over time. The tax cuts for those at high-income levels expand substantially over time.
The trends in costs or savings related to the social program initiatives, the tax cuts targeted to high-income individuals, and the program reductions are discussed below in more detail.
Social Program Initiatives
Most of the significant social program initiatives in the legislation either terminate after a few years or decline over time.
Terminations
The legislation provides states with $1.5 billion over five years (through a new block grant) to defray the Medicare Part B premium costs of elderly and disabled individuals with incomes between 120 percent and 135 percent of the poverty line.(10) Those in this income category have incomes between $9,470 and $10,650 a year, measured in 1997 dollars.(11) (Individuals below 120 percent of the poverty line are already eligible to have their Medicare premiums paid through Medicaid.)
The funding to cover the premium costs of these individuals terminates, however, after 2002.(12) Starting in 2003, these individuals will have to bear the full Medicare Part B premium costs, which are increased under the new law. The Congressional Budget Office estimates that the premiums, now $43.80 per month, will rise to $74.20 per month in 2003 and $105.40 a month by 2007. CBO projects the premium will rise 79 percent between 1997 and 2007, after adjustment for inflation. Under prior law, the premium would have risen to $59.70 in 2007. The Administration had proposed to have Medicaid cover the full premium costs of those in this income bracket (as well as of those between 135 percent and 150 percent of the poverty line) on a permanent basis.
| Table 2 Social Program Initiatives in the Legislation |
||||||||||
FY |
FY |
FY |
FY |
FY |
FY |
FY |
1st |
2nd 5 Years | ||
(outlays in billions of dollars) |
||||||||||
Child Health (total) |
4.9 | 4.9 |
4.9 |
5.0 |
4.0 | 4.0 | 6.0 | 23.8 | 24.1 | |
| Block Grant | 4.3 | 4.3 | 4.3 | 4.3 | 3.15 | 3.15 | 5.0 | 20.25 | 19.4 | |
Medicaid and Other Expansions |
0.6 | 0.6 |
0.7 |
0.7 |
0.8 |
0.9 |
1.0 | 3.6 | 4.7 | |
| Other Medicaid Initiatives1 | 0.5 |
0.6 |
0.7 |
0.7 |
0.7 |
0.3 |
0.4 | 3.2 | 1.9 | |
| Immigrants | 2.8 | 2.5 |
2.4 |
1.9 |
1.9 |
1.8 |
1.0 | 11.5 |
7.3 | |
| Welfare-to-Work | 0.4 | 1.1 | 0.8 | 0.4 | 0 |
0 |
0 | 2.7 | 0 | |
| Food Stamps | 0.2 | 0.3 |
0.3 |
0.3 | 0.3 | 0.2 | 0.32 |
1.5 | 1.3 | |
| Medicare Prevention Initiative | 0.3 |
0.8 | 1.0 |
1.0 |
0.9 |
0.9 |
0.9 |
4.0 |
4.5 | |
| Total | 9.1 | 10.2 | 10.2 | 9.2 | 7.7 | 7.3 | 8.6 | 46.7 | 39.0 | |
| Source:
Congressional Budget Office tables Note: Columns and rows may not add due to rounding. 1 Includes $1.5 billion in the first five years to pay Medicare premiums for certain low-income elderly and disabled people. 2 The food stamp level declines from $349 million in 2001 to $269 million in 2007. |
||||||||||
Also temporary in nature is the funding the new law provides in grants to states and cities to place more welfare recipients in jobs. The legislation provides $3 billion in such grants over two years.(13) This funding ends after fiscal year 1999, although states and cities may retain these funds until they are expended, which CBO projects will occur during 2001.
Initiatives That Decline But Do Not Terminate
The funding for the new child health block grant erodes over time. The legislation provides states with $4.3 billion a year in block grant funds in fiscal years 1998 through 2001. Since health care costs will be rising over this period, this frozen funding level may insure fewer children as these years pass. Furthermore, in fiscal year 2002, the funding level for the child health block grant plunges by more than a quarter to $3.15 billion, a level at which it remains through 2004. In fiscal years 2005 and 2006, the funding level climbs back to $4.1 billion, still below the original level. In fiscal year 2007, the funding level is $5 billion, an amount smaller than the original $4.3 billion level when the original level is adjusted for inflation (and significantly below the original funding level if the adjustment made is for projected health care inflation rather than for general inflation).
CBO estimates that the number of previously uninsured children who will be covered under programs funded with child health block grant funds will average 1.7 million a year over the next five years.(14) This is an average number, however; the number of children insured as a result of this initiative may be smaller in the latter part of the 1998-2002 period than in the earlier part. Moreover, the 1.7 million number substantially overstates the average number of children who will be insured as a result of the block grant funds in the second five years, from 2003 through 2007, when block grant funding will generally be at lower levels while health care costs are higher.(15)
Some accounts have described the child health provisions of the new law as the largest expansion of health insurance since the establishment of Medicaid. Although the new expansion is certainly significant, these claims appear to be overstated. The Medicaid expansions of the late 1980s and early 1990s, which are still phasing in, appear to have added more children and pregnant women to Medicaid than the new legislation is projected to cover.(16)
Funding for the new law's immigrant benefit restoration also declines over time. The immigrant provisions primarily protect elderly and disabled immigrants who were present in the country before August 22, 1996, the date the welfare law was signed. Proposals in this year's Administration budget to protect poor legal immigrants who arrive after that date and become disabled after they have been living in the United States were rejected in budget negotiations this spring. In addition, an Administration proposal to extend Medicaid coverage to poor legal immigrant children who enter the country on or after August 22, 1996 was adopted by the Senate but rejected in conference and is not part of the new law. (The conference also rejected a Senate provision to allow states the option of serving poor legal immigrant children who arrive after August 22, 1996 under the new child health block grant.)
Over time, many of the elderly and disabled legal immigrants who were here before August 22, 1996 will die. Some others will become citizens. The CBO estimates show that the benefits restored to legal immigrants as a result of the new law will equal $2.8 billion in fiscal year 1998 but decline to $1.9 billion by fiscal year 2002 and slightly less than $1 billion by fiscal year 2007.
Finally, the funding the new law provides for the creation of work slots for jobless food stamp recipients aged 18 to 50 who are not raising children drops 43 percent in 2002, even without considering the effects of inflation. The legislation provides $131 million a year in new funding for these work slots in fiscal years 1998-2001, but the level falls to $75 million in fiscal year 2002.(17) Under the welfare law, these individuals may receive food stamps for only three months while unemployed in each three-year period unless they are enrolled in a work program. Most states currently do not run such work programs for food stamp recipients. (The new legislation also contains a smaller food stamp provision costing about $100 million a year that gives states the option of granting hardship exemptions from the three-month food stamp time limit to 15 percent of those who would otherwise have their benefits cut off. This provision does not decline over time.)
Tax Cuts
The tax cuts follow a different path, mushrooming over time. The official estimates of the Congressional Joint Committee on Taxation show the tax cuts will lose $95 billion in the first five years and $180 billion in the second five years, for a total revenue loss of $275 billion over the next 10 years. Estimates by the Center on Budget and Policy Priorities indicate the tax cuts will lose approximately $500 billion during their second 10 years.(18)
The sharply escalating cost of the tax cuts is due almost entirely to the rising cost of several tax cut provisions aimed at the affluent. Three major tax cut provisions would direct the lion's share of their benefits to those at very high income levels — the capital gains tax reductions, the estate tax cut, and the reduction in the corporate alternative minimum tax. (CBO data show that the top five percent of the population receives 75 percent of the capital gains income in a given year.(19) The estate tax changes will benefit the heirs of the wealthiest two percent of decedents; all other estates were already exempt from this tax under prior law. CBO analyses also assume that the benefits of corporate tax cuts such as the corporate AMT reduction are distributed among taxpayers in proportion to their ownership of capital; as a result, this tax reduction will principally benefit those with high incomes, among whom ownership of capital is concentrated.) The cost of these three upper-income tax cuts swells from $14.4 billion in the first five years(20) to $61.1 billion in the second five years. These three tax cuts lose only $1.7 billion in fiscal year 1999, but the loss climbs to $6.5 billion by fiscal year 2002 and $15.7 billion in fiscal year 2007, with the costs still rising at that point.
The mounting costs of the tax cuts geared to the affluent become even more striking if the Individual Retirement Account tax cuts in the new legislation also are taken into account. Seventy percent of households could already qualify under prior law for IRA tax deductions. The new IRA tax breaks are geared primarily to those who did not previously qualify — i.e., to the top third of the population. The wealthiest households, however, are not eligible for the new IRA tax breaks, which contain an income limit of $160,000 for married couples.
| Table 3 Selected Tax Cuts in the New Legislation |
||||||||||
| FY 1997-1998 |
FY 1999 |
FY 2000 |
FY 2001 |
FY 2002 |
FY 2003 |
FY 2007 |
1st 5 Years2 | 2nd 5 Years | ||
(revenues in billions of dollars) |
||||||||||
| High Income Tax Reductions | +7.3 |
-1.7 |
-6.2 |
-7.3 |
-6.5 |
-9.3 |
-15.7 |
-14.4 |
-61.1 |
|
|
0.0 |
-0.9 | -1.3 | -1.9 | -2.1 | -2.7 | -8.9 | -6.4 | -28.1 | |
|
-0.3 |
-0.9 | -2.0 | -2.5 | -2.6 | -2.8 | -1.9 | -8.2 | 11.7 | |
|
+7.6 |
+0.2 | -3.0 | -2.9 | -1.8 | -3.7 | -5.0 | +0.1 | -21.3 | |
| Individual Retirement Accounts | -0.5 |
-1.0 | -0.8 | -1.4 | -2.0 | -3.3 | -7.7 | -5.7 | -28.7 |
|
|
-0.4 |
-0.3 | +0.1 | -0.3 | -0.9 | -1.8 | -5.0 | -1.8 | -18.4 | |
|
-0.2 |
-0.6 | -0.9 | -1.1 | -1.1 | -1.4 | -2.7 | -3.9 | -10.3 | |
| High Income Tax Cuts Plus IRA's | +6.8 | -2.6 | -7.1 | -8.8 | -8.5 | -12.5 | -23.4 | -20.2 | -89.8 | |
| Total Tax Cuts1 | -9.2 | -9.8 | -26.8 | -27.6 | -21.6 | -32.7 | -39.2 | -95.1 | -180.1 | |
| Source:
Joint Committee on Taxation tables, July 30, 1997. Note: Columns and rows may not add due to rounding. 1 Reflects the total net revenue loss after the effects of the legislation's revenue-raising measures, such as increases in the airline ticket tax and gasoline tax, are taken into account. 2 Includes 1997 tax effects |
||||||||||
The combined cost of the capital gains, estate, corporate AMT, and IRA tax cuts in the new legislation rises from $2.6 billion in fiscal year 1999 to $23.4 billion in fiscal year 2007. By 2007, these tax cuts cost nearly three times as much as all of the social program initiatives combined. The cost of these tax cuts climbs from $20.2 billion in the first five years to $89.8 billion in the second five years.
Program Reductions and Long-Term Effects
While its social program initiatives dissipate over time and its high-income tax cuts expand sharply, the new legislation also displays one other distinguishing characteristic — the reductions it makes in the programs and parts of the budget it trims become substantially larger as time goes by. As Table 1 illustrates, the reductions in discretionary programs start small and then become substantially deeper. Similarly, Table 4 shows that the savings which the new law's Medicare and Medicaid savings provisions generate grow markedly over time as well.
On the one hand, the new law's inclusion of these steadily enlarging reductions in the health care entitlement programs and discretionary programs means that even with the swelling tax cuts, the legislation does not ultimately cause the deficit to be higher than would otherwise be the case. The legislation does produce long-term deficit reduction, although this deficit reduction is significantly smaller than it would be without the tax cuts.
Table 4 |
|||||||||
1998 |
1999 |
2000 |
2001 |
2002 |
2003 |
2007 |
1st 5 Years |
2nd 5 Years |
|
(outlays in billions of dollars) |
|||||||||
| Medicare title2 | -7.0 | -17.1 | -30.7 | -21.8 | -42.4 | -41.9 | -57.8 | -119.1 | 274.9 |
| Medicaid title3 | -0.4 | -1.4 | -2.7 | -4.0 | -5.2 | -6.0 | -10.1 | -14.0 | -39.9 |
| Veterans title | -0.2 | -0.5 | -0.7 | -0.6 | -0.7 | -0.1 | -0.2 | -2.7 | -0.8 |
| Housing4 | -0.1 | -0.2 | -0.4 | -0.5 | -0.5 | -0.5 | -0.5 | -1.8 | -2.5 |
| Total | -7.8 | -19.3 | -34.5 | -26.8 | -48.8 | -48.5 | -68.6 | -137.6 | -318.1 |
| Source:
Congressional Budget Office tables, July 30, 1997, as analyzed
by the Center on Budget and Policy
Priorities 1 Includes reductions in mandatory spending only; does not include reductions in discretionary programs. 2 Reflects reductions in the Medicare title of legislation; does not include effects of the Medicare expansions in the title, which are reflected in the "Social Program Initiatives" table (Table 2). 3 Reflects reductions in the Medicaid title of legislation; does not include effects of the Medicaid expansions in the title, which are reflected in the "Social Program Initiatives" table (Table 2). 4 Includes only mandatory savings in the housing area; does not include savings that are subject to appropriations action. Most funding for housing programs is discretionary, not mandatory. |
|||||||||
On the other hand, since domestic discretionary programs tend primarily to benefit the middle class and the poor, the combination of steadily increasing discretionary program reductions, modest social program initiatives that erode over time, increased Medicare premiums, and large tax cuts for the affluent that mushroom over time means the new legislation will increase income disparities that already are wider here than in any other western, industrialized nation. (The reductions in Medicare and Medicaid provider payments are not mentioned here because it is difficult to assess the effects of these reductions on households in different income categories.(21))
In this regard, the reductions in discretionary programs, which will climb to $53.8 billion in fiscal year 2002, will likely prove to be of particular significance. Congress will determine each year through the appropriations process which specific discretionary programs to cut to meet the discretionary spending ceilings. Past experience suggests that families at low- and moderate-income levels could be affected significantly by the reductions made in this part of the budget. When discretionary programs were reduced during the 104th Congress, discretionary programs targeted on low- and moderate-income families and individuals bore a disproportionate share of that reduction. Discretionary programs targeted on those with low incomes constituted 21 percent of all funding for non-defense discretionary programs but bore 34 percent of the cuts made in such programs.(22)
Finally, even with the deficit reduction the legislation does achieve, deficits are projected to return and climb to levels dangerous for the economy when the baby boom generation retires. As a result, those elements of the new legislation that reduce taxes or increase expenditures likely will have to be offset eventually by further program cuts or by tax increases. In the years the baby boomers retire, the reduced effects of the social program initiatives in the new legislation will be small, but the revenue losses caused by the tax cuts will be substantial.
End Notes
1. The modest revenue loss figures for the high-income tax cuts in the first few years do not reflect the amount of tax cut benefits that high-income individuals will receive in these years. Due to the reduction in the capital gains tax rate, some investors are expected to sell assets in the next few years that they would have held if the capital gains rate had not been reduced. The increased capital gains taxes paid on these asset sales will increase federal revenue collections, shrinking the overall revenue loss from the high-income tax cut provisions in the first few years that these provisions are in effect. These increased revenues, however, do not constitute tax increases and do not lessen the value of the tax benefits that high-income individuals will receive from these tax provisions. The overall tax benefits that the high-income tax cuts provisions confer in the next few years thus will substantially exceed the revenue loss that results from these provisions in those years.
2. These figures include savings both in Medicare Part A, which is financed through a trust fund funded by payroll tax revenues, and Medicare Part B, which is funded by general revenues and beneficiary premiums. References to extending the solvency of the Medicare trust fund refer to Medicare Part A and not to Part B.
3. These figures reflect the Medicare and Medicaid savings provisions in the legislation exclusive of the effects of the Medicaid and Medicare initiatives in the legislation. In this report, these initiatives are included as part of the legislation's social program expansions. The net savings in the Medicare and Medicaid titles, including the effects of the initiatives, are: for the Medicare title, $115.1 billion over the first five years and $270.4 billion in the second five years; and for the Medicaid title, $10.4 billion in the first five years and $37.4 billion in the second five years.
4. The discretionary spending ceiling was adjusted upward for fiscal year 1998. Much of the increase is expected either to be used for increases for programs that the negotiators established as priorities at the Administration's behest or to be absorbed by the spending effects in FY 1998 of programs funded in FY 1997.
5. The new budget law places annual caps on both appropriations and expenditures for discretionary programs through 2002 (with separate caps on defense and non-defense discretionary programs in 1998 and 1999). The law does not address discretionary spending levels in years after 2002.
6. Stated another way, these discretionary program reductions are the reductions from the discretionary spending levels in CBO's "capped baseline with inflation," which assumes that the capped funding level for discretionary programs that was in statute for FY 1998 would grow with inflation in years after FY 1998.
7. Other reasons that the aggregate amount of benefits the child tax credit provides will decline over time are: 1) the income limits for the credit are not indexed; and 2) a modest, but growing, number of middle-class families will become subject to the individual alternative minimum tax in future years and lose part or all of their child credit as a result.
8. The fiscal year 1998 appropriations bills now moving through Congress include a $300 increase in the maximum Pell Grant for low- and moderate-income students, pursuant to the budget agreement. Whether this increase will endure through the substantial reductions in discretionary programs that Congress must make by fiscal year 2002 to meet the new law's steadily tightening discretionary spending ceilings is unknown.
9. See William G. Gale, Tax Reform is Dead, Long Live Tax Reform, The Brookings Institution, Brookings Policy Brief No. 12, 1997.
10. These funds also are to be used to cover a very small portion of the premiums borne by beneficiaries with incomes between 135 percent and 175 percent of the poverty line. Few beneficiaries in this income range are likely to avail themselves of this benefits, as the burden of applying is not likely to seem worth a benefit of only a few dollars a month.
11. If the number of beneficiaries applying for this premium assistance exceeds the federal funds made available, states are authorized to establish waiting lists.
12. For this funding to be continued after 2002, new legislation would have to be enacted, and the cost of maintaining this premium assistance in years after 2002 would have to be offset dollar for dollar through cuts in other entitlement programs or tax increases.
13. States must provide matching funds to receive these federal grant monies. CBO assumes that not all states will provide the full amount of matching funds and that as a result, only $2.7 billion of the $3 billion will actually be expended.
14. The legislation also includes several modest Medicaid expansions designed to insure more children. CBO estimates these expansions will provide insurance to an average of approximately 400,000 previously uninsured children, bringing the total number of previously uninsured children who receive coverage due the legislation to an average of 2.1 million over the next five years.
15. The legislation contains funding for several small Medicaid expansions that do not decline over time. These include: increased federal matching rates for Alaska and the District of Columbia, increased Medicaid payment limits for the territories, a state option to maintain continuous Medicaid eligibility for children for 12 months, and a state option for presumptive eligibility for low-income children. These provisions, each of which carries an average cost of less than $300 million a year (and in most cases, well under $200 million a year), have a combined cost of $2.4 billion in the first five years and 3.0 billion in the second five years. (These provisions, along with other Medicaid provisions that do terminate or decline, are included in the "Medicaid and Other Expansions" and "Other Medicaid Increases" lines in Table 2.)
16. Data compiled by John Holahan of the Urban Institute show that the number of children enrolled in Medicaid grew by 5.3 million between 1988 and 1993, after adjusting for population growth, while the number of pregnant women enrolled grew 200,000. Furthermore, CBO estimates that the Medicaid expansions for children that were enacted in 1990 and are phasing in through 2002 are still adding an additional 125,000 children a year to Medicaid. By contrast, CBO projects that the number of children who will be added to Medicaid or separate state health insurance programs by the just-enacted legislation will average 3.4 million over the next five years, a number that, for reasons explained above, should decline in the years after that. (The CBO and Urban Institute numbers cited in this footnote include increases in enrollment by children previously insured through other sources.) Although a portion of the 5.3 million increase in Medicaid enrollment between 1988 and 1993 represents caseload growth attributable to other factors, it is quite unlikely that the new expansion will ultimately have a larger coverage effect than the series of Medicaid expansions enacted between 1987 and 1990. (See John Holahan, Expanding Insurance Coverage for Children, The Urban Institute, 1997, Table 3, and Congressional Budget Office, Behind the Numbers, An Explanation of CBO's January 1997 Medicaid Baseline, April 1, 1997, p. 5.)
17. The food stamp line in Table 2 reflects not only the cost of the funding the legislation provides to states for these work slots but also the cost of the additional food stamp benefits that will be paid, since participation in these work slots will enable individuals to receive food stamps for more than three months while unemployed. In addition, the food stamp line in the table reflects the cost of the provision in the new legislation that gives states the option of granting hardship exemptions from the three-month food stamp time limit to 15 percent of those who otherwise would have their benefits cut off.
18. See Iris J. Lav, The Final Tax Bill: Assessing the Long-Term Costs and the Distribution of Tax Benefits, Center on Budget and Policy Priorities, August 1, 1997.
19. Congressional Budget Office, Perspectives on the Ownership of Capital Assets and the Realization of Capital Gains, May 1997.
20. Consistent with the presentation of the Joint Committee on Taxation, all revenue figures for the first five years include the legislation's effects in fiscal year 1997.
21. It remains to be seen to what extent these reductions in payments to medical care providers will result in reduced provider incomes and greater efficiency in the delivery of health care services and to what extent these reductions will lead to declines in the quality of care provided to beneficiaries and/or to cost-shifting to other payers (which, in turn, can result in higher co-payments or lower wages for employees whose employers face higher health insurance premium costs because of cost-shifting). Of particular significance from a low-income standpoint will be the effect of the substantial reductions in Medicaid payments to "Disproportionate Share Hospitals."
22. The reductions in discretionary funding levels referred to here represent the changes between the funding levels appropriated for discretionary programs for fiscal year 1995 before the 104th Congress took office, as adjusted for inflation, and the levels the 104th Congress appropriated for fiscal year 1997. See Robert Greenstein, Richard Kogan and Marion Nichols, Bearing Most of the Burden: How Deficit Reduction During the 104th Congress Concentrated on Programs for the Poor, Center on Budget and Policy Priorities, December 1996.