
July 21, 2003
NEW TREASURY TAX CUT
EXAMPLES MISLEAD MORE THAN THEY INFORM
By
Robert Greenstein
| PDF of this report |
| If you cannot access the files through the links, right-click on the underlined text, click "Save Link As," download to your directory, and open the document in Adobe Acrobat Reader. |
In late June, the Treasury Department provided journalists with material designed to demonstrate that ordinary families will receive large tax cuts under the 2001 and 2003 tax-cut laws and that policymakers who favor repealing the tax cuts “would be raising taxes on millions of hardworking American families.”[1] Press accounts have widely portrayed this Treasury material as showing how the Administration plans to attack those who propose rolling back the tax cuts.
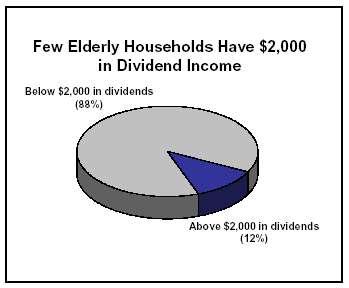
Yet the Treasury material is exceedingly thin. No analysis is provided. The material consists entirely of six examples of households with incomes between $40,000 and $80,000, all of whom are shown as being the recipients of substantial tax cuts. The six examples have been carefully constructed so that all of the households get large tax cuts; the examples are quite unrepresentative of how most households actually will be affected by the 2001 and 2003 tax-cut legislation. For instance, the two elderly households presented in the examples are households with considerably more dividend income than the vast bulk of elderly households actually have.
Most households will, in fact, receive tax cuts
much smaller than the tax reductions shown in the Treasury examples. Some
75 percent of
|
Size of Tax Cut |
Percentage of households in: |
|
|
|
Treasury examples |
All households |
|
No tax cut |
0% |
26% |
|
Under $500 |
0% |
52% |
|
Under $1,433 |
17% |
75% |
|
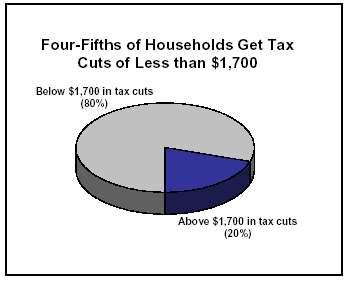
Under $1,700 |
33% |
80% |
Furthermore, the examples appear designed to create the impression that the main thrust of the 2001 and 2003 tax cuts is to help middle-income households, such as those shown in the examples, and thus that any significant rolling back of these tax-cut laws would result in large tax increases on millions of middle-class families. The tax-cut provisions that are responsible for the bulk of the tax cuts pictured in the Treasury examples, however, account for only a little over one-fourth of the cost of the 2001 and 2003 tax cuts when those tax cuts are fully in effect. Tax-cut provisions that are aimed primarily or exclusively at households with incomes higher than those presented in the Treasury examples account for the bulk of the 2001 and 2003 tax reductions.
Some journalists who specialize in tax matters have begun to blow the whistle on the type of misleading information that this Treasury material typifies. Writing in the respected journal Tax Notes, Martin Sullivan has sharply criticized the Treasury material for “what can only be characterized as egregious use of misinformation.” Singling out a part of the Treasury presentation that departs sharply from longstanding Treasury practices for estimating changes in tax burdens — and consequently results in major overstatement of the percentage tax reductions that many families will receive — Sullivan concludes this type of analysis is “embarrassingly poor” and “biased.” He writes that “If this continues, the Treasury’s Office of Tax Policy may have to change its name to the Office of Tax Propaganda.”[2]
Are the Six Examples Typical?
As noted, the Treasury material consists entirely of six examples of tax filing units — or households — with incomes between $40,000 and $80,000.
These examples, however, are far from typical of the tax cuts that households actually will receive.
Two of the Treasury’s six examples involve
elderly households, one of which will receive a tax cut of $2,373 this year,
and the other of which will get $720. Here, as well, the
In short, the Treasury examples do not provide
an accurate portrayal of how most households fare under the tax cuts. The
The Provisions that Benefit These Middle-class Households Account for Only a Minor Share of the 2001 and 2003 Tax Cuts
The Treasury material is likely to be used over the coming year to promote the message that the 2001 and 2003 tax cuts are of great importance to typical middle-class families and that those who propose to alter these tax cuts are proposing hefty tax increases on such families. In this vein, one other statistic bears mentioning. The provisions of the 2001 and 2003 tax cut laws that produce every dollar of the tax reductions reflected in the Treasury examples of non-elderly households — and all but $7 of the tax reductions shown for the two elderly households as well, other than the tax cuts related to the large amounts of dividend income the Treasury assigned to those households — account for only a little over one quarter of the tax cuts in the 2001 and 2003 laws. Specifically, these provisions account for 28 percent of the combined cost of the 2001 and 2003 tax-cut laws when all provisions of those laws are fully in effect.[5] In other words, one could repeal nearly three-fourths of the tax cuts enacted in 2001 and 2003 without having any significant effect on the tax cuts presented in the Treasury examples, except for the dividend-related portion of the tax cuts for the two elderly households.
Misstating the Level of Tax Increases that Would Result from Repealing the Tax Cuts
The Treasury material claims that if the 2001 and 2003 tax cuts were repealed, the six example families all would experience tax increases of at least 36 percent, with one family having its taxes raised 95 percent, another experiencing a 107 percent tax hike, and a third being subject to a stunning 4,296 percent tax increase.
It is this aspect of the Treasury material that Martin Sullivan singles out for sharp criticism. As Sullivan explains, for years, Treasury career analysts produced documents presenting the percentage increase or decrease in total federal taxes that proposals under consideration would generate. The Bush Administration ended this practice. When providing information on the effects of various tax proposals or laws, the Administration presents only the percentage change in income taxes and does not disclose the percentage change in total federal taxes. As Sullivan notes, this shift in presentation results in distortion and can make it appear as though lower- and middle-income families are receiving larger percentage reductions in their taxes than higher income families when the opposite is true. This practice also greatly inflates the percentage tax reduction that the Administration’s tax cuts are said to provide for moderate- and middle-income families, most of which pay more in payroll and other federal taxes than they pay in income taxes.
What particularly outrages Sullivan is the growing Treasury practice of failing even to acknowledge that its figures represent percentage changes only in income taxes and misleadingly presenting the figures as being percentage changes in the taxes that families pay. Sullivan writes that this practice, which appears throughout the Treasury material presenting the six examples, “can only be characterized as egregious use of misinformation.”
For example, the Treasury material contends that a married couple with two children and income of $40,000 “will see their taxes decline in 2003…by $1,933 (from $1,978 to $45, a decline of 98 percent.” The Treasury material states that if the 2001 and 2003 tax cuts are repealed, this couple “will see their taxes increased by $1,933, an increase of 4,296 percent.” In fact, when payroll and excise taxes are taken into account, this couple’s federal taxes will decline by approximately 23 percent, not 98 percent. Moreover, if the 2001 and 2003 tax cuts were repealed in their entirety, the couple’s taxes would rise back up to the prior levels, which would represent an increase of 29 percent, as compared to the 4,296 percent figure featured in the Treasury material.[6]
End Notes:
[1]
“Treasury Release on Effects of Tax Law Repeal,” Tax Notes,
[2]
Martin Sullivan, “Economic Analysis: The Decline and Fall of
Distribution Analysis,” Tax Notes,
[3] The elderly household presented as
receiving $2,000 in dividend income is shown as having a total income of
$40,000.
[4]
Some 26 percent of households will receive no tax cut; 52 percent of
households will receive $500 or less (this includes those who receive no
tax cut). One reason that the Treasury examples provide a skewed
picture is that all of the examples provided of non-elderly households
are examples involving married couples with children.
[5] The tax-cut provisions in question are the increases in the child tax credit, the marriage penalty relief provisions, and the widening of the ten percent tax bracket. None of the other provisions of the 2001 and 2003 tax cuts affect the families in the six Treasury examples, except for a tax reduction of $7 for the elderly couple making $80,000 that results from the reduction of the 28 percent marginal tax rate to 25 percent and the tax reductions for the elderly couples that stem from the change in dividend taxation.
Assuming that the provisions of the 2001 and 2003 tax cuts (except for the Alternative Minimum Tax provision) are extended, the cost of the child tax credit, marriage, and 10 percent bracket provisions constitutes 28 percent of the total cost of the 2001 and 2003 laws when the provisions of those laws are fully in effect. (Note: If the AMT relief contained in the 2001 and 2003 laws, which runs through 2004, is assumed to be extended as well so that the percentage of tax filers subject to the AMT remains at the 2004 level, then the child credit, marriage, and 10 percent bracket provisions account for only 21 percent of the combined cost of the 2001 and 2003 laws when these laws are fully in effect.)
[6] These estimates of the change in the family’s total federal tax burden follow standard economic practice in including the employer and employee shares of the payroll tax. Most economists believe the employer’s share of the payroll tax is passed on to employees in the form of lower wages than the employees otherwise would receive. These estimates also assume that federal excise taxes equal one percent of income for these households, based on data from the Congressional Budget Office. See CBO, “Effective Federal Tax Rates, 1979-1997,” October 2001.