
$300 BILLION DEFICITS, AS FAR
AS THE EYE CAN SEE
by
Richard Kogan
|
“Rarely have the policies underlying the baseline projections been as disconnected from the policy makers’ agendas as they are today.” |
|
— Robert Reischauer[1] |
| PDF of
this report HTM of fact sheet PDF of fact sheet |
| If you cannot access the files through the links, right-click on the underlined text, click "Save Link As," download to your directory, and open the document in Adobe Acrobat Reader. |
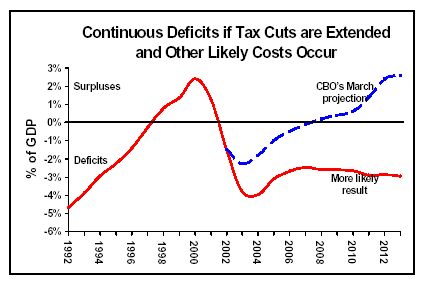
In March of this
year, the Congressional Budget Office projected that large deficits in 2003
and 2004 would be followed by falling deficits thereafter, a budget surplus
within five years, and large and growing surpluses within ten years. Even
accounting for the recently enacted tax cuts and supplemental appropriations
to fund the
- With the enactment of the 2001, 2002, and 2003 tax cuts, the federal tax code is now rife with tax cuts that are scheduled to expire between 2004 and 2010. If Congress makes all these tax cuts permanent — and there will be considerable pressure to do so — projected 10-year deficits will increase by $1.7 trillion. If Congress also amends the Alternative Minimum Tax so that no more than 3 million tax filers are subject to it in any year, the ten-year deficit could increase by another $760 billion.
- Program increases — for the military, for Iraq reconstruction, for a Medicare prescription drug benefit, and possibly for other needs — could swell the deficit by up to an additional $1.9 trillion over the ten-year period.
-
The costs of the items not included in the CBO baseline projection convert projected surpluses to substantial deficits. If all these costs occur, deficits will total $4.1 trillion over the next ten years, will never fall below $325 billion in any year, and will reach $530 billion by 2013.
|
If the tax cuts are extended and other likely costs occur, deficits will total $4.1 trillion over the next ten years, will never fall below $325 billion in any year, and will reach $530 billion by 2013. |
- If, in contrast, the 2001 and 2003 tax cuts had not been enacted, the budget would return to surplus as early as 2007, even with the budget increases enacted since 2001, the additional budget increases (e.g., for defense and prescription drugs) assumed in this analysis, and AMT relief.
- Other analysts have reached similar conclusions about likely deficits if Congress and the Administration continue on what appears their likely path: Peter G. Peterson, Chairman of the Concord Coalition, estimates $4.0 trillion in deficits over the next ten years, for example, and Goldman Sachs projects $4.5 trillion in deficits.
- Our projection of $4.1 trillion in deficits over ten years includes within that figure $2.6 trillion in surpluses in the Social Security trust funds. Outside of Social Security, our figures show that ten-year deficits may total $6.7 trillion.
|
10-yr total |
in 2013 |
|
| CBO March “baseline” projections |
+0.9 |
+0.5 |
| Since March: Iraq war, new tax cuts |
-0.7 |
* |
| Updated projections |
+0.2 |
+0.4 |
| Omitted costs discussed in this analysis: extending tax cuts, funding defense plans, providing Rx drug benefits, etc. |
-4.3 |
-0.9 |
| Resulting deficits |
-4.1 |
-0.5 |
| 2013 deficit as a percent of GDP |
|
3.0% |
|
* less than $50 billion; may not add due to rounding. |
- Higher deficits cause higher debt and thereby increase the level of government interest payments on the debt. In March, CBO estimated that the government would pay $2.1 trillion in interest on debt held by the public over the next ten years. The cost of legislation enacted since March and the additional legislation assumed in this analysis would increase projected 10-year interest payments by $1.0 trillion, to $3.1 trillion. Both debt and interest would be a rising share of GDP. (By contrast, in January 2001, CBO’s projections implied that interest costs would net to approximately zero over the same period as a result of the projected elimination of the debt.)
-
The $530 billion deficit we
project for 2013 would equal 3.0 percent of Gross Domestic Product. Today,
3.0 percent of GDP is almost six times the entire annual budget of the
Department of Education. Stated differently, it is equivalent to $2,300 for
each household in
A deficit of 3.0 percent of GDP at a time when the retirement of the vast bulk of the baby-boom generation is just starting is a prescription for severe fiscal distress in the following decades. When the baby boom generation retires over the course of the next few decades, the costs of Medicare, Medicaid, and Social Security will grow quite substantially as a share of GDP, while the revenues needed to support these programs will not. The best way to prepare for the extra costs of these programs would be to reduce or eliminate the debt during this decade and thereby reduce or eliminate interest costs. Saving for the future — and shrinking the debt constitutes saving for the future — would offset a portion of the inevitable cost increases in Medicare, Medicaid, and Social Security, and thereby partly relieve the pressure to cut these programs, to cut other federal programs, or to raise taxes. Yet debt and interest costs are now on track to rise rather than fall; instead of preparing for the future by putting our finances in order before the baby boomers retire, we are going deeper into debt, and at just the wrong time. It is perhaps for this reason that Goldman Sachs calls the nation’s long-term budget outlook “terrible, far worse than the official projections suggest.”[3]
The CBO Baseline and What It Does Not Include
The most recent CBO baseline projection was issued in March, 2003, and showed deficits through 2006 but surpluses thereafter. Over the ten-year period from 2004 through 2013, CBO’s March baseline projected a net surplus of $890 billion. Unfortunately, this figure of $0.9 trillion in surpluses is both out of date and a poor predictor of likely future budget results.
Since publication of CBO’s March baseline, Congress has enacted a new tax cut officially scored as costing $350 billion through 2013, supplemental appropriations that fund this years’ cost of the Iraq war, and a seven-month extension of the Temporary Emergency Unemployment Compensation program. In addition, CBO has reported that revenues for 2003 are already falling well below expectations and are likely to end up $50 billion to $80 billion below the level CBO projected in March 2003, even before accounting for the new tax cut. Even if one considers all of these costs to be temporary and assumes all of the new tax cuts will end on their artificial “sunset” dates, these costs plus interest on them reduce the projected 2004-2013 surplus from $0.9 trillion to about $0.2 trillion. (See Table 1.)
|
|
10-yr total |
in 2013 |
|
CBO’s projected net surplus, 2004-2013, as of March 2003 |
891 |
459 |
|
less: cost of new tax cut (HR 2) as officially scored. |
-289 |
+2 |
|
less: cost of extended unemployment compensation. |
-4 |
0 |
|
less: cost
of
|
-38 |
0 |
|
less: possible revenue shortfalls in 2004 and 2005. |
-34 |
0 |
|
less: extra interest payments on extra borrowing to finance above items. |
-296 |
-41 |
|
Projected net surplus based on actions to date |
230 |
420 |
| NOTES: Each of the listed items also results in costs in 2003; for example, the tax cut costs $61 billion in 2003, so that its total cost through 2013 is $350 billion. The large amount of 2003 costs explains the large amount of extra interest payments shown above. CBO estimates that 2003 revenues will fall short of expectations by $50 billion to $80 billion in 2003; this analysis conservatively uses the $50 billion figure and also assumes that these revenue shortfalls will only persist in mild form after 2003. The House Budget Committee Democratic staff, in contrast, estimates that the 2003 revenue shortfalls could presage as much as $0.5 trillion in revenue shortfalls over the next decade. | ||
CBO baseline estimates are a projection of future expenditures and revenues that are calculated according to a set of rules that are based on current law and thus assume, among other things, that all tax cuts scheduled to expire will indeed terminate on schedule, even when such tax measures are routinely renewed. These projections are the basic benchmark against which analysts assess the costs of proposed and actual changes in policy. These projections do not necessarily provide a realistic assessment of the future fiscal outlook, however, and are not intended to do so. Because they are based on these rules, the new CBO projections present a far rosier picture of the future than is likely to occur.
The CBO projections are unrealistically rosy for a number of reasons: they omit the cost of extending tax breaks that are scheduled to expire but that Congress always renews, as well as the costs of extending the 2001 and 2003 tax cuts beyond their scheduled expiration dates and providing relief from the mushrooming alternative minimum tax; they understate the costs of appropriated programs, especially for defense, Iraq occupation, and homeland security; they do not include any costs of a Medicare prescription drug benefit; and they do not include the costs of responding to major natural disasters such as hurricanes or floods. Table 2, on the next page, summarizes the omitted costs that are likely, and in some cases virtually certain, to occur over the next decade.
Specifically:
- Routine “Tax Extenders.” CBO’s projection of revenue collections is based on current tax law, regardless of whether provisions of tax law that are scheduled to expire are virtually certain to be renewed. If a tax provision that is scheduled to expire has very strong bipartisan support, has repeatedly been extended in the past, and is virtually certain to be extended again, CBO will nevertheless assume that the provision will expire. CBO data show that the cost of extending expiring tax benefits that have always been routinely renewed is likely to be about $145 billion over the next ten years, not counting interest.
|
|
Total, 2004-2013 |
In 2013 |
||
|
Projected net surplus, CBO March baseline updated (from Table 1) |
|
-230 |
-420 |
|
|
Costs not included in the baseline: |
without interest |
including interest |
including interest |
|
|
|
extend tax cut provisions scheduled to expire in the future |
1,470 |
1,730 |
430 |
|
|
provide relief from the Alternative Minimum Tax |
640 |
760 |
180 |
|
|
fund military and antiterrorism activities consistent with Administration plans |
670 |
810 |
160 |
|
|
fund continued
occupation of
|
0 - 360 |
0 - 470 |
0 - 60 |
|
|
provide Medicare prescription drug benefit |
400 |
490 |
90 |
|
|
budget for the average historical cost of natural disasters |
80 |
100 |
10 |
|
|
assume domestic appropriations will cover a growing population |
190 |
230 |
50 |
|
Total, omitted costs |
3,630 |
4,350 |
950 |
|
|
Resulting deficits assuming additional costs |
|
4,120 |
530 |
|
|
* Note: In the case of a possible occupation of
|
||||
- Extending the 2001 tax cut. CBO’s projections likewise assume that the large 2001 tax cut will expire on schedule in 2010. The President has proposed making that tax cut permanent. According to the Joint Committee on Taxation, doing so would cost an estimated $610 billion over the next ten years, not counting interest, with almost all the 10-year costs occurring in 2011, 2012, and 2013.
- Extending the recent tax cut. The newly enacted tax cut legislation is advertised as costing $350 billion through 2013, but that figure assumes seven of the eight tax-cutting provisions in that legislation will expire in 2004, 2005, or 2008. As explained in other Center analyses, if these expirations are removed from the recent legislation — and the President and Congressional Leadership seem intent on extending most or all of the provisions — the costs of the new tax-cut legislation will grow by $710 billion beyond the official estimate of $350 billion, for a total cost of $1.06 trillion through 2013. (A recent analysis by two Brookings Institution scholars produced a very similar estimate.[5])
Combining the $145 billion in extra costs from the extension of routine expiring tax breaks, the $610 billion in extra costs from the extension after 2010 of the 2001 tax-cut law, and the $710 billion in extra costs from the removal of artificial sunsets from the new tax cut results in a total of almost $1.5 trillion in additional revenue losses. With interest, such extensions would add $1.7 trillion to the 10-year deficit, as shown in Table 2 on the prior page.
-
The Alternative Minimum Tax. In addition, Congress and
the Administration have made clear that their agendas include relief from
the individual Alternative Minimum Tax. Without such relief, the number of
taxpayers subject to the AMT will explode from about 2½ million today to 30
million in 2010 and more than 41 million by 2013 if the 2001 tax cut is
extended past its 2010 expiration date. Virtually all observers consider
AMT relief inevitable. The Administration has said that it plans to address
the AMT issue in 2005. The cost of limiting the AMT so that it affects
about 2 percent of all tax filers in future years (as it will in 2004)
amounts to $640 billion through 2013 not counting interest, according to the
- Defense and the War on Terrorism. The CBO baseline projections assume discretionary (or non-entitlement) programs will grow only by enough to cover inflation. As a result, the baseline projections do not account for the increases in defense funding that are very likely to be proposed and enacted. The Bush budget proposes increases in the defense budget above the CBO baseline. In addition, a recent analysis by the Center for Strategic and Budgetary Assessments concludes that the Bush budget: a) understates the actual costs of the weapons procurement and operations and support plans that the Department of Defense has adopted; b) does not include expected costs for the global war on terrorism; and c) does not include the costs of the war and occupation in Iraq. If the multiyear estimates of the Center for Strategic and Budgetary Assessments for items a) and b) prove correct, expenditures for defense and anti-terrorism efforts will exceed CBO’s baseline by $670 billion through 2013, not counting interest.[6]
-
Occupation of
- Medicare Prescription Drugs. Under the baseline rules, CBO also projects entitlement costs based on current law. Public demand for a prescription drug benefit for the elderly has increased considerably, making the enactment of such a benefit very likely, probably this year. Such a benefit could cost anywhere from $400 billion to $750 billion over the decade, not counting interest, depending on how many of the elderly are covered and how comprehensive the benefit is. The House and Senate have recently approved competing prescription drug plans costing almost $400 billion over ten years, and that figure is used in our analysis, although there is reason to expect benefits and costs to be enlarged in future years.
- Natural Disasters. Because few natural disasters have occurred so far in 2003, there is little funding for disaster relief in the CBO baseline. Yet hurricanes, floods, or earthquakes are likely to occur at some points over the decade. It is inconceivable there will be virtually no such events for the next 10 years, as the baseline implicitly assumes. If history is a guide, disaster relief is likely to cost $80 billion over the period, not counting interest. This figure reflects average annual costs for relief from natural disasters in the past.
- Domestic Appropriations. Finally, as noted, CBO projects that discretionary funding will grow only to cover inflation. In 10 of the last 14 years, funding for domestic appropriations has grown faster than inflation and population growth combined. Although the Administration’s budget and the congressional budget resolution assume that domestic appropriations will grow more slowly than inflation, over a decade the historical funding pattern may reassert itself. Note that the Department of Homeland Security is considered a domestic agency and is widely viewed as being underfunded. If domestic funding simply grows with inflation and the rise in the U.S. population (rather than only with inflation), and thus stays even in real per-capita terms (and shrinks as a share of GDP), expenditures for these programs will be approximately $190 billion higher over ten years than CBO’s baseline currently shows, not counting interest.[8]
|
Other Analyses Produce Similar Results Other analysts also conclude that the CBO baseline should not be used to infer likely future surpluses. Making adjustments similar to those in this analysis, others find deficits of:
|
The list of items not included in the CBO baseline thus is both lengthy and costly. Counting interest, it exceeds $4.3 trillion over the decade (see table 2 on page 5). With the exception of a Medicare prescription drug benefit, the $4.3 trillion in additional costs can be viewed as representing tax and program policies that are in place today but that CBO does not include in its baseline for technical reasons. In the past, when the significance of expirations in the tax code was trivial, the baseline functioned both as a benchmark against which to measure the cost of legislation and as a plausible predictor of future deficits. Now it no longer does the latter. As former CBO Director (and current Urban Institute President) Robert Reischauer remarked, “Rarely have the policies underlying the baseline projections been as disconnected from the policy makers’ agendas as they are today.”
While it is possible that some fraction of the $4.3 trillion in costs in Table 2 might be avoided, it should also be noted that some of these estimates are conservative. For example, if a prescription drug benefit of the type currently under discussion is enacted, the pressure to expand the benefit to cover a higher share of the costs of drugs may become immense. Moreover, the Administration and the Congressional Leadership intend to enact additional tax cuts not reflected in our analysis.
How Much is $530 Billion?
Table 2 shows that if the costs not included in CBO’s baseline are incurred, the budget deficit will reach $530 billion in 2013 alone. Figures of that magnitude are often hard to comprehend; this section attempts to put that figure in context.
To start with, $530 billion in 2013 equals 3.0 percent of GDP in that year. In today’s terms, 3.0 percent of GDP is $324 billion. That amount, $324 billion, equals:
-
about $2,300 for each household in
- a string of $20 bills, laid end to end, stretching around the globe 62 times;
- almost six times the entire annual budget of the Education Department, or the Veterans Department, or the Transportation Department;
- about nine times the annual budget of the Department of Housing and Urban Development;
- approximately 13 times the annual budget of the Department of Homeland Security, more than 14 times the budget of the Department of Justice, some 22 times NASA’s budget, and 41 times the budget of the Environmental Protection Agency; or
- approximately 10,300 years of counting dollars, if you could count $1 each second, 24 hours per day (without pausing to eat or sleep).
Squandering the
To prepare for the imminent retirement of the baby boom generation, the nation should decrease the national debt, not increase it. During the 1990s, debt held by the public fell from 49.5 percent of the Gross Domestic Product in 1993 to 33.1 percent by 2001. This analysis finds that deficits will total $4.1 trillion over the period 2004-2013 if the costs not included in CBO’s projections are incurred; if so, the debt will grow to almost 46 percent of GDP by 2013 and higher levels in years after that.
It is widely understood that when the “age wave” hits — when the baby boom generation starts to retire in 2008 — the costs of Medicare, Medicaid, and Social Security will grow faster than the economy, i.e., faster than the tax base. Over the course of the two subsequent decades, the gap between the cost of these three programs and the revenue needed to support them will widen substantially. To address this funding gap, the nation will have no choice but to raise revenues, reduce the benefits provided by these or other programs, or both. The best way to reduce the magnitude of this impending budget problem is to reduce or eliminate debt during this decade, in advance of the baby boomers retirement. Here is why.
By substantially decreasing debt during this decade, the government would avoid hundreds of billions of dollars per year in interest payments in all future years. Instead of using a few hundred billion per year in revenues to pay interest, those same revenues could be used to cover some of the growing costs of Medicare, Medicaid, and Social Security. Stated differently, budget pressures will grow from 2008 on and will ultimately force large tax increases, major benefit cuts in these programs, deep cuts in other federal programs, or some combination of these approaches. By shrinking the debt during this decade, we would directly cut the cost of one of the largest of the “other” federal programs — interest payments on the debt. These interest savings would reduce the degree to which the nation will in the future need to raise taxes or reduce benefits provided by Medicare, Medicaid, Social Security, or the rest of the government. In short, the best way to protect future generations is to run surpluses, not deficits, in the present, once the economy recovers.[9]
In March of this year, CBO projected that interest payments would fall from 2.1 percent of GDP in 2001 to 1.0 percent by 2013. Under the assumptions of this analysis, however — with tax cuts extended beyond their scheduled expirations dates, defense plans fully funded, a prescription drug benefit enacted, and none of these policies paid for — interest costs would increase by $1 trillion and total $3.1 trillion over the ten-year period (rather than the $2.1 trillion projected by CBO in March). The cost of interest would rise rather than fall, reaching $425 billion — or 2.4 percent of GDP — in 2013 alone.
Conclusion
CBO’s March 2003 assessment of the budget situation looked disturbing in the short run but noticeably better over the coming decade (followed eventually by serious shortfalls in the government’s ability to cover the costs of existing commitments). A more realistic view of the budget suggests that even CBO’s relatively benign March projection is far too optimistic, unless Congress and the Administration reverse course and determine that program increases and new tax cuts (including the extension of existing, officially temporary tax cuts) must be paid for. Acting now to reduce future deficits will make the burden imposed on future generations noticeably smaller than if we wait five, ten, or more years to act.
Appendix: AMT Relief
The recent tax-cut legislation includes a provision to protect taxpayers from the swelling Alternative Minimum Tax, but only through 2004. The Administration had requested AMT relief in its budget, but only through 2005. The New York Times recently quoted Pamela Olson, Assistant Secretary of the Treasury for Tax Policy, as stating that the Administration plans to propose a long-term solution to the AMT, but not until President Bush’s second term. The article reported, “The target date [for a longer-term AMT proposal] is 2005, she said. ‘We are working on it,’ Ms. Olson said.” [10] Although addressing the AMT problem is clearly part of Administration and congressional plans, the costs of doing so beyond 2004 are not reflected in the new tax law.
Source of the AMT Problem
The Alternative Minimum Tax is a parallel tax system originally designed to ensure that tax filers with high incomes could not avoid paying taxes altogether by aggressively using available deductions, exemptions, and tax shelters. Such taxpayers calculate their tax liability according to both the regular income tax and the AMT and pay whichever amount is higher.
Unlike the regular income tax code, however, the key components of the AMT are not indexed for inflation. As a result, as incomes rise over time to reflect the effects of inflation, more taxpayers become subject to the AMT. This problem was exacerbated by the tax cuts enacted in 2001, which reduced tax liabilities under the regular income tax code, particularly for those with high incomes, without making corresponding adjustments in the AMT.
About two and one-half million
taxpayers are currently subject to the AMT. The
High Cost of AMT Relief
|
Revenue-Neutral AMT Relief? The Tax Policy Center has designed an option to provide AMT relief by restructuring the AMT in a cost-neutral manner; this option would free large numbers of middle-class taxpayers from the AMT and offset the cost by making the AMT tougher on high-income taxpayers (especially taxpayers with very high incomes, who currently are generally not affected by the AMT). There is virtually no chance the Administration will propose such a cost-neutral approach, even though the large, growing, and permanent deficits the nation faces suggests that all future tax cuts should be offset. |
Preventing the individual Alternative Minimum
In reality, of course, AMT relief will be continued beyond 2004. The Bush Administration clearly intends to propose that such relief be maintained.[11] The cost of extending AMT relief beyond 2004 thus is essentially an "off-book liability" that must be considered part of the long-term cost of any proposal to make the 2001 tax cut permanent. It is necessary to include the cost of addressing the AMT problem when assessing the long-term cost implications of congressional or Administration tax-cut proposals.
The Urban Institute -
End Note
[1]
Robert D. Reischauer, President of the Urban Institute and former
Director of the Congressional Budget Office, “Framing the Budget Debate
for the Future,” testimony before the Senate Budget Committee,
[2] We do not mean to imply that a typical family will have to pay $2,300 to balance the budget in 2013. The purpose of this figure is to give a sense of the magnitude of 3.0 percent of GDP. In reality, a typical middle-income family may find itself worse off or less badly off than that figure implies, depending on the type of actions the nation takes to deal with these deficits. Policymakers might reduce programs of special benefits to such a family; they might raise taxes in a proportional or regressive manner, reducing the family’s income by $2,300 or more; they might raise taxes in a progressive manner, sparing middle-income families much of the brunt of the pain; or they might fail to deal with the deficit, in which case the cost to middle-income families of the resulting slower long-term economic growth is not clear. The possible range of outcomes is even more extreme, for good or ill, with respect to low-income families.
[3]
Bill Dudley and Ed McKelvey, “Budget Blues: Play It Again, Uncle Sam,”
Goldman Sachs,
[4]
Table 1 treats the
[5]
William G. Gale and Peter R. Orszag, “Sunsets in the Tax Code,” Tax
Notes,
[6]
Steven M. Kosiak, “Cost Growth in Defense Plans, Wars and Occupation of
[7]
Tom Squitieri, “
[8] The Concord Coalition and the Committee on Economic Development state that it is more prudent to assume that domestic appropriations will keep pace with GDP, which would cost more than we assume.
[9] We are not advocating immediate tax increases or program cuts while the economy is functioning well below capacity. However, enactment now of a program of deficit reduction to be effective a year or more from now, when the economy has presumably recovered to a significant degree, seems warranted.
[10]
[11] The new tax-cut law’s temporary AMT relief builds on and expands a similar provision in the 2001 tax-cut package that also provided AMT relief through 2004. The cost of providing permanent AMT relief would have driven the cost of the 2001 tax-cut package well above what the fiscal year 2002 Congressional budget resolution allowed, unless other elements of that package were scaled back. The framers of the 2001 tax cut consequently resorted to the gimmick of letting the AMT relief sunset at the end of 2004, knowing that Congress would have no choice but to extend AMT relief before the provision expired. This scenario occurred again this year, when AMT relief for 2004 was increased but AMT relief after 2004 could not be squeezed into the Senate’s informal $350 billion target for the newly enacted tax cut.
[12]
Leonard Burman, William Gale, Jeffery Rohaly, and Benjamin Harris, “The
Individual AMT: Problems and Potential Solutions,”
[13]
This estimate reflects an AMT option that would hold the share of AMT
filers at approximately 2 percent of all tax filers (the 2004 share),
according to the