
Taxes on Middle-Income Families Are
Declining
by Iris J. Lav
| Click here for the revised version of this report. |
Table of Contents I. Middle-Income Tax Burdens are Declining II. Are Tax Burdens Rising Overall? |
Taxes on middle-income families have fallen over the past few years. The percentage of income that these families pay in taxes is now lower than in most other years of the past two decades.
- Data on federal taxes from the two leading sources of tax information for Congress — the Congressional Budget Office and the Joint Committee on Taxation — indicate that the federal tax bite on the typical family in the middle of the income distribution is less deep than it was four years ago. Middle-income families will typically pay $300 to $400 less in 1999 than they would have paid had tax burdens been at the same level as in 1995. Tax burdens on these families have declined by an amount equal to about one percent of income.
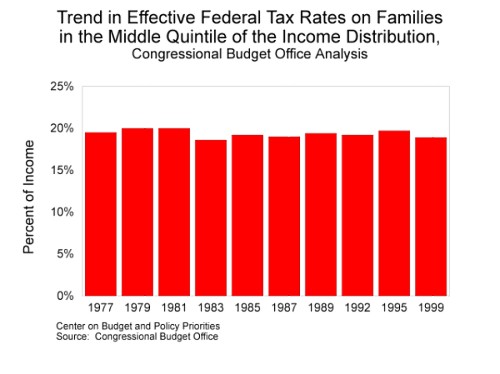
- The CBO data go back to 1977. The federal tax burdens on median-income families are lower in 1999 than in any other year over this period for which data are available, with the exception of 1983.
- If just federal income taxes are examined, Treasury Department data indicate that a median-income family of four with two children will pay a smaller percentage of income in federal individual income taxes than anytime in more than three decades.
| Federal | 1995 | 1999 |
| Congressional Budget Office | 19.7% | 18.9% |
| Joint Committee on Taxation | 17.3% | 16.1% |
| State and Local | ||
| Average Taxes (1995 and 1998) | 10.2% | 10.2% |
| TOTAL | ||
| Using CBO for federal tax | 29.9% | 29.1% |
| Using JCT for federal tax | 27.5% | 26.3% |
| Source: Congressional Budget Office, May 1998; Joint Committee on Taxation, November 14, 1995 and September 15, 1998; U.S. Department of Commerce, Bureau of Economic Analysis, August 1998 and February 1999.1 | ||
- Nor does the inclusion of state and local taxes alter this picture. Data from the Commerce Department show that the overall burden imposed by these taxes have been relatively stable in recent years as well as over the past few decades.
To be sure, the total amount of taxes collected by the federal government, measured as a percentage of the Gross Domestic Product, has risen in recent years. This increase has been driven by increased collections from high-income taxpayers, not by increased taxes on middle-income taxpayers. Both CBO and conservative economist Lawrence Lindsey, among others, have found that the increased collections are due largely to a large jump in capital gains income and to bonuses paid to highly-compensated executives.
Middle-Income Tax Burdens are Declining
Analyses by both the Congressional Budget Office and the Joint Committee on Taxation show the combined federal tax burden of a middle income family has declined.
- A Congressional Budget Office analysis shows that a family in the middle of the income distribution will pay 18.9 percent of its income in federal taxes in 1999. This is down from 19.7 percent of income in 1995. The CBO analysis includes the effect of income taxes, Social Security and other social insurance taxes, excise taxes, and corporate income taxes. (The median-income family in the CBO analysis has income of approximately $39,000 in 1999.)(1)
- In the years since 1977 for which CBO data are available, the federal tax burdens imposed on median-income families were lower only in 1983. (See Chart 1. The CBO data series begins in 1977.)
- According to the Joint Committee on Taxation,
a family with income between $30,000 and $40,000 will pay 16.1 percent of its income in
federal taxes in 1999, while a family with income between $40,000 and $50,000 will pay
17.5 percent of income in taxes. The Joint Committee analysis includes the effect of
income taxes, Social Security and other payroll taxes, and excise taxes, but not corporate
income taxes.
For families in both income categories, federal tax burdens have declined in recent years. The Joint Committee data show that federal taxes on a family with income between $30,000 and $40,000 have declined from 17.3 percent of income in 1995 to 16.1 percent of income in 1999. Federal taxes on a family with income between $40,000 and $50,000 have declined from 19.3 percent of income to 17.5 percent of income over this period.(2) (Changes in the Committee's methodology preclude consideration of a longer historical time period.)
- Middle-income families will pay approximately $300 to $400 less in taxes in 1999 than if they would pay if tax burdens had remained constant between 1995 and 1999. (Using the CBO figures, the 0.8 percentage point drop in taxes from 19.7 percent of income in 1995 to 18.9 percent of income in 1999 multiplied by the $39,000 median income is $312. Using the JCT figures, the 1.2 percentage point drop in taxes from 17.3 percent of income in 1995 to 16.1 percent of income in 1999 multiplied by $35,000, the midpoint of the $30,000 to $30,000 income range, is $420.)
Families pay state and local taxes as well. Unfortunately, there are no data that would allow determination of the level or trend in total state and local taxes borne by middle-income families. But data on total state and local taxes as a percentage of the economy suggest these taxes have been stable in recent years.
- Commerce Department data show that state and local taxes amounted to 10.2 percent of Net National Product in both 1995 and 1998. This Commerce Department measure of state and local taxes has been remarkably stable over time; it was at almost the same level in 1998 and throughout the 1990s as in 1977.(3) This indicates that average state and local tax burdens — as distinguished from the tax burdens of typical middle-income families — have been relatively constant in recent years.
Tax Foundation’s Average Tax Measure is Not the Same as Tax Burden Each April 15, the Tax Foundation issues a report about what it calls "Tax Freedom Day." This year’s report contends Americans will work until May 11 to pay their taxes. In making this claim, the Tax Foundation relies on a measure of average taxes; the Foundation takes what it says is the total amount paid in federal, state, and local taxes and simply divides this amount by its estimate of the total amount of income in the nation. It calls this figure the taxes that Americans pay on average. For a number of reasons, the Tax Foundation calculation is a deeply flawed measure of the percentage of income that most Americans pay in taxes. Moreover, the Tax Foundation’s presentation of these figures invites middle-income taxpayers to believe that they pay considerably more of their income in taxes than the data show to be the case. Average tax figure misleading. The average tax burden is itself a misleading figure. Middle-class families do not pay the average tax burden; they pay less than that. This is a result of the progressive structure of the federal income tax, under which the wealthy pay a substantially higher percentage of income in federal taxes than the middle class or the poor do. While the typical middle-income family is in the 15 percent federal income tax bracket, high-income families are in brackets with marginal rates more than twice that high and pay much higher percentages of income in federal income tax than middle-class families do. The problem of using averages is easily seen. Suppose four families with $25,000 incomes each pay $1,250 in income tax — or five percent of their income — while one wealthy family with $500,000 in income pays $125,000 in income tax, or 25 percent of its income. On average, these five families pay 22 percent of their income in federal income taxes (total tax payments of $130,000 divided by total income of $600,000 equals 22 percent). But the 22 percent figure is misleading if used to portray middle-class tax burdens. The four moderate-income families pay five percent of their income in income tax, not 22 percent. Using averages when talking about tax burdens produces skewed results. It ascribes to middle-class families average amounts of such taxes as the estate tax and the corporate income tax. These taxes, however, are paid solely or primarily by taxpayers at considerably higher income levels than the average middle-class taxpayer. Non-tax items counted. The Tax Foundation counts as taxes items that are not taxes. These include: optional Medicare premiums that older Americans pay if they wish to receive coverage for physician’s services under Medicare; intra-governmental transfers that are solely bookkeeping devices and not taxes; employee and employer contributions to state and local government pension plans, some of which results in the double-counting of taxes; and rental payments that individuals or businesses pay to state or local governments to rent property those governments own. Taxes counted, but taxed income not counted. The Tax Foundation counts capital gains taxes as part of the taxes people pay, but it fails to count as part of people’s income the capital gains income on which these taxes are levied. Counting taxes while failing to count the income on which the taxes are paid makes taxes appear larger as a percentage of income than they actually are. In addition, in a period such as the present when capital gains income and hence taxes on such income are rising rapidly, the Tax Foundation procedure makes even average tax burdens appear to grow faster than they actually are growing. These flaws in measurement of taxes and income have led the Tax Foundation to show that taxes are rising, when data from authoritative sources show tax burdens on typical middle-income families are falling. |
As described below, average federal tax rates have been rising, largely as a result of tax collections attributable to booming stock-market profits. This phenomenon has little effect on middle-income taxpayers because income on these profits is concentrated among people at higher income levels. In addition, the large number of state tax cuts enacted in recent years suggests that state and local taxes on middle-income families may be declining, even though average state and local tax rates are stable. More than three-fifths of the states have enacted significant tax cuts in recent years.
Are Tax Burdens Rising Overall?
Total federal tax collections measured as a percentage of the economy — taxes as a percentage of GDP — have risen in recent years. So have overall average tax burdens as shown in Census data. These increases are due in large part to the extraordinary increase in capital gains income and other income that high-income taxpayers have received over the past few years as the stock market has soared; the increases in capital gains tax collections and taxes on bonuses that highly-compensated executives receive have little effect on the tax burdens of most Americans.
- According to recent tax statistics reported by the Internal Revenue Service, the amount of net capital gains reported on tax returns jumped nearly 23 percent from 1996 to 1997, while wage and salary income rose 6.6 percent. The IRS reports that more than 92 percent of the net capital gains in 1997 were on tax returns of taxpayers with income exceeding $40,000 — that is, taxpayers with income above the median.
- Moreover, most capital gains income is consistently realized by taxpayers with income far above the median; nearly three-quarters of all capital gains are realized by taxpayers with incomes exceeding $100,000, according to a CBO study. One-quarter of all capital gains income is realized by taxpayers with incomes exceeding $1 million.(4)
- Last year, CBO director June O'Neill testified that tax receipts have
risen as a share of the Gross Domestic Product in the last few years "mainly because
realizations of capital gains were unusually high and because a larger share of income was
earned by people at the top of the income ladder, who are taxed at higher rates."(5)
Sounding a similar note in testimony before Congress in January 1999, Lawrence Lindsey, an economist who served in the Reagan and Bush administrations and on the Board of Governors on the Federal Reserve System, said, "A disproportionate share of this extra revenue is coming from upper income taxpayers through higher income tax payments. The likely reason for these payments in the booming stock market. The extra revenue is in part due to higher capital gains realizations due to higher stock prices, but is probably even more dependent upon higher bonuses being paid to upper bracket individuals."(6) Neither of these developments has much or any effect on families in the middle of the income scale.
Moreover, measuring tax burdens as a percentage of GDP can be misleading. Taxes paid on capital gains income are counted as part of total tax collections, but capital gains income is not counted as part of GDP. Thus, when measuring taxes as a percentage of GDP, capital gains taxes are counted but the income on which these taxes are paid is not.
This means that when capital gains income and capital gains tax collections both rise sharply, as has occurred in recent years, tax burdens measured as a percentage of GDP rise more rapidly than tax burdens are actually increasing. With capital gains income now playing a major role in the increase of federal revenues, this distortion has taken on added importance.
Increases in taxes as a percentage of GDP have little bearing on whether taxes on median income families are rising; the recent evidence shows that increases in taxes on high-income taxpayers are pulling up average taxes at the same time that taxes on median-income families are declining. Moreover, measures such as taxes as a percentage of GDP no longer even accurately portray changes in average taxes because of the distortion introduced by failing to count capital gains income. As a result of these two problems, those who cite increases in taxes as a percentage of GDP — or in average tax burdens — as evidence that tax burdens on typical middle-class families are increasing commit a double error. They disseminate misleading information.
Recent Tax Cuts Have Driven Down Tax Burden
The percentage of taxes that typical middle-class families pay in total taxes has been declining in large part because federal income tax burdens on families — and particularly on families with children — are sharply lower than they were 10 or 20 years ago. The new federal $500 per child credit and education credits and deductions have lowered taxes on middle-income families with children.
- A Treasury Department analysis shows that a median-income family of four with two children will pay 7.5 percent of income in federal individual income tax in 1999, a smaller percentage than in any year since 1965.
- In 1999, a median-income family of four will pay 37 percent less in federal income taxes than a similar family would have paid in 1981. The family will pay 20 percent less than it would have in 1989.
But recent tax reductions have not been limited to middle-income families or to families with children. Higher income taxpayers are benefitting from a cut in the maximum tax rate on capital gains income from 28 percent to 20 percent. While capital gains income is soaring, most dollars earned in the stock market are being taxed at lower rates.
A variety of other federal tax reductions enacted in 1997 will show up as lower tax burdens in future years; a number of the provisions in that legislation phase in over a period of years. The Joint Tax Committee projected at the time the legislation was enacted that tax reductions under the Taxpayer Relief Act of 1997 will grow from $9.9 billion in fiscal year 1999 to $35 billion in 2003 and $41.6 billion in 2007.
Substantial reductions in state taxes also have been enacted in recent years. Since 1994, more than three-fifths of the states have enacted significant net tax reductions; one-quarter of the states have enacted net tax increases. Some 28 states, about two-thirds of those with state income taxes, have enacted significant personal income tax cuts in the past five years.
The data in this report show average state and local taxes for 1998. Most of the tax reductions enacted during 1998 state legislative sessions, when 21 states enacted significant reductions in taxes, are not fully reflected in the 1998 data.(7) This suggests average state and local taxes could be lower in 1999 than in 1998. Moreover, 18 states have enacted tax cuts that are phasing in and will take effect in years after 1999, further reducing taxes in future years.
End Notes:
1. The federal taxes that the CBO analysis includes are individual income taxes, employer and employee shares of payroll taxes, excise taxes, and corporate income taxes. Taxes are for families in the middle quintile of the income distribution, with average income of $39,000 in 1999. The federal taxes the JCT analysis includes are individual income taxes (including the outlay portion of the EITC) employer and employee shares of payroll taxes, and excise taxes. Taxes are for families with income between $30,000 and $40,000. State and local taxes are from the National Income and Product Accounts and include personal taxes, corporate profits tax accruals, and indirect business taxes. The rate shown is an average tax rate — taxes as a percent of Net National Product — for the first three quarters of 1998.
CBO defines pre-tax family income as the sum of wages, salaries, self-employment income, rents, taxable and non-taxable interest, dividends, realized capital gains, and all cash transfer payments. Income also includes the employer share of Social Security and federal unemployment insurance payroll taxes, and the corporate income tax. For purposes of placing families into quintiles, CBO adjusts for family size; it divides the income for each family by the poverty threshold for a family of that size. The Joint Committee defines income as adjusted gross income (AGI) plus tax-exempt interest, employer contributions for health plans and life insurance, the employer share of Social Security, worker’s compensation, nontaxable Social Security benefits, the insurance value of Medicare benefits, alternative minimum tax preference items, and excluded income of U.S. citizens living abroad.
2. Distributional Effects of the "Taxpayer Relief Act of 1998" (JCX-63-98), September 15, 1998 and Distributional Effects of the Revenue Reconciliation Provisions of H.R. 2491 As Agreed to by the Conferees (#D-95-79), November 14, 1995.
3. U.S. Department of Commerce, Bureau of Economic Analysis, National Accounts Data, various years.
4. Perspectives on the Ownership of Capital Assets and the Realization of Capital Gains, Congressional Budget Office, May 1997; Auerbach, Burman, and Siegel, Capital Gains Taxation and Tax Avoidance: New Evidence from Panel Data, University of Michigan Business School, Working Paper Series No. 98-13.
5. June E. O'Neill, The Economic and Budget Outlook: Fiscal Years 1999-2008, Testimony before the Senate Budget Committee, January 28, 1998.
6. Lawrence B. Lindsey, Federal Tax Policy, testimony before the Senate Budget Committee, January 20, 1999.
7. National Conference of State Legislatures, State Tax Actions, various years.