
OVERVIEW OF K-12 EDUCATION FINANCE
|
PDF
of the report
Related analyses: |
| If you cannot access the files through the links, right-click on the underlined text, click "Save Link As," download to your directory, and open the document in Adobe Acrobat Reader. |
Public schools in America are operating in an era of enhanced expectations. Schools are being challenged to meet the demands of an economy that is increasingly oriented toward knowledge and information skills. Recent legislative initiatives at both the state and federal level have created new systems of testing and performance standards that will hold schools and teachers accountable for student achievement. Given these ongoing changes, many policymakers have noted the importance of designing financial systems that provide public schools with sufficient resources to meet the demand for better education.
Creating an alignment between funding and accountability can be difficult. The public policy issues surrounding the financing of public K-12 education are famously complicated. While a quality education is universally understood to be an essential component of childhood development and social mobility, the specific policies surrounding the allocation of funds to school districts are often complex and obscure, based on formulas understood by only a small group of experts. Those concerned with improving public services for children can be left with the general sense that something should be done to improve public education, but without the tools to meaningfully engage in the policy debate. This paper provides basic background on how public K-12 education is funded in the United States.
Facts About Money and Public Schools
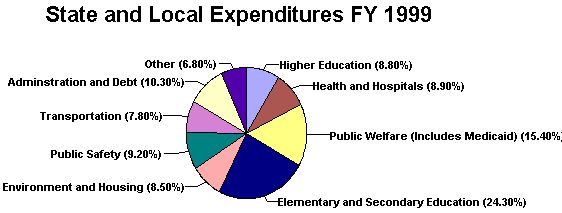
The United States spent approximately $412 billion on public elementary and secondary education during the 2001 — 2002 school year — making it the largest single area of direct public expenditure, exceeding even national defense.(1) These expenditures were for the benefit of 47.4 million public school students (another 5.2 million children attend private school), for an average per-student funding level of $8,685.(2) This amount includes funding from all sources — state, local, and federal — and for all purposes, including instruction, building, administration, and retirement. It varies significantly among the states; per-student funding in the highest-spending state, Connecticut, is over twice that in the lowest-spending state, Utah.
To put elementary and secondary education expenditures in perspective, $412 billion represents just over four percent of the 2001 U.S. gross domestic product.(3) Public elementary and secondary education accounts for approximately 24.3 percent of state and local government expenditures, as seen in the chart above.(4)
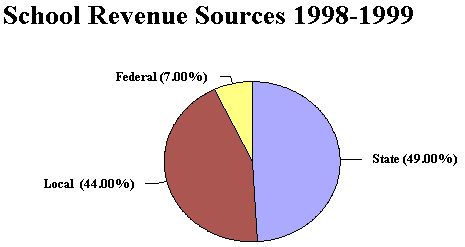
Financing public education is primarily the responsibility of state and local government. In state fiscal year 1999, 49 percent of education funds come from state appropriations, 44 percent from local revenues, and seven percent from the federal government. Local governments raise funds for education primarily through property taxes, while states rely on a variety of taxes including personal and corporate income taxes, and sales and excise taxes. While the federal government's small role in funding public schools has remained relatively constant over time, the share of education financed with state dollars has been increasing and the local share shrinking. The state share of school funding has risen from 30 percent in 1940 to 40 percent in 1970 to 49 percent in 1999.(5)
These percentages are national totals, and individual states vary considerably. Some states rely heavily on state appropriations for funding schools; others require school districts to raise the bulk of funding from local taxes (primarily property taxes). One state — Hawaii — operates public schools under a single school district that is entirely funded from state sources. Among states that use a mix of state and local funds, the smallest percentage of school funding coming from local revenues is found in New Mexico, at 17 percent, while the largest percentage is in New Hampshire, which raises 91 percent locally.
How Is The Money Spent?
There are over 14,000 active school districts in the United States, governing approximately 90,000 individual schools. The districts vary considerably in size, ranging from the New York City public school system, which enrolls over one million students, to more than 1,000 primarily-rural school districts educating less than one hundred students each. Most of the individual schools — 94 percent — offer a comprehensive curriculum to a broad range of students, while the remainder specialize in areas including special education and vocational training.
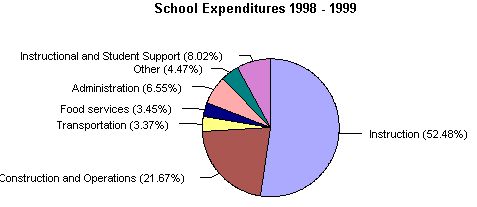
The U.S. Bureau of the Census and Department of Education conduct an annual survey of school district revenues and expenditures. That survey indicates that in the 1998 - 1999 school year, 52.5 percent of all school expenditures was for "instruction," which essentially is the cost of employing teachers. Another 21.7 percent of school expenditures was for the construction and maintenance of school facilities. Expenditures on school buses and transportation comprise 3.4 percent of school costs, and another 3.5 percent is spent on food services. Student support services, including school nurses and guidance counselors, and instructional support services, including school libraries and curriculum development, together make up another 8.0 percent of school spending. Administrative expenditures, for both schools and central district offices, account for 6.6 percent of educational expenditures. These amounts represent expenditures by schools and school districts themselves. States also make additional direct expenditures for education including support for state education offices and providing pensions for retired teachers.
The Structure of Education Funding
States spend hundreds of billions of dollars per year on public education, generally providing funds directly to school districts. To divide funding among school districts, states identify factors that distinguish districts from one another, calculate the impact of those differences on the cost of providing educational services, and distribute funding accordingly. Beyond the obvious difference of size, the most significant factor that distinguishes school districts from one another is school district wealth. Some districts are relatively wealthy, others are not. States have developed a number of basic funding systems that undergird the calculation of school district funding levels and adjust, to varying degrees, for local differences in wealth. While every state system is different, the fundamental structures of state school funding systems have many similarities. State formulas for dividing funding among school districts fall into one of four categories:(7)
Flat Grant: Under this simple approach, every district gets an identical "flat" grant for each student enrolled, regardless of local circumstances. This funding scheme reflects a belief that the state should ensure a minimum funding level for all students and then give local districts autonomy to raise funding beyond that point as they see fit. Once common among the states, this approach has largely been abandoned for the more sophisticated formulas described below. Vestiges of the flat grant approach continue to be used on a partial basis in some states.
Power Equalization: This approach grew out of the work of education reformers in the 1960s and 1970s who observed that large differences among districts in the ability to raise local funds resulted in school funding disparities. A certain standard increment of property taxation - a "mill," for example, which represents one hundredth of one percent of the value of property - raised far more money per student in wealthy districts than in poor districts. Districts adopting identical property tax rates received very different amounts of revenue.
The solution was to guarantee every district a standard amount of money per student for each unit of taxation. For example, the state might decide that every school district should be able to raise $100 per student, per mill of property tax rate. If a school district's tax base was such that one mill only raised $40 per student, the state would provide a grant equal to difference between $100 and $40, or $60 per student, per mill. A wealthier district whose tax base raises $70 per student, per mill, would only receive $30 per student, per mill, from the state. In this way, the state "levels the playing field" for school districts in terms of the ability to raise revenue, ensuring that funding disparities are a result of differences in taxpayer preferences, not taxpayer wealth. The power equalization approach reflects the idea that states have a responsibility to ensure that school districts have equality of opportunity in school funding, but not equality of outcome.
Foundation Plans: The Foundation Plan approach is currently used in various forms by 40 states. It incorporates elements of the previous two approaches. Foundation plans establish a both a specified (foundation) per-student funding amount and a specified local tax rate that each school district must levy. The state provides the difference between the amount of revenues raised from the local tax rate and the foundation funding level.
For example, a state might establish a foundation funding level of $6,000 per student. For a district with 1,000 students, this would produce a total funding amount of $6 million. If the state-determined minimum local tax rate of 200 mills raised $2 million in local property taxes, the state would provide a grant equal to the difference between $2 million and $6 million, or $4 million. If applying the 200 mill minimum tax rate in a wealthier district with the same number of students raised $5 million, the state would provide only $1 million in state funds. Both districts end up with the same local tax rate and the same combined state and local funding level per student, although the relative weight of those two sources is significantly different. Some states give school districts the discretion to raise their local tax rates above the minimum level, but with no further matching funds from the state. Other states cap local property tax rates at the minimum level, in the interests of limiting local property tax burdens and ensuring relative equality in education funding levels.
The foundation grant incorporates the aspects of power equalization schemes designed to mitigate disparities in local wealth, but takes the idea of equality a step further — both opportunity and outcome are now determined, to varying degrees, by the state. Foundation plans are based on the idea that local school districts should not enjoy unlimited discretion in setting funding levels that are unacceptably different from statewide norms — either in being too low, or — in some cases — in being too high.
Full State Funding: The simplest and rarest approach to paying for public education is where the state pays for everything. Hawaii combines full state funding with a single, unified school district, effectively eliminating any distinctions between "state" and "local" governance in determining education funding policy. Localities have not control over funding levels.
The four categories described above represent only the basic structures of state education funding plans. Most states employ schemes that combine elements of some or all of these funding plans. For example, a state might distribute some money through a flat grant, and the remainder through a foundation plan. Alternatively, a state could give districts the discretion to raise tax rates and funding up to a point above the minimum levels established under a foundation plan, but use a power equalization formula to ensure that districts with different levels of local property wealth have the same capacity to raise additional funding.
The focus of many education finance reformers in considering different funding structures is often on the effect of those policies on producing equity among students in levels of funding. Other policymakers view education finance reform as a way to provide equity among taxpayers in levels of property tax burden. The challenge of balancing fairness for students and fairness for taxpayers is often a significant contributor to the complexity of education funding schemes.
The basic education funding structures discussed above revolve around inter-district differences in local wealth and tax capacity. Those policies have the largest impact on the total funding amounts received by school districts. There are, however, many other factors that distinguish school districts from one another and have an impact on the cost of providing education. States have adopted policies designed to accommodate those differences by adjusting funding levels beyond the basic allocations accordingly. Those policies include the following:
Size and Student Dispersion: Some states have large areas of widely dispersed, rural populations. School districts in these areas often have higher transportation costs than compact, highly populated districts. In addition, rural school districts may operate a number of small, individual school buildings that cost more to operate and maintain on a per-student basis. Some states adjust funding levels for these districts based on the idea that the districts have certain unavoidable increased costs due to diseconomies of scale.
Cost of Living: The price of purchasing goods and services is not uniform among school districts across the nation or within a state. Some districts located in urban areas, for example, may face higher labor costs driven by the price of housing, transportation, food, etc. Some states adjust funding levels accordingly, providing additional funding to high-cost districts. The U.S. Department of Education has developed estimates of differences in cost for every school district in the nation.(8)
Changing Enrollment: All school funding formulas are based, to varying degrees, on the number of students enrolled in each district. This is fundamentally logical and would at first glance appear to be the basis for a fairly straightforward funding mechanism: (per-student grant) times (number of students) equals (grant). It is complicated, however, by the fact that school district enrollment levels change from year to year. Changes in enrollment don't necessarily produce appreciable marginal cost changes to the school district equal. A gain or loss of one student, for example, is unlikely to noticeably affect school costs. Under the standard formula shown above, however, it would results in an increase or a decrease in school funding.
School districts with growing enrollment support the simple "per-student grant times number of students" formula because it benefits them financially. School districts with declining enrollment object, because it hurts them financially. Many states have responded by adopting policies that treat negative and positive enrollment changes differently. Shrinking districts are sometimes "held harmless" from the fiscal impact of enrollment losses, while growing districts receive full funding or some amount close to it for each new student they enroll. Such policies, which effectively provide funding twice for students who move between districts, once for the district that lost enrollment and once for the district that gained, are ultimately least beneficial for school districts whose enrollment is relatively stable. In the end those districts receive a smaller portion of what is presumably a finite pool of education funding.
Aside from the issues described above that affect per-pupil costs in a school district, costs that are similar for each student include administrative expenses, building operation and maintenance, teacher salaries for providing the standard curricula, etc. For this reason, basic education funding structures are often based on some form of uniform per-student grant, recognizing that small differences in student costs will naturally even out among large groups of students.
Some differences, however, are so significant that states have chosen to adopt specific funding policies that reflect them. To the extent that a school district has a disproportionate number of children identified as needing additional resources, these policies often result in additional state funding. States generally attempt to calculate the increased cost to schools of educating students with certain characteristics and provide additional funding accordingly. Many states use a "weighting" system, in which each student begins the formula process with a basic value of "one." If the student has a certain characteristic, its value is increased by some incremental amount, so it is worth more than one for funding purposes. For example, if a student is limited-English proficient and requires some supplemental instruction, he or she might generate a supplemental student weight of 0.2, to be added to the base amount of 1.0. If a student has a severe disability that requires specialized facilities and instruction, a higher additional weight like 2.5 might be added to the student count. After all adjustments are made, the individual student values are summed and the result is multiplied by a uniform per-student grant. Student characteristics that states use to generate additional education funding include the following:
Students With Disabilities: The most prominent and expensive funding programs based on specific student needs are special education programs designed to serve children with disabilities. Under the federal Individuals with Disabilities Education Act, schools are required to work in consultation with parents and students to develop an individual education plan for every student identified with a disability, and to provide the services outlined in the plan. Students with disabilities occupy have a special status in this respect, since similar federal mandates to provide educational services do not exist for other types of students.
States have responded to the cost of educating children with disabilities by developing supplemental funding mechanisms that distinguish between different kinds of disabilities and provide funding accordingly. These programs provide significant levels of funding; a recent study put the average cost of educating disabled students at 90 percent greater than the cost of educating students without disabilities.(9)
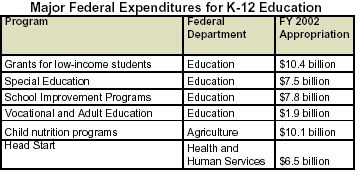
Special education costs are significant and growing. The percent of all students identified as disabled increased from 11.2 percent in 1988 to 13.0 percent in 1999. Much of the increase has been among students identified with learning disabilities, which may reflect changes and improvements in processes of identification and diagnosis. Expenditures for special education services nationwide are estimated to be approximately $50 billion per year.(10) The passage of the IDEA in 1975 was accompanied by a commitment from the federal government to provide funding equal to 40 percent of the mandated costs. The federal government distributed $6.4 billion to the states for special education costs in 2001, less than 13 percent of estimated costs.
Low-Income Students: Students living in low-income households consistently fall behind their peers in academic achievement, graduation rates, college enrollment, and other indicators of educational success. Recognizing the additional resources necessary to overcome the barriers to achievement associated with poverty, thirty-eight states currently provide some level of additional funding on the basis of school district poverty levels. These distributions are sometimes referred to as "compensatory education" programs.
States face a number of issues in providing poverty-based education funding. The first is determining the magnitude of the supplement needed. The most commonly-used amount is an additional student weight of 0.25, although this amount can be as low as .05 and as high as .60 for higher-poverty school districts. A significant body of research has emerged over the last 10 years to suggest that the actual amount needed is significantly higher than is currently being provided. The newer research supports student weights in the range of 1.0 to 1.5, implying that the cost of educating a poor child is more than twice the cost of educating non-poor students.(11)
Some states use a standard weight for all low-income students. Others vary the weight depending on the overall level of student poverty within each district, with high-poverty districts receiving more funding per low-income student than low-poverty districts. This approach reflects the idea that districts with high poverty levels face challenges beyond those experienced by districts in which low-income children are a minority. In other words, it costs more to educate a poor child in a district with a concentration of poor children than it does to educate a poor child living in a low-poverty district, largely because of peer effects and the multiple problems associated with concentrated poverty.(12)
States also use different means of defining poverty. Most use the number of students enrolled in the federal free and reduced-price lunch program as a proxy for local poverty levels. This approach is convenient but makes the distributions vulnerable to inaccuracies in the free-lunch data. Other states use Census data, which is more consistent than free lunch information but less timely, TANF enrollment, food stamp enrollment, or some combination of information.
Eighteen percent of students enrolled in public school currently live below the poverty line. The federal government provides school districts with additional funding to help low-income students through two main programs — the free and reduced-price lunch program, and Title 1 of the Elementary and Secondary Education Act, which provides supplemental grants based on poverty levels. Title 1 funds are provided to supplement (not replace) state efforts to serve low-income children, and most states use them to augment existing programs including those that provide additional instruction in reading and mathematics, after-school programs, and summer school programs. Significant increases in funding for the Title 1 program were a component of the recently enacted federal "No Child Left Behind" Act, which also mandates increased testing and accountability.
Gifted & Talented Students: Many states provide additional funding to provide supplemental educational services to particularly gifted students. Such programs are generally not large in comparison to other programs that serve specific students populations. The definition of "gifted" is far more subjective and non-standardized than, for example, the definition of "disabled" or "poor." Some states use a weighting system to fund gifted and talented education (the weight in Georgia for the 1998-99 school year was 0.6453) while others reimburse school districts for some or all of the costs of operating programs that fit certain operational criteria.
Limited-English Proficient Students: The number of students for whom English is not the primary language has been growing in many states. In response, states have made adjustments to funding formulas to account for the increased costs of serving such children. The funding weights utilized are generally fairly modest. While no comprehensive 50-state survey of LEP students exists, states reporting such information for the 1999-2000 school year include California, with 1.4 million students; Texas, with 555,000 students; and Florida, with 167,000 students.
Students At Different Grade Levels: Some states have adopted funding policies that attempt to recognize costs differences among students at different grade levels. For example, high school students may require additional teachers with more specialized training and more expensive facilities than middle-school students. States attempting to devise funding policies that are sensitive to such cost differences assign an additional funding weight to students in the upper grades. States that offer pre-kindergarten or kindergarten instruction on a partial-day basis often count students enrolled in those grades as a "partial" student for funding purposes.
School funding systems that identify specific student characteristics and provide funding accordingly have the advantage of increasing the accuracy of funding policies, but the disadvantage of increasing their complexity and administrative cost. The "categorical" programs created by these funding systems also tend to increase state control over education, since the use of the categorical funds is generally limited to state-specified programs and expenses. Categorical programs other than those described above include funding for vocational education, class-size reduction, and school technology. Some student-specific programs are incorporated into basic funding formulas that mingle state and local funds, while others exist as separate budget line items that are funded entirely from state resources.
Other State Funding Mechanisms
While the large majority of school funds are distributed using some form of a formula based on a per-student grant times number of eligible students equation, other funding mechanisms are also employed, including the following:
Cost Reimbursement: Some specialized programs are funded on a cost-reimbursement basis, where the state defines eligible programs and eligible costs. Participation in such programs can lead to some financial uncertainty for school districts, since limited state funding can lead to pro-rata reductions in state support if total expenses exceed available appropriations.
Competitive Grants: State may distribute limited funds via a competitive application process, particularly when starting pilot programs meant to be implemented in a limited number of school districts.
Performance-Based Grants: Some states have experimented with performance-based education funding, reasoning that financial incentives for educational achievement will spur schools to improvement. For example, Pennsylvania awarded an extra $20 million to selected schools in 2001 based on the percentage improvement of reading and math scores among students in grades five, eight, and 11. No states have chosen to tie a large portion of funding to performance measures, reflecting the difficulties of accurately quantifying educational outcomes and of understanding the complex relationship between outcomes, funding levels, student characteristics, and school performance.
How Are Building and Capital Expenses Funded?
Many states draw a distinction between education funding for operating expenses and education funding for capital expenses, providing state support and equalization for the former, but not the latter. States may be reluctant to participate in the cost of building projects when the schedule, design, scope, and financing of those projects are locally controlled. While most states provide some level of support for school infrastructure, twelve states provide no state capital funding at all.(13) As a result, many school districts whose operating budgets have benefitted from school finance reforms continue to struggle to maintain adequate facilities. Low-wealth school districts have difficulty obtaining voter approval to borrow money to improve facilities because the additional tax rate necessary to finance improvements is higher than it would be in a district with greater property wealth.
Some recent changes have been made in this respect. In a series of decisions between 1994 and 1998, the Arizona Supreme Court ruled that wealth-based local differences in the ability to raise funds for schools facilities violated the state constitution. As a result, the Arizona legislature adopted reforms that shifted much of the cost of school construction to the state. Courts are increasingly ruling that facilities are an essential component of the basic educational needs that states are obligated to provide. This is an issue of significant interest, because there is a large backlog of needed school construction and renovation. One recent study estimated the cost of modernizing the nation's public education infrastructure at $268 billion.(14)
While state education finance policies differ substantially, all of the policies and formulas discussed above have the common characteristic of operating within a similar overall framework of public education — local schools that are open to everyone, free of charge, and equally subject to the various regulations and guidelines created by the state. There are, however, some alternative models of educational organization, regulation, and funding. The two most prominent models are "charter schools" and "school vouchers."
Both models are generally designed to be cost-neutral to the state education system as a whole, because they involving taking the existing funding provided to public schools on behalf of participating students and redirecting it elsewhere. If a student moves from a regular public school to one of the states's charter schools, which are often organized around specific educational ideas and are not subject to many of the regulations normally set by states regarding curricula and employment, then the funding associated with that student moves to the charter school as well. Similarly, school vouchers allow parents and students to use the public education funding normally provided to schools on their behalf to pay for private school tuition. While these models are theoretically cost-neutral, in practice they can raise difficult education finance issues. Shifting enrollment and funding from regular public schools to charter schools or vouchers can create funding inequities and raise questions about the adequacy of the resources dedicated to the students who remain enrolled in traditional public schools.
The federal government's role in funding education has been and continues to be modest. States have relative freedom to establish and fund local school districts as they see fit. To the extent that the federal government has chosen to be involved in education finance, it has done so through a series of policies aimed at achieving targeted outcomes with limited means. Identifying specific student populations with specific needs, federal appropriations have aimed to supplement school district funding levels while maintaining the basic assumption that the primary responsibility for funding education remains at the state and local level.
 Recent federal actions indicate a renewed interest in strengthening the federal
role in public education. The "No Child Left Behind Act" enacted in January 2002
increased both the federal role in the implementation of public education, by mandating
increased testing of students in grades 3 - 8, and the federal role in funding education,
by providing new funding for the federal Title 1 program that is designed to serve low-income students.
Recent federal actions indicate a renewed interest in strengthening the federal
role in public education. The "No Child Left Behind Act" enacted in January 2002
increased both the federal role in the implementation of public education, by mandating
increased testing of students in grades 3 - 8, and the federal role in funding education,
by providing new funding for the federal Title 1 program that is designed to serve low-income students.
The Role of the Courts in Education Funding
A crucial component of the development of education finance policy over the last 35 years has been the role of the courts. Lawsuits have been filed in both federal and state courts, asserting that the distribution of public resources among school districts produced by education funding schemes are inequitable, inadequate, illegal, and unconstitutional. Litigants in these cases have had substantial success, resulting in court-mandated education funding reforms that have significantly altered both the amount of money spent on public education and the manner in which that money is distributed among school districts.
The role of the courts in education finance can be traced back to the landmark 1954 case of Brown v. The Board of Education, where the U.S. Supreme Court ruled that racially segregated schools ran afoul of the 14th Amendment's guarantee of equal protection under the law. School finance reformers sought to extend this argument to the issue of education funding, arguing that equal protection meant equal distribution of resources on a per-student basis. This fundamental concept — that each student should receive the same amount of resources — is commonly referred to as an argument for education funding equity. Plaintiffs argued that school funding systems that were highly dependant on local revenues resulted in inequitable disparities in funding levels between high-wealth and low-wealth school districts.
The U.S. Supreme Court addressed education funding and equity in the 1973 case of Rodriguez v. San Antonio Independent School District. The court rejected the plaintiff's arguments on a 5-4 vote, noting that while the school funding schemes of Texas and most other states "can fairly be described as chaotic and unjust," such unfairness nonetheless failed to violate the Constitution. One reason for this finding was the lack of any mention of education in the Constitution itself.
The Rodriguez case effectively put an end to federal challenges to education funding systems, but it did not preclude reformers from seeking relief in state courts. In the 1971 California case of Serrano v. Priest, the court ruled that the state's funding system violated the equal protection clause of the state constitution, holding that the system "invidiously discriminated against the poor because it made the quality of a child's education a function of the wealth of his parents and neighbors." In response, the state adopted a form of the "power equalization" formula discussed previously, to give school districts equal opportunity to raise funds, regardless of local variations in wealth.
Similar lawsuits were filed in a number of other states during the 1970s. The results were mixed — about half the courts followed the reasoning outlined in Serrano and struck down existing funding schemes, while others deferred to the principle of local control over education and the prerogative of state legislatures to determine the amount and distribution of school funding. The momentum of equity-based court challenges began to slow in the 1980s — between 1980 and 1988, eight states ruled against reformers, while only two ruled in favor.(15) At the same time, another line of attack emerged, based not on equal protection clauses but on "education clauses" of state constitutions. Unlike the U.S. Constitution, all state constitutions explicitly require the provision of free public education for all children. These clauses vary in wording. Most include adjectives describing the quality of the education that is to be provided, including "efficient," "uniform," "high quality," "thorough," "basic," and "suitable," often in combination. Fifteen states have education clauses without qualifier, simply mandating the existence of a system of free public schools.
The court challenges based on education clauses assert that those clauses compel state legislatures to provide all schools with sufficient funding to provide an education meeting certain basic standards of quality. As some challenges based on equal protection clauses faltered, more litigants turned to education clauses, with significant success. One the most significant victories occurred in the 1989 Kentucky case of Rose v. Council For Better Education. In that case, the court struck down the entire state system of education funding, finding that funding levels were inadequate to satisfy the constitutional mandate for an "efficient" system of public schools. The court went so far as to explicitly describe the characteristics of such a system, saying that it would develop the capacities of students in seven areas, including communication skills, economic and political knowledge, mental and physical wellness, knowledge of the arts, and academic and vocational training sufficient to compete with peers in surrounding states.
This and other similar cases marked the ascendancy of "adequacy" as the predominant criteria for evaluating education funding systems. The earlier concept of "equity" was focused on ensuring that students — particularly students living in poor school districts — received the same amount of money as other students within the state. The "adequacy" idea is more focused on ensuring that students receive enough money to achieve basic educational goals — goals like those defined by the court in the Rose case. Significantly, that amount of money can differ depending on the individual needs of each student. The 1990s saw continued development of adequacy-based education funding challenges in state courts, often with success. Significant cases that are currently being considered include DeRolph v. State in Ohio, and Campaign For Fiscal Equity v. State of New York. Since 1970, there have been court challenges to education funding systems in 44 states.
Court decisions have affected both the amount of money dedicated to public education and the manner in which that money is distributed among local school districts. This influence extends beyond the individual states in which decisions have been rendered, as policymakers in other states have reacted to the resulting changes by voluntarily adopting similar reforms. A number of studies suggest that court-mandated education reforms tend to increase overall education funding levels.(16) This trend is not universal; some researchers have concluded that the Serrano case may have contributed to a decline in education funding in California relative to other states.
Nevertheless, the solutions to equalization problems often require additional funding. Policymakers charged with implementing equity-based reforms to reduce inter-district funding disparities are unlikely to reduce funding for high-revenue districts; they are far more likely to use additional funding to give more money to low-revenue districts. Adequacy-based reforms require additional funding by definition, since they are based on a perceived difference between legally mandated funding levels and actual funding levels. Recent estimates cited in the press and by policymakers of the incremental cost of providing adequate funding include $1.7 billion in Alabama, up to $1 billion in Arkansas, $3 billion in New York, and $1.2 billion in Ohio.
Providing additional state or local funding on such a scale can be difficult. In addition, a situation that involves the judicial branch of state government ordering the legislative branch to make significant changes to the core legislative functions of taxation and appropriation of public funds can raise thorny separation-of-powers issues. As a result, the resolution of school finance litigation has extended for years or even decades in some states.
INFORMATION RESOURCES
There is a wealth of information available regarding education and education funding. Some of the most useful sources include the following:
The U.S. Department of Education National Center for Education Statistics (www.nces.ed.gov) maintains a comprehensive collection of information about all facets of public education. Publications of particular interest include:
The Digest of Education Statistics. A comprehensive one-volume collection of statistics for both K-12 and higher education. Updated yearly. (www.nces.ed.gov/pubs2002/2002130.pdf)
Public-School Programs of the United States and Canada: 1998-1999. Available only on-line or via CD-ROM, this is the most comprehensive and detailed survey of state education funding formulas and policies. (www.nces.ed.gov/edfin/state_finance/StateFinancing.asp)
The National Assessment of Educational Progress. One of the only nationwide tests that allow for comparisons of state test scores both to other time periods and to other states. (www.nces.ed.gov/nationsreportcard)
The National Education Association, the nation's largest teacher's union, publishes an annual report titled Rankings of the States and Estimates of School Statistics. This report generally provides the most recent nationwide and state-to-state estimates of funding levels, enrollment, teacher salaries, and other education information. (www.nea.org/publiced/edstats/rankings/02rankings.pdf)
The Education Commission of the States sponsors research and provides links to various publications on a range of education issues. (www.ecs.org)
The Finance Project publishes articles on a range of topics related to the financing of educational and other public services benefitting children. (www.financeproject.org/school.html)
End Notes:
1. Rankings of the States 2001 and Estimates of School Statistics 2002, National Education Association.
2. Ibid.
3. U.S. Department of Commerce, Bureau of Economic Analysis, March 28, 2002.
4. Government Finances 1998-99, U.S. Department of Census.
5. Digest of Education Statistics 2001, Table 157, U.S. Department of Education.
6. Ranking of the States 2001.
7. These categories are widely used in education finance studies. A useful summary of their characteristics can be found in Financing the New Adequacy: Towards New Models of State Education Finance Systems That Support Standards-Based Reform, Deborah Verstegen, Journal of Education Finance, Winter 2002.
8. Jay Chambers, Geographic Variations in Public Schools' Costs, Nation Center for Education Statistics, February 1998.
9. Jay Chambers, Tom Parrish, Jennifer Harr, What Are We Spending on Special Education Services in the United States, 1999-2000?, Advance Report #1, Special Education Expenditure Project, American Institutes for Research, March 2002.
10. Ibid.
11. Maryland Commission on Education Finance, Equity, and Excellence, Final Report, 2002; Andrew Reschovsky and Jennifer Imazeki, "The Development of School Finance Formulas to Guarantee the Provision of Adequate Education to Low-Income Students," Developments in School Finance 1997, National Center for Education Statistics, 1997; William Duncombe, Estimating the Cost of an Adequate Education In New York, Center For Policy Research Working Paper, Syracuse University, 2002.
12. Andrew Reschovsky and Jennifer Imazeki, "The Development of School Finance Formulas to Guarantee the Provision of Adequate Education to Low-Income Students," Developments in School Finance 1997, National Center for Education Statistics, 1997; Hanushek, Kain, Markman, Rivkin, Does Peer Ability Affect Student Achievement?, National Bureau of Economic Research, October 2001.
13. Catherine C. Sielke, Funding School Infrastructure Needs Across the State, Journal of Education Finance, Fall 2001.
14. Modernizing Our Schools: What Will It Cost?, National Education Association, 2000.
15. William N. Evans, Sheila E. Murray, Robert M. Schwab, "The Impact of Court-Mandated School Finance Reform," Equity and Adequacy in Education Finance, National Academy Press, 1999.
16. Ibid.