
PRESIDENT PORTRAYS SOCIAL
SECURITY SHORTFALL AS ENORMOUS,
BUT HIS TAX CUTS AND DRUG
BENEFIT WILL COST
AT LEAST FIVE TIMES AS MUCH
by Richard Kogan and Robert Greenstein
|
PDF of analysis
Related
Report: |
|
| If you cannot access the files through the links, right-click on the underlined text, click "Save Link As," download to your directory, and open the document in Adobe Acrobat Reader. |
In a statement at his press conference December 20, President Bush said his Administration had already begun tackling the long-term budgetary costs of Medicare, with the enactment of the Medicare prescription drug bill. The drug bill, the President implied, would ultimately reduce Medicare costs. (See box for the President’s statement.)
The President’s comments were made in response to a question as to why he was taking on Social Security now and not Medicare, when the budgetary pressures from Medicare will be far greater than those from Social Security. The President’s dismissive comments about Medicare’s financing gap were in tune with the broader White House campaign to focus on the Social Security shortfall and to portray it as so massive that it threatens to destroy Social Security and to engulf the budget.
Basic budgetary realities, however, are not consistent with the picture that the President and the Administration are painting.
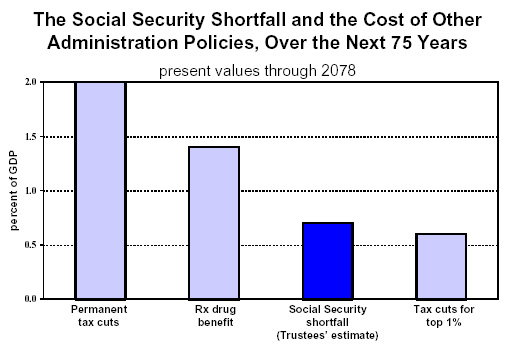
- The Social Security and Medicare Trustees, a majority of whom are members of the President’s cabinet, project that the Social Security shortfall will amount to 0.65 percent of the Gross Domestic Product (the basic measure of the size of the U.S. economy) over the next 75 years. In dollar terms, the Trustees project the shortfall over the 75 year period at $3.7 trillion.[1]
- The Trustees also project the cost of the Medicare drug benefit at 1.4 percent of GDP — or $8.1 trillion — over the same period. This is at least double the size of the Social Security shortfall.
|
The Shortfall in the Social Security Trust Fund Compared with the Cost of the Medicare Prescription Drug Benefit and the Cost of the Bush Tax Cuts if Made Permanent
a. Measured in present value. |
||||||||||||||||||||||||||||||||
- Furthermore, the cost of the 2001 and 2003 tax cuts, if made permanent, is 1.95 percent of GDP — or $11.1 trillion — over the same period, or triple the size of the Social Security shortfall. (This projection of 1.95 percent of GDP is based on cost estimates by the Congressional Budget Office and the congressional Joint Committee on Taxation. It is similar to, but slightly smaller than, the projections of the long-term cost of the tax cuts made by economists Alan Auerbach, William Gale, and Peter Orszag. [2])
- At his December 20 press conference, the President suggested the prescription drug bill would reduce Medicare expenditures for hospitalizations, but the Medicare trustees disagree. In their 2004 report, the trustees specifically stated that enactment of the drug bill had enlarged the long-term shortfall in the Medicare Hospital Insurance program.[3] The drug bill included provisions increasing payments to various health care providers.
The tax cuts and the prescription drug bill were the President’s two principal domestic priorities during his first term. Together, these policies will cost at least five times as much over the next 75 years as the Social Security shortfall (if the tax cuts are made permanent). In other words, the President’s domestic policy initiatives will have resulted in fiscal problems much larger than the problem that he now says he wants to address. (This conclusion also holds true if costs are measured into eternity; see the box below.)
We should note that this comparison uses the Social Security projections of the Social Security Trustees. CBO, in contrast, projects that the Social Security shortfall will be only a little over half as large as the Trustees do; CBO places the shortfall at 0.35 percent of GDP over the 75-year period. If one uses the CBO projection of the Social Security shortfall rather than the Trustee’s projection, the cost of the tax cuts themselves is six times the size of the Social Security shortfall and the combined cost of the tax cuts and drug benefit is about ten times the size of the Social Security shortfall (see Table 1).
|
What President Bush Said About Medicare at His Press Conference Q: Why did you choose to take on Social Security and not Medicare, which some people believe is a worse problem? A: Well, I appreciate that, Ed, but we
did take on Medicare. And it was the Medicare Reform Bill that really
began to change Medicare as we knew it. In other words, it introduced
market forces for the first time; it provided a prescription drug
coverage for our seniors, which I believe will be cost effective. I
recognize some of the actuaries haven't come to that conclusion yet.
But the logic is irrefutable. It seems like to me, that if the
government is willing to pay $100,000 for heart surgery, but not a dime
for the prescription drug that would prevent the heart surgery from
happening in the first place, aren't we saving money when we provide the
money necessary to prevent the surgery from being needed in the first
place. I think we are. That's one of the differences of opinion that I
had with the actuaries.a |
Indeed, if the tax cuts are made permanent, the cost of the tax cuts just for the most affluent one percent of Americans will be about the same size as the entire Social Security shortfall. Based on analysis by the Urban Institute-Brookings Tax Policy Center, the cost of the tax cuts for the top one percent of households will equal 0.5 percent of GDP — or $2.9 trillion — over the next 75 years. This is 46 percent larger than CBO’s estimate of the size of the Social Security shortfall (which, as noted, is 0.35 percent of GDP) and more than three-quarters the size of the shortfall that the Trustees project.
Conclusion
The President has suggested or implied that Social Security presents a greater budgetary problem than Medicare or his tax cuts, and that the Medicare prescription drug bill will help to reduce the overall cost of Medicare by averting unnecessary hospitalizations. Analysis conducted by the Social Security and Medicare Trustees and actuaries, the Congressional Budget Office, and the Government Accountability Office, among others, show that such views are mistaken.
The reality is that the Social Security shortfall, while sizeable, is not gargantuan, and it is not necessary to alter Social Security’s basic structure to close the shortfall. Both rising health care costs, which drive much of the projected growth in Medicare costs, and the long-term cost of the President’s tax cuts pose much larger budgetary problems.
|
When Measured Beyond
75 Years, Tax Cuts and Drug Benefits The White House has sought to portray Social Security’s long-term shortfall as massive, declaring that the shortfall equals $10 trillion or $11 trillion. In statements citing this figure by White House Press Secretary Scott McClellan and the President, no indication has been given of the time period the $10 trillion or $11 trillion estimate is supposed to cover. Social Security’s shortfall is traditionally measured over 75 years, and a number of media outlets — including several of the nation’s most prestigious newspapers — reported the shortfall at $10 trillion or $11 trillion over 75 years. Claims that the Social Security Shortfall Equals $10 Trillion In fact, the $10 trillion to $11 trillion figure (the published figure is $10.4 trillion) represents the Trustees’ projection of the Social Security shortfall not over 75 years, or even 750 years, but into eternity. In making this projection, the Trustees assumed that the size of the economy over this period (i.e., into eternity) will total nearly one quadrillion dollars. The Trustees projected that the gargantuan-sounding $10.4 trillion figure actually would represent only 1.2 percent of the economy over this time period, a fact that the President and White House officials have not mentioned. How large is 1.2 percent of GDP? In the past three years, in response to Administration requests, funding for defense, homeland security, and international affairs has increased by 1.2 percent of GDP. It also should be noted that the $10 trillion or $11 trillion figure is one that the American Academy of Actuaries — the nation’s leading professional society of actuaries and a thoroughly non-political organization — denounced a year ago as so misleading that it should neither be used in policy debates nor printed in the Social Security Trustees’ annual report.a The Academy warned against use of this figure both because of the high degree of uncertainty that surrounds projections made into eternity and because this gargantuan-sounding figure is likely to mislead the public into thinking that the Social Security program “is in far worse shape than is actually indicated.” (Note: In other contexts, White House officials and various Congressional leaders have argued that budget forecasts and projections of tax cut costs are too uncertain to make for more than five years.) The White House has ignored the Academy of Actuaries’ counsel. Instead, the White House has used the $10 trillion to $11 trillion number in a manner that may be even more misleading than the Academy contemplated, since the White House has generally failed to note either that the number reflects the shortfall measured into eternity or that it equals 1.2 percent of GDP. Comparing Costs into Eternity If, despite the problems with measuring costs into eternity, one compares the size of the Social Security shortfall into eternity to the cost of the tax cuts and the drug benefit over the same time horizon, the costs of the tax cuts and the drug benefit remain much larger.
___________ |
End Notes:
[1] This figure, like all dollar figures cited here, is in “present value,” the standard way of presenting budget projections for periods extending far into the future. The present value of the Social Security shortfall over the next 75 years is the amount today that, with interest, would cover the shortfall over the 75-year period. This $3.7 trillion “present value” shortfall in Social Security can be compared with the present value of GDP over the same period, which the Social Security Trustees project will be $567 trillion, or more than one-half of a quadrillion dollars. That is why the Trustees show that the $3.7 trillion shortfall is less than one percent of GDP – about 0.7 percent.
[2] The figures cited here for the long-term cost of the tax cuts represent their cost (in present value) through 2078 if the 2001 and 2003 tax cuts are made permanent in the way that the Administration has proposed. Our estimate of the cost of the tax cuts — 1.95 percent of GDP — is taken directly from the estimates of the costs of the tax cuts enacted to date by the Joint Committee on Taxation, and from the estimates of the cost of extending those tax cuts through 2014 as shown in Table 1-3 of CBO’s Budget and Economic Outlook: 2006 to 2015, January 2005. (Our estimate assumes that the Alternative Minimum Tax is indexed for inflation, using CBO cost estimates from Table 1-3 of its January 2005 report. Any long-term estimate of the cost of the tax cuts must be premised on the assumption that AMT relief is continued; if not, almost all taxpayers would eventually be paying taxes under the AMT rather than the regular income tax, and the 2001-2003 tax cuts would be almost fully “taken back” by the AMT. That this is not the intention of Congress or the Administration is evident from the fact that AMT relief has been enacted for each year through 2005 and the Administration has stated its intention to propose permanent AMT relief. While we have of necessity assumed that the AMT is indexed for inflation, we have only attributed to the 2001/2003 tax cuts a portion of the total cost of indexing the AMT. Specifically, we exclude the portion of the cost of AMT indexation that would have been incurred if that indexation had taken place in the absence of the 2001/2003 tax cuts).
It should be noted that the cost of the tax cuts is already averaging 1.9 percent of GDP in 2003-2005. According to JCT and CBO estimates, the cost of the tax cuts will reach a somewhat higher level of GDP when various income tax cuts that were enacted in 2001, but are not in effect, are implemented and estate tax repeal takes effect.
We assume that after 2015, the cost of the tax cuts will remain constant as a share of GDP; this is a standard assumption used by CBO and GAO in making long-term budget projections. In this case, use of such an assumption is conservative and almost certainly results in some understatement of the tax cuts’ long-term cost. Joint Tax Committee documents show that the cost of estate tax repeal grows faster than GDP over time. Finally, as noted in the text, the estimate used here that the long-term cost of the tax cuts will equal 1.95 percent of GDP is slightly smaller than the estimate of 2.2 percent of GDP from Alan J. Auerbach, William G. Gale, and Peter R. Orszag, “Sources of the Long-Term Fiscal Gap,” Tax Notes, May 24, 2004
[3] The Trustees reported that “The 2003 Medicare modernization act [the prescription drug bill] is estimated to worsen the HI actuarial balance … primarily as a result of increased payments to rural health providers and to private managed care plans.” 2004 Annual Report of the Boards of Trustees of the Federal Hospital Insurance And Federal Supplementary Medical Insurance Trust Funds, pages 63, 64.