
FOOD STAMP CASELOADS ARE RISING
by
Joseph Llobrera
|
PDF of full report |
| If you cannot access the files through the links, right-click on the underlined text, click "Save Link As," download to your directory, and open the document in Adobe Acrobat Reader |
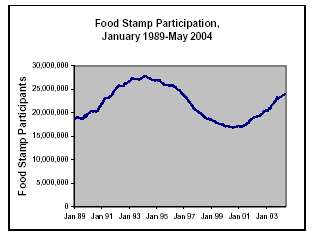
Following years of decline, food stamp participation has been on the rise for nearly four years. In May 2004, the last month for which data are available, 23.9 million people participated in the Food Stamp Program.[1] The number of food stamp participants has exceeded 23 million since December 2003. Prior to this, March 1997 was the last time in which the number of food stamp participants exceeded this level. Since its recent low point in July 2000, participation has increased by 7.1 million people, or 42 percent.
While it is not possible to determine what caused the increase in participation from the data available, it is likely that the majority of the increase can be attributed to the enduring severity of “long-term” joblessness.[2] Labor market indicators suggest that it is extremely hard for people who have lost jobs to find a new one. Although the labor market has been generating significant numbers of new jobs in recent months, it takes more than a few months of significant job growth to substantially reduce the problems of the long-term unemployed. The Temporary Extended Unemployment Compensation program was set up in March 2002 to provide additional weeks of federally funded unemployment benefits to jobless workers who have run out of regular, state-funded unemployment benefits but have not found a job. In May 2004, more than 293,000 individuals exhausted their regular state unemployment benefits and did not qualify for additional federal unemployment aid. The number of “exhaustees” in May was higher than any other May on record, even though about 208,000 jobs were created in that month. Similarly, about 350,000 jobs were created in both March and April yet in both months the number of exhaustees set records for such months. This pattern is predicted to continue until October, even if job growth continues over the next several months. Due to loss of employment and income, more families probably became eligible for the Food Stamp Program. In addition, some of the increase in participation is attributable to a greater share of already eligible families participating in the program. This effect, however, is most likely smaller than the impact of the economy. As noted above, while it is not possible to explain with certainty all aspects of the caseload growth, there are several observations worth noting.
- Many states have had large increases in participation. Seasonal patterns can mask trends in food stamp participation since caseloads tend to rise in the winter months and fall in the summer. Participation has increased in 11 of the last 12 months, instead of declining during the summer months as would have been consistent with historical trends. The rise in food stamp caseloads in recent months may indicate a long-term upward trend in food stamp participation. Participation in May 2004 was at its highest level since November 1996. Between May 2003 and May 2004, food stamp participation increased in 48 states and the District of Columbia. In two states, food stamp participation increased by more than 20 percent. In 19 additional states, participation increased by more than 10 percent.
- This upward trend follows a long period of caseload decline. Between the peak in March 1994 and the low point in July 2000, food stamp participation fell by 11 million people, a 40 percent decline. In 62 of the 76 months between March 1994 and July 2000, participation declined. In contrast, participation has increased in 38 of the 46 months since July 2000.
- Most states have had caseload increases since the beginning of the recession. According to the National Bureau of Economic Research, the recession that began in March 2001 ended in November 2001. Despite the modest economic recovery and recent job growth, long-term unemployment levels remain high. Between March 2001 and May 2004, food stamp participation increased by 6.7 million people, or 39 percent, nationally. Participation increased between March 2001 and May 2004 in 49 states and the District of Columbia.
- Rising participation rates may explain some of the increase. Between September 1999 and September 2001, the participation rate among individuals eligible for the food stamp program rose three points, from 59 percent to 62 percent. This two-year increase follows five consecutive years of declining participation rates.[3] States have recently begun to adopt new options in the Food Stamp Program which should make it easier for eligible families, especially working families, to obtain and retain food stamps. Many of these options became available as a result of the 2002 Farm Bill. These efforts have likely continued the trend toward increased participation among eligible families.
- Recent changes to food stamp eligibility do not explain the long-term upward trend. The 2002 Farm Bill also included some modest expansions in eligibility. In particular, the Farm Bill restored eligibility to some legal immigrants. The benefit restoration to legal immigrants did not take effect until April 1, 2003 and cannot explain increases in the program prior to that date. Moreover, states report anecdotally that immigrants have been slow to return to the Food Stamp Program. While the immigrant restoration may explain some of the increase in food stamp participation in recent months, it is not the underlying cause of the long-term upward trend in participation.
| Participants, May 2002 | Participants, May 2003 | Participants, May 2004 | Change, | Change, | |
| State | May 02-May 04 | May 03-May 04 | |||
| Alabama | 444,588 | 471,574 | 494,003 | 11.1% | 4.8% |
| Alaska | 49,901 | 53,966 | 56,251 | 12.7% | 4.2% |
| Arizona | 386,302 | 481,281 | 520,157 | 34.7% | 8.1% |
| Arkansas | 284,925 | 313,490 | 352,767 | 23.8% | 12.5% |
| California | 1,790,429 | 1,745,626 | 1,895,604 | 5.9% | 8.6% |
| Colorado | 181,253 | 213,633 | 246,409 | 35.9% | 15.3% |
| Connecticut | 171,290 | 182,523 | 198,059 | 15.6% | 8.5% |
| Delaware | 40,465 | 47,091 | 57,244 | 41.5% | 21.6% |
| District of Columbia | 74,186 | 83,333 | 87,602 | 18.1% | 5.1% |
| Florida | 987,236 | 1,012,016 | 1,184,419 | 20.0% | 17.0% |
| Georgia | 645,588 | 781,340 | 865,200 | 34.0% | 10.7% |
| Hawaii | 105,767 | 100,245 | 97,288 | -8.0% | -2.9% |
| Idaho | 72,529 | 84,666 | 94,436 | 30.2% | 11.5% |
| Illinois | 905,751 | 971,183 | 1,082,344 | 19.5% | 11.4% |
| Indiana | 417,698 | 473,541 | 529,857 | 26.9% | 11.9% |
| Iowa | 140,098 | 158,189 | 186,840 | 33.4% | 18.1% |
| Kansas | 142,695 | 163,108 | 169,103 | 18.5% | 3.7% |
| Kentucky | 448,862 | 509,945 | 546,274 | 21.7% | 7.1% |
| Louisiana | 590,888 | 652,568 | 709,828 | 20.1% | 8.8% |
| Maine | 112,469 | 144,370 | 147,689 | 31.3% | 2.3% |
| Maryland | 230,900 | 254,160 | 274,197 | 18.8% | 7.9% |
| Massachusetts | 243,577 | 302,760 | 335,339 | 37.7% | 10.8% |
| Michigan | 761,842 | 855,415 | 960,556 | 26.1% | 12.3% |
| Minnesota | 218,725 | 238,552 | 250,431 | 14.5% | 5.0% |
| Mississippi | 321,139 | 359,613 | 376,876 | 17.4% | 4.8% |
| Missouri | 517,534 | 602,270 | 702,653 | 35.8% | 16.7% |
| Montana | 65,066 | 72,843 | 77,662 | 19.4% | 6.6% |
| Nebraska | 87,991 | 100,373 | 115,615 | 31.4% | 15.2% |
| Nevada | 98,540 | 116,610 | 121,220 | 23.0% | 4.0% |
| New Hampshire | 42,104 | 46,051 | 50,420 | 19.8% | 9.5% |
| New Jersey | 318,228 | 344,125 | 373,335 | 17.3% | 8.5% |
| New Mexico | 173,123 | 197,723 | 227,468 | 31.4% | 15.0% |
| New York | 1,351,125 | 1,452,645 | 1,616,306 | 19.6% | 11.3% |
| North Carolina | 575,947 | 651,370 | 750,459 | 30.3% | 15.2% |
| North Dakota | 36,585 | 40,072 | 42,086 | 15.0% | 5.0% |
| Ohio | 745,895 | 871,824 | 958,356 | 28.5% | 9.9% |
| Oklahoma | 320,619 | 380,189 | 409,273 | 27.7% | 7.6% |
| Oregon | 368,455 | 408,273 | 423,107 | 14.8% | 3.6% |
| Pennsylvania | 759,003 | 831,307 | 972,469 | 28.1% | 17.0% |
| Rhode Island | 72,335 | 75,883 | 78,058 | 7.9% | 2.9% |
| South Carolina | 381,211 | 453,941 | 496,593 | 30.3% | 9.4% |
| South Dakota | 48,141 | 52,408 | 54,064 | 12.3% | 3.2% |
| Tennessee | 600,722 | 743,838 | 801,926 | 33.5% | 7.8% |
| Texas | 1,567,805 | 1,875,207 | 2,254,673 | 43.8% | 20.2% |
| Utah | 91,853 | 108,080 | 125,259 | 36.4% | 15.9% |
| Vermont | 40,309 | 41,947 | 43,263 | 7.3% | 3.1% |
| Virginia | 352,419 | 393,351 | 463,184 | 31.4% | 17.8% |
| Washington | 355,676 | 419,027 | 463,619 | 30.3% | 10.6% |
| West Virginia | 255,192 | 246,700 | 245,534 | -3.8% | -0.5% |
| Wisconsin | 265,812 | 300,436 | 325,399 | 22.4% | 8.3% |
| Wyoming | 23,905 | 25,504 | 25,532 | 6.8% | 0.1% |
| TOTAL | 17,722,416 | 19,653,535 | 22,314,167 | 25.9% | 13.5% |
End Notes:
[1] All participation figures used in this report were collected by the Food and Nutrition Service of the U.S. Department of Agriculture. National participation figures refer to the number of people participating in the program in the 50 states and the District of Columbia, and exclude Guam and the Virgin Islands. Recent participation figures are available on the web at http://www.fns.usda.gov/pd/fspmain.htm. These figures are preliminary and subject to change.
[2] See Despite Job Growth, a Record 2 Million Unemployed Have Gone Without Benefits, Isaac Shapiro, Center on Budget and Policy Priorities, June 2004, available at https://www.cbpp.org/6-28-04ui.pdf.
[3] A U.S. Department of Agriculture report provides more information on trends in Food Stamp Program participation rates. The report is available on the web at http://www.fns.usda.gov/oane/MENU/Published/FSP/FILES/Participation/Trends1999-2001.pdf.