What the 2009 Trustees’ Report Shows About Social Security
On May 12, the Social Security Board of Trustees issued the 69th annual report on the program’s financial and actuarial status.[1] The trustees’ report shows some deterioration in the program’s long-run outlook, a finding that was widely expected. Nevertheless, the report does not depict a program in crisis. Policymakers should act sooner rather than later to put the program on a sound long-run footing, but today’s beneficiaries and workers approaching retirement need not fear that their Social Security benefits are at risk.
Several key points emerge from the report:
- The trustees now estimate that the trust funds will be exhausted in 2037— four years earlier than last year’s report projected, but well within the range forecast over the last decade.
- Even after 2037, Social Security could still pay three-fourths of scheduled benefits. Alarmists who claim that Social Security won’t be around when today’s young workers retire misunderstand (or misrepresent) the trustees’ projections.
- The program’s shortfall is relatively modest, amounting to 0.7 percent of Gross Domestic Product (GDP) over the next 75 years (and 1.5 percent of GDP in 2083). A mix of tax increases and benefit reductions — carefully crafted to shield the neediest recipients and to give ample notice to all participants — could put the program on a sound footing indefinitely.
- As policymakers debate Social Security’s future, they should remember that other factors — notably fast-growing health-care costs and recent tax cuts — are the principal sources of the government’s serious long-run fiscal woes.
Report Holds No Surprises
The trustees’ report focuses on the outlook for the next 75 years — a horizon that spans the lifetime of just about everybody now old enough to work. The trustees expect the program’s tax income to remain near today’s levels, at about 13 percent of taxable payroll, while declining gently as a percentage of GDP. [2] Meanwhile, the program’s costs are expected to climb to almost 18 percent of taxable payroll or 6 percent of GDP — up from 12.4 percent of taxable payroll and 4.8 percent of GDP today. Over the entire 75-year period, the trustees put the Social Security shortfall at 2 percent of taxable payroll, or 0.7 percent of GDP. The shortfall is concentrated in the later years of the projection.
It’s no accident that the program will grow steadily (relative to the economy) over the next 25 years, peaking as a share of GDP around 2035 and leveling off after that. While Social Security provides a safety net to people in all age groups — to young children and their surviving parents who have lost a family breadwinner, to working-age adults who have suffered a disability, and to retired workers and elderly widows and widowers — about three-fourths of its benefits go to people age 65 or older. The share of the population that is 65 or older will climb steeply through 2035 — from 12.7 percent of the population today to 19.8 percent then. Social Security’s rising cost as a percentage of GDP roughly mirrors that pattern. This confirms that Social Security’s fundamental challenge is demographic, traceable to a rising number of beneficiaries rather than to escalating costs per beneficiary. (Social Security differs in this respect from Medicare, where the long-term cost increases are driven more by rising health care costs than by demographic factors. [3])
As expected, the long-run imbalance is worse than the trustees forecast in March 2008. (See Table 1.) Of the 0.3 percentage point increase in the estimate of the 75-year shortfall — from last year’s 1.70 percent of taxable payroll to the current estimate of 2.00 percent of taxable payroll — the trustees ascribe half to the current recession and the rest chiefly to lower estimated mortality rates (i.e., an expectation that people will live a little longer, on average, and draw benefits for a longer period) and the change in the 75-year period that is used to measure solvency, as a result of the passing of another year. [4]
| TABLE 1: | ||
| Report Year | 75-year Deficit as a Percent of Taxable Payroll | Year When Trust Fund is Exhausted |
| 1997 | 2.23% | 2029 |
| 1998 | 2.19% | 2032 |
| 1999 | 2.07% | 2034 |
| 2000 | 1.89% | 2037 |
| 2001 | 1.86% | 2038 |
| 2002 | 1.87% | 2041 |
| 2003 | 1.92% | 2042 |
| 2004 | 1.89% | 2042 |
| 2005 | 1.92% | 2041 |
| 2006 | 2.02% | 2040 |
| 2007 | 1.95% | 2041 |
| 2008 | 1.70% | 2041 |
| 2009 | 2.00% | 2037 |
| Source: Trustees’ reports, various years. | ||
The revision between the 2008 and 2009 trustees’ report is somewhat larger than typical, but hardly unusual. All of the trustees’ reports for the last ten years have reinforced the basic message that the Social Security trust funds will be depleted sometime in the 2030s or very early 2040s.
Some commentators may seize on huge dollar figures that appear in the report, such as the $5.3 trillion shortfall estimated by the trustees through 2083, or the shortfall figure of $15.1 trillion through eternity, about which experts have expressed doubt. [5] Except over relatively short periods, however, it is not useful to express Social Security’s income, outgo, or funding gap in dollar terms. Such figures convey no sense of the economy’s ability to support the program. Expressing them in relation to taxable payroll or GDP, in contrast, puts them in proper perspective. [6]
Key Dates and What They Mean
2037 is the “headline date” in the new trustees’ report, because that is when the trust funds are expected to run out of Treasury bonds to cash in. At that point, benefits would have to be cut to match the program’s annual tax income. The program could then pay about 75 percent of regular benefits.
Although that date attracts keen attention, the trustees caution that their projections are uncertain. For example, while 2037 is their best estimate of when the trust funds will be depleted, they reckon there is an 80 percent probability that trust fund exhaustion would occur sometime between 2032 and 2043 — and a 95 percent chance that depletion will happen between 2030 and 2052. The important message is that all reasonable estimates show a long-run problem, but not an immediate crisis.
Two other, earlier dates also come in for their share of attention:
- 2016 will be the first year when the program’s total expenses (for benefits and administrative costs) exceed its tax income (from payroll taxes and income taxes that higher-income beneficiaries pay on a portion of their Social Security benefits). The trust funds, however, will keep growing after that date because of the interest income that they earn on their Treasury securities. The trustees’ report projects that the Social Security trust funds will hold $3.7 trillion in Treasury bonds at the end of 2016 and will add another $600 billion in bonds over the next seven years.
- 2024 will be the first year when the program’s expenses exceed its total income, including its interest income. At that point, the trust funds — after peaking at $4.3 trillion — will start to shrink as the program starts to redeem its Treasury securities to pay benefits.
Neither of these dates affects Social Security beneficiaries. Since the mid-1980s, Social Security has collected more in taxes each year than it pays out in benefits, has lent the excess revenue to the Treasury, and has received Treasury bonds in return. That accounts for the $2.4 trillion in Treasury bonds the trust funds hold today.
The designers of the 1983 Social Security legislation purposely designed program financing in this manner to help pre-fund some of the costs of the baby boomers’ retirement. The interest income that the Social Security trust funds earn on their bonds, and later the proceeds that the trust funds will receive when the bonds are redeemed, will enable Social Security to keep paying full benefits until 2037 even though it will start paying out more in benefits than it receives in tax revenue before then.
The new trustees’ report, though, does alert policymakers to one genuine deadline a decade away. Most analyses of the trustees’ report — including this one — focus on the combined Old-Age and Survivors Insurance (OASI) and Disability Insurance (DI) trust funds, commonly known as the Social Security trust funds. But technically, these two trust funds are separate, and the Disability Insurance trust fund faces exhaustion in 2020. (The much bigger OASI fund would last until 2039. Combined, the two funds would be depleted in 2037.) It is expected that legislators will act before 2020, however, to reallocate some payroll tax revenue between the two components of the Social Security trust funds, with the result that all parts of the program will be able to pay full benefits until 2037.
Image
 Other Factors Contribute to Budget Pressures
The Social Security shortfall contributes to the government’s long-run fiscal challenge. But it is far from the main source. It is dwarfed by fast-growing health-care costs. Past tax cuts also have contributed greatly to the current and future deficits.
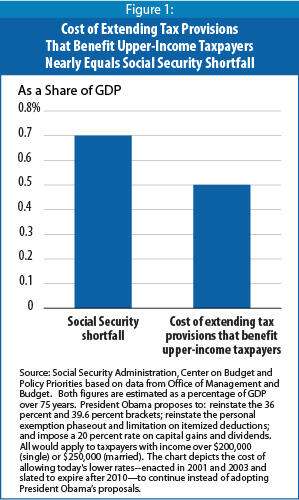
The big tax cuts enacted in 2001 and 2003 are scheduled to expire after 2010. President Obama has called for extending all of those tax cuts for people with incomes up to $250,000, but allowing the cuts to expire for wealthier taxpayers. Failing to allow the tax cuts for people over $250,000 to expire would create a funding hole nearly as big over the next 75 years as Social Security’s entire 75-year shortfall. (See Figure 1.) Members of Congress cannot simultaneously assert that the tax cuts for people at the top of the income scale are modest and affordable but that the Social Security shortfall constitutes a severe fiscal threat.
Conclusion
Because Social Security’s finances are fairly predictable, it is not difficult to craft revenue and benefit proposals that would place the program on a sound footing. The best proposals would protect the most vulnerable workers and beneficiaries and give all participants ample warning of future changes so they can plan their work and savings accordingly.
Policymakers should recognize the program’s critical importance to its recipients. Over 90 percent of the aged receive Social Security, and on average it accounts for 64 percent of their income. It provides over 90 percent of income for nearly one-third of its beneficiaries. [7]
Action on Social Security has been blocked for some time by the dispute over “privatization” — that is, whether the program should be partly replaced by private accounts invested in the stock and bond markets. The recent turmoil in the financial markets has exposed the serious problems that approach would pose, however, and privatization no longer appears to be “on the table.” As a result, policymakers now have an opportunity to reach agreement on restoring long-term solvency to one of the nation’s most important programs. This is an opportunity that should not be missed.
End Notes
[1] The 2009 Annual Report of the Board of Trustees of the Federal Old-Age and Survivors Insurance and Federal Disability Insurance Trust Funds (available at http://www.ssa.gov/OACT/TR/2009/index.html ).
[2] Payroll taxes equal 12.4 percent of taxable payroll, while dedicated income taxes from higher-income beneficiaries currently contribute another 0.4 percent, rising to 0.9 percent by 2080. Together, those sources will remain quite steady over time as a share of taxable payroll. They are expected to drift down slowly as a percentage of GDP over time, because a growing share of employee compensation will take the form of nontaxable fringe benefits, chiefly employer-sponsored health insurance.
[3] See Paul N. Van de Water, “2009 Trustees’ Report Underscores Urgency of Health Reform, Medicare Changes,” Center on Budget and Policy Priorities, May 18, 2009, https://www.cbpp.org/cms/index.cfm?fa=view&id=2818.
[4] Every year, the 75-year actuarial balance worsens slightly simply because an early (surplus) year is dropped and a late (deficit) year is added. Thus, last year’s report spanned the 2008-2082 period, while this year’s covers 2009 through 2083.
[5] In 2003, the trustees added “infinite horizon” projections that depict the trust funds’ status through eternity. The American Academy of Actuaries has criticized that measure. The Academy notes that the attention-grabbing dollar figure for Social Security’s unfunded liabilities through infinity tends to grow bigger every year as a simple mathematical result, regardless of whether there is any change in the program’s underlying financial condition. Even when that gap is appropriately put in context — by comparing it to taxable payroll or GDP — the Academy believes that the “infinite horizon” measure ascribes excessive weight to periods beyond the 75th year, by far the most uncertain part of the projections. See http://www.actuary.org/pdf/socialsecurity/tech_dec03.pdf .
[6] Because of the program’s reliance on payroll taxes (set at 12.4 percent of an individual’s first $106,800 of earnings in 2009), taxable payroll is the traditional “denominator” for these comparisons. GDP, which is more than three times as large as taxable payroll, measures the total size of the economy, and we can compare Social Security with other programs only by looking at costs or shortfalls as a percentage of GDP. (Note: Medicare Hospital Insurance, which also relies on a payroll tax, has a different taxable payroll measure because its payroll tax, unlike that used to support Social Security, is applied to all wages and salaries, not just wages and salaries up to $106,800.)
[7] Social Security Administration, Office of Research, Statistics and Evaluation, Income of the Population 55 or Older, 2006 (February 2009, available online at http://www.ssa.gov/policy/docs/statcomps/income_pop55/2006/incpop06.pdf ). Technically, these statistics refer to “aged units”—unmarried people age 65 or older, and married couples in which at least one spouse is 65 or older.
More from the Authors

Areas of Expertise