“Progressive” Price-Indexing Would Significantly Cut Social Security Benefits for Many Recipients
Proposal Would Radically Change Program’s Philosophy and Represents Misguided Approach
Proposals to tie initial benefit levels for new Social Security beneficiaries to changes in prices rather than average wages are receiving attention as policymakers wrestle with the nation’s fiscal challenges and with options to close Social Security’s long-term financing shortfall. Such proposals, commonly called “price-indexing,” are misguided for several reasons:
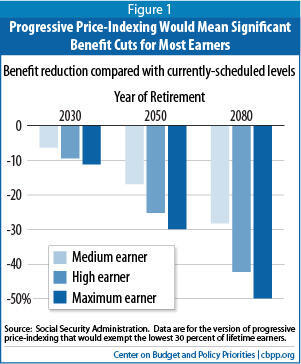
- Even in their so-called “progressive” form, they would significantly cut future benefits for very large numbers of workers — including those with relatively modest incomes — compared to currently scheduled benefit levels. Under the most common progressive price indexing proposal, benefits would be reduced by nearly 30 percent for those who earned medium wages (about $43,000 in 2010 dollars) and by as much as 50 percent for higher earners. (See Figure 1.)Image
- They would consign future retirees to fall further and further behind their previous standard of living — and behind the rest of society — over time. That is because price indexing would steadily reduce the fraction of workers’ past earnings that Social Security benefits replace.
- They would weaken — and eventually, for many workers, eliminate — the link between their earnings and the benefits they receive upon retirement. That would represent a sharp change in the program’s philosophy and would risk undercutting its broad base of support.
- They do not represent a balanced approach to fixing Social Security’s financing shortfall because they would close an overly large share of the gap through benefit cuts.
Some supporters of progressive price-indexing wrongly imply that the retirees it would affect enjoy a lavish retirement. In reality, Social Security benefits are modest. The average benefit is only about $14,000 a year and, for a worker in the middle of the income distribution, Social Security replaces barely over a third of past earnings. Moreover, most retirees do not have significant income from other sources. Many of those who would be affected under the leading progressive price indexing plan rely on Social Security for three-fourths or more of their total income.
Price-indexing proposals are not readily understood by the public and are complicated to explain.[1] Yet, they would represent a very large change to the Social Security system. There are alternatives for restoring Social Security solvency — and for trimming benefits for the most affluent Social Security beneficiaries if that is a desired goal — that do not pose the serious problems that progressive price indexing presents, even in its more limited forms.
Price-Indexing Is Radically Different from Current Approach to Calculating Benefits
Under current law, initial Social Security benefits for successive generations of retirees grow with average wages in the economy. This ensures that each generation receives Social Security benefits that reflect the living standard of its times. (After retirees begin receiving benefits, their benefits are adjusted annually to keep pace with increases in the cost of living, as measured by the Consumer Price Index. Price-indexing proposals would change the calculation of initial benefits, not the subsequent cost-of-living adjustments.)
Tying the initial benefit level for each year’s batch of new retirees to the overall average wage is known as “wage-indexing”; it effectively assures that for workers at a given relative income level, the share of previous earnings that their benefits replace will stay constant for future generations of retirees. For example, individuals who retire at age 65 and have earned medium wages (about $43,000 in 2010 dollars) will initially collect a Social Security benefit equal to about 36 percent of what they earned, on average, before retirement. Very low earners (those earning about $11,000) will initially collect a benefit that equals about 67 percent of their past average earnings, and maximum earners (that is, workers who throughout their career earned the maximum earnings subject to Social Security taxes, currently $106,800) will collect a benefit equal to about 24 percent of their past earnings.[2]
Price indexing represents a radically different approach. Under full price-indexing, initial Social Security benefits for all beneficiaries would keep pace only with prices, rather than wages, from one generation to the next. Because prices increase more slowly than wages, this would result in successively larger benefit reductions over time, compared to the benefits that are scheduled to be paid under the current Social Security system. Sustained over many decades, it would cause beneficiaries to fall further and further behind the living standards of the rest of the population and to suffer a steeper decline in their own income and living standards when they retired.
President Bush’s 2005 Social Security plan and several more recent plans — including Congressman Paul Ryan’s “Roadmap for America’s Future” [3] — feature a variant of price-indexing that proponents call “progressive price-indexing,” under which:
- The bottom 30 percent (or a larger percentage) of workers would continue to get benefits that are calculated as under current law.
- Workers who spent their full career with earnings at or above the program’s maximum taxable amount would get an initial benefit whose purchasing power is frozen (at 2018 levels, in Congressman Ryan’s bill).
- Everyone in between would get a blend of the two formulas, meaning that their initial benefit would be somewhere between the currently promised benefit and the benefit that would be provided under price indexing.[4]
Alternative proposals would exempt the lowest 50 percent or 67 percent of earners, rather than the lowest 30 percent, from price-indexing; see the appendix. Although undeniably less harsh than full price-indexing, progressive price-indexing poses serious problems regardless of the share of beneficiaries it affects because its design is inherently problematic.
Progressive Price-Indexing Would Significantly Cut Future Benefits
The leading version of progressive price-indexing would cut benefits below currently scheduled levels for all but the lowest 30 percent of earners. Those cuts would grow for each future generation of retirees. Assuming that the policy started for people reaching age 62 in 2018 — that is, for people who are now under age 55 — the benefit reductions would reach nearly 30 percent for a medium earner by 2080. For higher earners, the reductions could equal as much as 50 percent in that year. (See Figure 1.)
Proponents of progressive price-indexing imply that beneficiaries can readily afford such reductions. In reality, Social Security benefits are modest. A lifelong medium earner retiring at 65 in 2010 receives a benefit of $1,397 a month ($16,764 a year), only about 55 percent above the poverty line and barely more than what researchers reckon is a “no-frills, bare-bones” budget for retirees.[5]
Nor do many of the retirees who would be affected have significant income from other sources. Although there are undeniably some wealthy retirees, most depend on Social Security for the bulk of their income, and only a modest percentage have other income high enough to permit a lavish lifestyle. As Table 1 shows, median household income for elderly Social Security beneficiaries in 2008 — including income other than Social Security as well as spouses’ incomes — was only about $20,600 for beneficiaries in the middle of the distribution. Even among the next-to-the-top fifth of beneficiaries, total median household income was only $30,000.
In recent years, fewer employers have been offering defined-benefit pension plans, which guarantee a certain benefit level upon retirement. More employers instead offer defined-contribution plans, which pay a benefit based on a worker’s contributions and the rate of return they earn, which is subject to fluctuations in financial markets.[6] For most workers, Social Security will be their only source of guaranteed retirement income that is not subject to investment or financial market risk.
| TABLE 1: Social Security Benefits Are Modest, and Most Beneficiaries Do Not Have Significant Income From Other Sources | ||
| Benefit Quintile | Benefit Amount | Median Total Income |
| Bottom | Up to $9,989 | $10,517 |
| Second | $9,989 - 13,157 | $14,100 |
| Third | $13,157 – 16,757 | $20,579 |
| Fourth | $16,757 – 22,757 | $30,000 |
| Top | $22,757 and up | $49,906 |
| Source: Social Security Administration, Income of the Population 55 or Older, 2008, Table 3.A6. Data are for “aged units”— married couples in which at least one spouse is 65 or older, and unmarried beneficiaries 65 or older. | ||
Benefits Would Steadily Shrink as Share of Former Earnings for Most Workers
Social Security has always aimed to provide retired or disabled wage-earners (or their survivors) with a reasonable fraction of their past earnings. Benefits replace a higher fraction of past earnings for lower-paid workers than for higher-paid workers, which is one of the program’s progressive features. In Social Security jargon, lower-wage workers receive a higher “replacement rate.”
Replacement rates in the United States are low compared with other advanced countries. Among the 30 countries in the Organisation for Economic Cooperation and Development, the U.S. ranks near the bottom in the share of past earnings that are replaced by the public-pension program. [9]
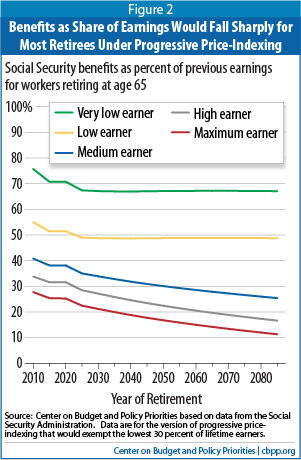
Progressive price-indexing would slash these already-low replacement rates. Under the leading progressive price indexing proposal, Social Security benefits would, by 2080, replace just 26 percent of a medium worker’s past earnings and only 12 percent of a high earner’s. (See Figure 2.)
Britain provides an interesting lesson about the pitfalls of price-indexing and the growing public opposition it generates. From 1973 until 1980, that nation’s Basic State Pension was indexed to wage growth. The Pension Act of 1980 then changed that to price growth, eroding the generosity of pensions relative to the incomes of the rest of the population. In response, and as part of a larger package of pension reforms, the Pensions Act of 2007 provided for a return to wage-indexation by 2015. Britain’s new coalition government intends to carry out that policy even as it proposes a major austerity effort.[10]
Weakening Link Between Earnings and Benefits Could Undermine Support for Program
Social Security is progressive in the sense that benefits make up a larger share of previous earnings for lower earners than for higher earners, on the logic that lower earners are less likely to have other pension coverage and are less able to save. For example:
- A low-paid worker who earned about $19,000 a year (in 2010 terms) and retires at age 65 in 2010 will receive an initial retirement benefit of about $10,200. That benefit replaces 55 percent of his or her prior earnings. [11]
- A medium earner whose earnings averaged about $43,000 a year gets an annual benefit of about $16,800. The benefit is larger in dollar terms than for the low-paid worker, but the replacement rate is lower — only 41 percent. Put another way, the medium earner earned about 2.2 times as much as the low-paid worker, but his or her benefit is 1.6 times as high.
- And the top beneficiary — a worker who spent his or her entire career earning the maximum amount on which payroll taxes are levied (currently $106,800 a year), gets an annual benefit of about $26,300. This top earner earned 5.5 times as much as the low-paid worker but gets a benefit that is 2.6 times as high.
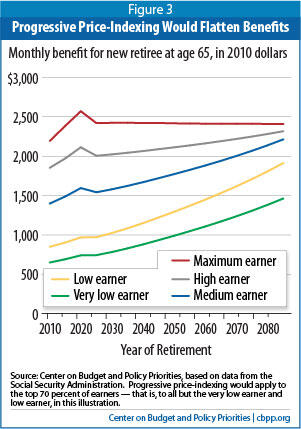
Progressive price-indexing would greatly weaken the link between retirees’ benefits and their former earnings. The leading proposal would gradually reduce the benefits payable to all but the lowest 30 percent of workers. In the long run, the top 70 percent of workers would all end up getting virtually the same benefit, despite having paid very different amounts in payroll taxes. (See Figure 3.) That could undermine the program’s broad public support over time, and as a result, jeopardize Social Security’s most significant achievements, including its universal coverage and protection against death and disability.[12]
Progressive Price-Indexing Is Not a Balanced Approach
Progressive price-indexing would have powerful effects on Social Security’s finances, which explains its appeal to proponents. Because it reduces benefits by such large amounts over time, the leading proposal would close half of the program’s deficit over 75 years and over three-quarters of the gap in the 75th year, according to the Social Security actuaries.
Under the assumptions of the Congressional Budget Office (CBO), that same proposal would essentially close the entire Social Security gap, both over 75 years and in the 75th year.[13] That’s because CBO expects higher growth in real wages than do the actuaries, so partially or entirely ignoring wage growth in setting initial benefit levels — as price indexing would do — would produce even greater benefit cuts and have an especially large impact on program finances.
These differing estimates illustrate a perverse implication of progressive price-indexing: if real earnings in the U.S. economy grow more robustly, the policy would impose deeper cuts in benefits — even though stronger wage growth would lessen Social Security’s financing problems and thereby lower the amount of benefit cuts or revenue increases needed to restore the program to solvency. Conversely, if economic growth slowed, progressive price indexing would deliver smaller benefit reductions, even though the Social Security shortfall would be wider. [14] Progressive price indexing thereby turns the program’s dynamics upside down.
Moreover, although the Social Security trustees estimate that the program’s financing gap will stabilize around 2040, the reductions in benefits under price-indexing would grow steadily deeper in decades well beyond that point — meaning that retirees’ standard of living would fall further and further behind the rest of society.[15]
Progressive price-indexing is not a balanced or well-designed approach to fixing Social Security. Policymakers must take steps to ensure Social Security’s future solvency, using a mix of tax increases, benefit reductions, and carefully-targeted benefit enhancements, but progressive price-indexing should not be part of the package.
Technical Appendix
To understand the nuts and bolts of price-indexing, it’s essential to know how Social Security benefits are calculated and their relationship to earnings.
All Social Security benefits are pegged to an individual’s “Primary Insurance Amount” (PIA), which in turn depends on the individual’s “Average Indexed Monthly Earnings” (AIME). AIME is computed by taking the worker’s entire lifetime earnings and restating them in terms of the economy-wide wages that prevailed when the worker reached age 60 (for retired workers) or the second year preceding eligibility (for disabled workers). In other words, for a new retiree, the worker’s earnings for any given year are adjusted to reflect the increase in average wages in the economy between that year and the year in which he or she turned 60. This “wage-indexing” step simply brings the worker’s past earnings up to date and makes it possible to fairly compare earnings over a career that may span four decades or more. (Earnings after age 60 are counted at their nominal value — i.e., they are not indexed.) Social Security averages the top 35 years of earnings and divides by 12 to compute a monthly AIME level.
The PIA, in turn, is calculated by applying a three-part formula to the AIME. For workers reaching age 62 in 2010, the PIA equals .90 times the first $761 of AIME, .32 times AIME between $761 and $4,586, and .15 times AIME over $4,586. Those dollar “bend points,” or brackets, are adjusted every year in accordance with the percentage change in average wages in the U.S. economy. The three multiplication factors (.90, .32, and .15) do not change. This careful sequence of steps — indexing past earnings, adjusting the bend points, and applying an unchanging set of factors — achieves the stability of replacement rates in current law.[16]
Over the years, proponents have applied the “price-indexing” label to at least four different approaches, reflecting the fact that wages and prices enter the Social Security benefit calculation in numerous places. As Biggs, Brown, and Springstead have explained, [17] the four approaches are as follows:
- AIME indexing — In computing AIME, the worker’s annual wages over the course of his or her career would be adjusted by the percentage change in prices since the years in which the wages were earned, rather than by the percentage change in average wages in the economy over that period. That would lower beneficiaries’ AIMEs and thus reduce Social Security benefits. A long transition period would be needed to prevent a sudden, sharp drop in benefits for new retirees.
- Bend point indexing — This would index the bend points ($761 and $4,586 in 2010) in the PIA formula to price growth rather than wage growth. As a result, over time, more earnings would be subject to the .32 rate rather than the .90 rate, and to the .15 rate than the .32 rate, thus lowering benefits.
- AIME and bend point indexing — This approach would combine the above two approaches.[18]
- PIA factor indexing — This approach would directly reduce the three factors in the PIA formula (the .90, .32, and .15) over time so that the initial Social Security benefit amounts would remain constant after adjusting only for increases in prices in the economy, rather than for increases in average wages. This approach was an element of one of the three plans offered by President Bush’s Commission to Strengthen Social Security. [19] While this approach (which we call full or PCSSS price-indexing) is not considered a live option now, it is an important intermediate step to understanding the so-called progressive price indexing variant of it.
Under PCSSS price-indexing, the method for calculating AIME would not change, and the two bend points would adjust as they do under current law, but the three replacement-rate factors would decline every year to offset rising real wages (measured as the difference between growth in average wages and in the Consumer Price Index). That would lead to constant real benefits — and declining replacement rates — for all workers. By 2080, as shown in Table 2, the .90, .32, and .15 factors would become .437, .155, and .073.
Progressive price-indexing is designed to achieve the same results as PCSSS price-indexing for a worker with lifelong earnings at the taxable maximum, while sparing the lowest 30 percent (or in other variants, the lowest 50 percent or 67 percent) of earners from any cuts in currently scheduled benefits. Workers earning more than the 30th percentile but less than the taxable maximum would face graduated reductions in benefits.
To achieve this result, the current 32-percent bracket would be split. The new bend point would be set 28.6 percent of the way between the .32 and .15 bend points — or at $1,855 in 2010 terms. (Under the variant that would spare 50 percent of earners, the new kink would be 61.5 percent of the way between the current bend points, or $3,113 in 2010 terms; and in the variant that would exempt 67 percent of workers, the new bend point would be 91.7 percent of the way between the current ones, or $4,269 in 2010 terms.)
Workers with AIMEs below the new bend point would be exempt from price-indexing. For workers with AIMEs above the new bend point, the current 32-percent and 15-percent factors would fall sharply. (See Table 2.)
| TABLE 2: Replacement-rate factors in PIA formula, selected years | ||||
| First | Second | Third | Fourth | |
| Current law (three brackets) | ||||
| 2010 | 0.900 | 0.320 | 0.150 | |
| 2030 | 0.900 | 0.320 | 0.150 | |
| 2050 | 0.900 | 0.320 | 0.150 | |
| 2080 | 0.900 | 0.320 | 0.150 | |
| PCSSS price-indexing (three brackets) | ||||
| 2010 | 0.900 | 0.320 | 0.150 | |
| 2030 | 0.773 | 0.275 | 0.129 | |
| 2050 | 0.611 | 0.217 | 0.102 | |
| 2080 | 0.437 | 0.155 | 0.073 | |
| Progressive price-indexing above 30th percentile of earnings | ||||
| 2010 | 0.900 | 0.320 | 0.320 | 0.150 |
| 2030 | 0.900 | 0.320 | 0.243 | 0.114 |
| 2050 | 0.900 | 0.320 | 0.144 | 0.067 |
| 2080 | 0.900 | 0.320 | 0.038 | 0.018 |
| Progressive price-indexing above 50th percentile of earnings | ||||
| 2010 | 0.900 | 0.320 | 0.320 | 0.150 |
| 2030 | 0.900 | 0.320 | 0.213 | 0.100 |
| 2050 | 0.900 | 0.320 | 0.076 | 0.036 |
| 2080 | 0.900 | 0.320 | 0.000 | 0.000 |
| Progressive Price-indexing above 67th percentile of earnings | ||||
| 2010 | 0.900 | 0.320 | 0.320 | 0.150 |
| 2030 | 0.900 | 0.320 | 0.155 | 0.073 |
| 2050 | 0.900 | 0.320 | 0.000 | 0.000 |
| 2080 | 0.900 | 0.320 | 0.000 | 0.000 |
| Source: CBPP based on data from the Social Security Administration, using assumptions in the 2010 Trustees’ Report. Note: PIA=Primary Insurance Amount, PCSSS=President’s Commission to Strengthen Social Security (2001). Under current law, there are two bend points in the PIA formula—at $761 and $4,586, in 2010 dollars. PCSSS price-indexing would retain those bend points. Progressive price-indexing would create a new bend point 28.6 percent, 61.5 percent, or 91.7 percent of the way between the current bend points for the 30-percent, 50-percent, or 67-percent options, respectively. | ||||
The top two factors would eventually reach zero under progressive price-indexing. Under the assumptions of the 2010 Trustees Report, that would happen sometime beyond 2085 for the 30-percent option. It would happen around 2065 in the 50-percent option and around 2045 under the 67-percent option. When those top two factors reach zero, everybody in the top 70 percent (or top 50 or 33 percent) of the earnings distribution would receive exactly the same benefit.
The benefit calculations in this paper are consistent with a recent analysis of progressive price-indexing (and other benefit changes) by the Social Security Administration (SSA) actuaries, and with CBPP’s earlier response to that analysis.[20] Those analyses depicted the proposal’s effects on five “scaled workers” conventionally used in many SSA analyses. Those hypothetical workers, all of whom worked steadily before retiring at 65, had lifetime earnings averaging anywhere from $10,771 to $106,800 (indexed to 2010 dollars).
The SSA actuaries depicted the proposal’s effect on future benefits in “wage-indexed” terms. Under that approach, benefits that are flat in dollar terms (after adjustment for inflation) are depicted as falling (when adjusted for the growth in average wages). This paper instead shows future benefits in constant dollars, a more familiar concept. That highlights the constancy of future benefits paid to lifelong maximum workers, which is the linchpin of all price-indexing proposals. The projected replacement rate — defined as the monthly benefit divided by past monthly earnings — shows the sharp decline in benefits relative to wages.
| TABLE 3: Monthly Social Security Benefits and Replacement Rates for Hypothetical Workers At Various Earnings Levels Retiring at Age 65, Selected Years | ||||||||||
| Current law | PCSSS Price-Indexing | Progressive Price-Indexing above 30th Percentile | Progressive Price-Indexing above 50th Percentile | Progressive Price-Indexing above 67th Percentile | ||||||
| Benefit (2010$) | Replace- ment rate | Benefit (2010$) | Replace- ment rate | Benefit (2010$) | Replace- ment rate | Benefit (2010$) | Replace- ment rate | Benefit (2010$) | Replace- ment rate | |
| Very low earner ($10,771 per year) | ||||||||||
| 2010 | 648 | 75.7% | 648 | 75.7% | 648 | 75.7% | 648 | 75.7% | 648 | 75.7% |
| 2020 | 720 | 70.8% | 720 | 70.8% | 720 | 70.8% | 720 | 70.8% | 720 | 70.8% |
| 2030 | 761 | 67.1% | 676 | 59.6% | 761 | 67.1% | 761 | 67.1% | 761 | 67.1% |
| 2040 | 855 | 67.0% | 676 | 52.9% | 855 | 67.0% | 855 | 67.0% | 855 | 67.0% |
| 2050 | 962 | 67.1% | 676 | 47.2% | 962 | 67.1% | 962 | 67.1% | 962 | 67.1% |
| 2060 | 1,077 | 67.2% | 676 | 42.2% | 1,077 | 67.2% | 1,077 | 67.2% | 1,077 | 67.2% |
| 2070 | 1,204 | 67.2% | 676 | 37.8% | 1,204 | 67.2% | 1,204 | 67.2% | 1,204 | 67.2% |
| 2080 | 1,345 | 67.2% | 676 | 33.8% | 1,345 | 67.2% | 1,345 | 67.2% | 1,345 | 67.2% |
| Low earner ($19,388 per year) | ||||||||||
| 2010 | 848 | 55.1% | 848 | 55.1% | 848 | 55.1% | 848 | 55.1% | 848 | 55.1% |
| 2020 | 941 | 51.4% | 941 | 51.4% | 941 | 51.4% | 941 | 51.4% | 941 | 51.4% |
| 2030 | 995 | 48.8% | 884 | 43.3% | 995 | 48.8% | 995 | 48.8% | 995 | 48.8% |
| 2040 | 1,119 | 48.7% | 884 | 38.5% | 1,119 | 48.7% | 1,119 | 48.7% | 1,119 | 48.7% |
| 2050 | 1,259 | 48.8% | 884 | 34.3% | 1,259 | 48.8% | 1,259 | 48.8% | 1,259 | 48.8% |
| 2060 | 1,409 | 48.8% | 884 | 30.6% | 1,409 | 48.8% | 1,409 | 48.8% | 1,409 | 48.8% |
| 2070 | 1,575 | 48.9% | 884 | 27.4% | 1,575 | 48.9% | 1,575 | 48.9% | 1,575 | 48.9% |
| 2080 | 1,759 | 48.8% | 884 | 24.5% | 1,759 | 48.8% | 1,759 | 48.8% | 1,759 | 48.8% |
| Medium earner ($43,084 per year) | ||||||||||
| 2010 | 1,397 | 40.8% | 1,397 | 40.8% | 1,397 | 40.8% | 1,397 | 40.8% | 1,397 | 40.8% |
| 2020 | 1,551 | 38.1% | 1,551 | 38.1% | 1,551 | 38.1% | 1,551 | 38.1% | 1,551 | 38.1% |
| 2030 | 1,640 | 36.2% | 1,457 | 32.1% | 1,536 | 33.9% | 1,609 | 35.5% | 1,640 | 36.2% |
| 2040 | 1,844 | 36.1% | 1,457 | 28.5% | 1,625 | 31.8% | 1,779 | 34.8% | 1,844 | 36.1% |
| 2050 | 2,075 | 36.2% | 1,457 | 25.4% | 1,725 | 30.1% | 1,971 | 34.4% | 2,075 | 36.2% |
| 2060 | 2,322 | 36.2% | 1,457 | 22.7% | 1,831 | 28.6% | 2,177 | 34.0% | 2,322 | 36.2% |
| 2070 | 2,594 | 36.2% | 1,457 | 20.3% | 1,949 | 27.2% | 2,411 | 33.7% | 2,594 | 36.2% |
| 2080 | 2,899 | 36.2% | 1,457 | 18.2% | 2,081 | 26.0% | 2,694 | 33.6% | 2,899 | 36.2% |
| High earner ($68,935 per year) | ||||||||||
| 2010 | 1,852 | 33.8% | 1,852 | 33.8% | 1,852 | 33.8% | 1,852 | 33.8% | 1,852 | 33.8% |
| 2020 | 2,055 | 31.6% | 2,055 | 31.6% | 2,055 | 31.6% | 2,055 | 31.6% | 2,055 | 31.6% |
| 2030 | 2,173 | 30.0% | 1,931 | 26.6% | 1,968 | 27.1% | 2,002 | 27.6% | 2,068 | 28.5% |
| 2040 | 2,443 | 29.9% | 1,931 | 23.6% | 2,009 | 24.6% | 2,081 | 25.5% | 2,222 | 27.2% |
| 2050 | 2,749 | 30.0% | 1,931 | 21.0% | 2,055 | 22.4% | 2,170 | 23.7% | 2,424 | 26.4% |
| 2060 | 3,078 | 30.0% | 1,931 | 18.8% | 2,105 | 20.5% | 2,265 | 22.1% | 2,713 | 26.4% |
| 2070 | 3,438 | 30.0% | 1,931 | 16.9% | 2,159 | 18.8% | 2,411 | 21.0% | 3,031 | 26.5% |
| 2080 | 3,842 | 30.0% | 1,931 | 15.1% | 2,221 | 17.3% | 2,694 | 21.0% | 3,387 | 26.4% |
| Maximum earner ($106,800 per year)a | ||||||||||
| 2010 | 2,192 | 27.7% | 2,192 | 27.7% | 2,192 | 27.7% | 2,192 | 27.7% | 2,192 | 27.7% |
| 2020 | 2,502 | 25.2% | 2,502 | 25.2% | 2,502 | 25.2% | 2,502 | 25.2% | 2,502 | 25.2% |
| 2030 | 2,655 | 23.8% | 2,359 | 21.2% | 2,358 | 21.2% | 2,357 | 21.2% | 2,354 | 21.1% |
| 2040 | 2,984 | 23.8% | 2,359 | 18.8% | 2,356 | 18.8% | 2,353 | 18.8% | 2,349 | 18.7% |
| 2050 | 3,355 | 23.9% | 2,356 | 16.8% | 2,352 | 16.7% | 2,348 | 16.7% | 2,424 | 17.3% |
| 2060 | 3,751 | 23.9% | 2,354 | 15.0% | 2,348 | 15.0% | 2,343 | 15.0% | 2,713 | 17.3% |
| 2070 | 4,191 | 23.9% | 2,354 | 13.4% | 2,346 | 13.4% | 2,411 | 13.8% | 3,031 | 17.3% |
| 2080 | 4,684 | 23.9% | 2,354 | 12.0% | 2,345 | 12.0% | 2,694 | 13.8% | 3,387 | 17.3% |
| Source: Center on Budget and Policy Priorities based on data from the Social Security Administration. Earnings are expressed in 2010-equivalent levels; the average earnings that determined these workers’ benefits were slightly lower. Price-indexing proposals are assumed to affect workers who reach 62 in 2018 or later. a. The slight downward drift in the real benefit for the lifelong maximum worker occurs because this worker is assumed to have earnings at ages 62 through 64 that replace earlier years in the Average Indexed Monthly Earnings calculation. Price-indexing proposals are designed to keep the real benefit constant for maximum workers who retire at 62, not at an older age. | ||||||||||
End Notes
[1] Kilolo Kijakazi and Robert Greenstein, “Replacing ‘Wage Indexing’ With ‘Price Indexing’ Would Result in Deep Reductions Over Time in Social Security Benefits,” Center on Budget and Policy Priorities, December 14, 2001.
[2] These are the replacement rates for workers who reach age 62 in 2022 or later, when the full retirement age stabilizes at 67; the current replacement rate is somewhat higher. See Table 3 in the technical appendix.
[3] Paul N. Van de Water, “The Ryan Budget’s Radical Priorities,” Center on Budget and Policy Priorities, July 7, 2010. Congressman Ryan’s proposal would apply progressive price-indexing to retirees who reach age 62 in 2018 or later.
[4] This approach was first proposed by Robert Pozen , “A ‘Progressive’ Solution to Social Security,” Wall Street Journal, p. A20, March 15, 2005.
[5] The Census Bureau poverty threshold for a single person 65 or older in 2009 was $10,289; the 2010 figure is not yet announced. The Department of Health and Human Services defines the 2010 poverty guideline for a one-person household (of any age) in the lower 48 states as $10,830. An “Elder Economic Security Index” developed by Wider Opportunities for Women estimates that a minimal standard of living for an elder person living alone housing in 2006 averaged $15,134 for those in owner-occupied housing and $19,541 for those in rental housing; see http://www.wowonline.org/ourprograms/eesi/documents/NatlEESIIndexFAQs.pdf .
[6] Chapter 10, “Aggregate Trends in Defined Benefit and Defined Contribution Plan Sponsorship, Participation, and Vesting,” EBRI Databook on Employee Benefits, Employee Benefit Research Institute, updated December 2009, http://www.ebri.org/pdf/publications/books/databook/DB.Chapter%2010.pdf .
[7] As the full retirement age rises from 66 to 67 between now and 2022, the percentage of the full benefit (or Primary Insurance Amount) payable at age 62 will fall from 75 percent to 70 percent, the percentage payable at age 65 will drop from 93.3 percent to 86.7 percent, and the percentage payable at age 70 will fall from 132 percent to 124 percent. A rising full retirement age results in a benefit cut regardless of the age at which a worker retires and begins to draw benefits.
[8] John Karl Scholz and Ananth Seshadri, “What Replacement Rates Should Households Use?,” Michigan Retirement Research Center, Working Paper 2009-214, September 2009, http://www.mrrc.isr.umich.edu/publications/papers/pdf/wp214.pdf. Munnell et al. also note that rising premiums for Medicare Part B, which are deducted from most Social Security checks, are rising faster than benefits and are thus putting pressure on replacement rates; see Alicia H. Munnell, Anthony Webb, and Francesca Golub-Sass, “The National Retirement Risk Index: After the Crash,” Center for Retirement Research at Boston College, Issue Brief 9-22, October 2009, http://crr.bc.edu/images/stories/Briefs/IB_9-22.pdf.
[9] Virginia P. Reno and Benjamin Veghte, “Economic Status of the Elderly in the United States,” National Academy of Social Insurance, September 2010 (www.nasi.org); Organisation for Economic Cooperation and Development, “Pensions at a Glance 2009: Retirement-Income Systems in OECD Countries” (www.oecd.org).
[10] The Basic State Pension (BSP) is a flat amount paid to everyone who paid National Insurance contributions for 30 years. (It is pro-rated for shorter careers.) Earnings-related benefits are paid on top of the BSP, and are based on career-average earnings updated (or “revalued”) in a way that is very similar to Social Security’s wage-indexing approach. See Antoine Bozio, Rowena Crawford, and Gemma Tetlow, “The History of State Pensions in the UK: 1948 to 2010,” Institute for Fiscal Studies Briefing Note BN105, 2010, http://www.ifs.org.uk/bns/bn105.pdf.
[11] For details of this and other examples, see Table 3 in the technical appendix.
[12] Center on Budget and Policy Priorities, “Top Ten Facts about Social Security on the Program’s 75th Anniversary,” August 13, 2010.
[13] Congressional Budget Office, “An Analysis of the Roadmap for America’s Future Act of 2010,” January 27, 2010; “Social Security Policy Options,” July 2010 (both online at http://www.cbo.gov/publications/collections/collections.cfm?collect=5 ).
[14] Jason Furman, “An Analysis of Using ‘Progressive Price Indexing’ to Set Social Security Benefits,” Center on Budget and Policy Priorities, May 2, 2005.
[15] Kathy A. Ruffing and Paul N. Van de Water, “What the 2010 Trustees’ Report Shows about Social Security,” Center on Budget and Policy Priorities, August 13, 2010.
[16] As previously noted, replacement rates are drifting down as a consequence of the rise in the full retirement age (FRA). As the FRA rises from 66 to 67, the worker retiring at 65 in our examples will receive 86.7 percent of PIA, down from 93.3 percent now.
[17] Andrew G. Biggs, Jeffrey R. Brown, and Glenn Springstead, “Alternative Methods of Price Indexing Social Security: Implications for Benefits and System Financing,” National Bureau of Economic Research Working Paper 11406, June 2005.
[18] This approach was recommended in 1976 by a panel chaired by William Hsiao (see http://www.ssa.gov/history/reports/hsiao/hsiaoIntro.html). Presidents Ford and Carter, and the Congress, rejected the Hsiao method and instead adopted a wage-indexing approach along the lines recommended by the 1975 Advisory Council on Social Security.
[19] Strengthening Social Security and Creating Personal Wealth for All Americans, Report of the President’s Commission , December 2001, http://www.ssa.gov/history/reports/pcsss/Final_report.pdf.
[20] Letter from Stephen C. Goss to the Honorable Earl Pomeroy, October 18, 2010, http://waysandmeans.house.gov/media/pdf/111/SSA_Actuary_BenefitsExample_Letter.pdf ; Paul N. Van de Water, “Ryan Plan Makes Deep Cuts in Social Security,” Center on Budget and Policy Priorities, October 21, 2010.
More from the Authors

Areas of Expertise