Medicaid Block Grant Would Produce Disparate and Inequitable Results Across States
Some policymakers, including House Energy and Commerce Committee Chairman Fred Upton and House Budget Committee Chairman Paul Ryan, are considering converting Medicaid to a block grant to produce large federal budget savings. For example, a block-grant proposal that Ryan co-authored last fall would reduce federal Medicaid spending by $180 billion over the next ten years, according to the Congressional Budget Office (CBO). [1] All states would face substantial reductions in federal funding under such a block grant,[2] but some states would likely be hit particularly hard — including states whose current Medicaid expenditure levels are relatively low and states whose expenditures would rise relatively quickly in future years due to demographic, economic, or other factors:
- States whose current Medicaid expenditure levels are relatively low would receive less initial funding than other states. Under block-grant proposals, the formula for setting each state’s initial federal funding level typically relies to a large extent on a state’s current level of expenditures. It thus would effectively lock in existing variations across state Medicaid programs. States that had relatively narrow Medicaid eligibility and benefits, relatively low provider reimbursement rates, or lower overall health care costs when the block grant was instituted would receive fewer funds than other states. Such states would likely have to finance any subsequent improvements to their Medicaid programs entirely with their own funds, since no additional federal funds beyond the block grant amount would be available.
- States whose Medicaid costs rise relatively quickly under a block grant would be especially likely to have inadequate federal funding. Under a block grant, federal funding would be adjusted annually under some formula that is intended to produce federal savings over time, typically by increasing funding at a considerably slower rate than the expected increases in health care costs. As a result, states would receive less federal funding than under the current financing system. This reduction would grow each year, increasing the risk that federal funding would become increasingly inadequate over time and lead to increasingly severe cutbacks.
In any period, some states experience higher-than-average Medicaid cost growth due to factors largely beyond their control — such as a recession that disproportionately affects the state or a greater-than-average increase in the number of low-income elderly residents. Those states would be much more likely to have severely inadequate federal funding than other states because their block grant allocations would not rise to a greater degree to help them respond to these larger cost increases.
Some states that fear being disadvantaged by the formulas for determining the initial annual block grant amounts and the subsequent annual increases in block grant levels might attempt to seek modifications to the block grant design to mitigate these adverse effects. Any changes that helped some states, however, would inevitably harm others, and those states would resist such changes. This illustrates the zero-sum nature of a Medicaid block grant: capping overall federal funding at a level designed to fall further and further below the total amount of federal funding that states would receive under current law would force states to compete for shares of an increasingly inadequate pool of federal resources.
Initial Block Grant Amounts Would Disadvantage Lower-Spending States and Place Them at Greater Risk
Under current law, the federal government pays a fixed share of a state’s Medicaid costs. Under a block grant, it would pay only a fixed dollar amount of those costs, with the state responsible for all costs exceeding the block-grant amount. Block-grant proposals vary on how this fixed amount would be determined, but typically it would be based in large part on the state’s current level of spending (for example, its expenditure level in some prior base year or its current share of total federal Medicaid expenditures). Such an approach would place states with relatively low current levels of expenditure at a significant disadvantage.
Medicaid expenditure levels vary significantly across states, even after taking into account differences in population size. For example, in fiscal year 2008, the five highest-spending states (New York, Delaware, Rhode Island, Maine, and Massachusetts) spent an average of $1,883 per capita, while the five lowest-spending states (Nevada, Utah, Colorado, Virginia, and Georgia) spent $630, or about one-third as much. [3] These large differences reflect a number of factors, many of which are beyond states’ direct control. Such factors include:
State Differences in Medicaid Eligibility and Enrollment
States differ significantly in both the share of their overall population that is enrolled in Medicaid and the demographic composition of their Medicaid enrollees. One reason is that Medicaid eligibility criteria vary widely across the states. At one end of the spectrum, for example, Minnesota provides full Medicaid coverage to working parents with incomes up to 215 percent of the poverty line; at the other end, Alabama covers working parents only up to 24 percent of the poverty line, or an annual income of $4,450 for a family of three. [4]
Similarly, federal law requires states to cover poor elderly people with incomes up to only about 76 percent of the poverty line. About half of the states cover seniors with incomes modestly above this low level; the other half do not. States also vary in the degree to which they have extended coverage to seniors and people with disabilities who need long-term-care services and supports. [5]
Still another factor affecting a state’s Medicaid enrollment is the relative availability of employer-sponsored insurance among low-income families. Small employers are less likely to offer health insurance than larger employers, so in states with a greater proportion of smaller firms, employers are less likely to offer coverage. In 2009, the share of firms offering coverage ranged from 40 percent in Montana to 74 percent in the District of Columbia and 85 percent in Hawaii (which requires most employers to offer coverage). [6]
A state’s poverty rate also affects the demand for Medicaid coverage: a smaller percentage of people in poverty means that fewer people are likely to be eligible for Medicaid. In 2009, the poverty rate ranged from 8 percent in New Hampshire to 23 percent in Mississippi. [7] Wage rates, unemployment rates, and overall state economic conditions also affect the number of people eligible for Medicaid.
Finally, some states do a better job than others of enrolling eligible individuals and families in Medicaid. For example, in 2008, the participation rate among eligible children ranged from 55 percent in Nevada to 95 percent in Massachusetts. [8]
Differences in Average Costs per Medicaid Beneficiary
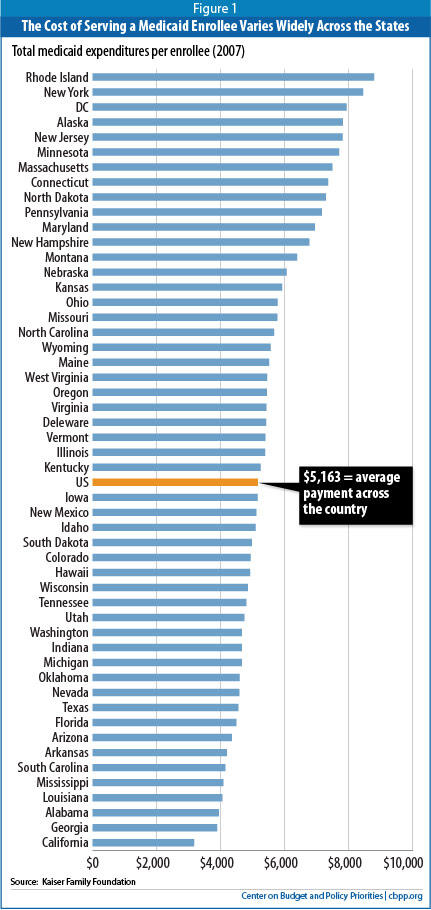
Some states spend considerably less on Medicaid on a per-beneficiary basis than other states (see Figure 1 on page 3). In fiscal year 2007, the five lowest-spending states (California, Georgia, Alabama, Louisiana, and Mississippi) expended $3,828 per beneficiary, on average, according to the Kaiser Commission on Medicaid and the Uninsured; the five highest-spending states (Rhode Island, New York, the District of Columbia, Alaska, and New Jersey) spent $8,161.[9] (It is important to note that a state’s per-beneficiary costs, relative to other states, can change significantly over time, as explained below.) Factors driving these state-by-state differences include:
- State differences in overall health care costs and utilization. Certain states tend to have lower (or higher) health care costs than others, with these variations being reflected in substantial cost differentials both in public programs like Medicare and Medicaid and in private insurance. The differentials may reflect differences in health care treatment and utilization practices, in the amounts that health care providers charge, and in the degree of competition among providers and insurers.
For example, the average premium in 2009 in the five states with the highest premiums for employer-sponsored insurance (Massachusetts, Wisconsin, Vermont, Wyoming, and the District of Columbia) was $14,496, while the average premium in the five states with the lowest premiums (Arkansas, Montana, Oklahoma, North Dakota and South Dakota) stood at $11,387. [10]
In a similar vein, research from the Dartmouth Atlas of Health Care has found that in 2007, average Medicare expenditures per beneficiary ranged from $6,314 in the five lowest-cost states (Hawaii, North Dakota, Idaho, Wyoming, and Montana) to $9,878 in the five highest-cost states (New Jersey, Texas, New York, Florida, and Louisiana).[11]
- Provider reimbursement rates. States have flexibility in how they set reimbursement rates for health care providers and managed care plans serving Medicaid beneficiaries; these payment rates vary considerably. In 2008, for example, Alaska’s physician payment rates were twice the national average, while rates in New Jersey and Rhode Island were less than 60 percent of the national average. [12] In some states, overly low provider rates can create access problems for beneficiaries by leading to a shortage of participating providers, particularly specialist physicians.
- Benefits. Per-beneficiary cost differences among states also reflect differences in the degree to which states cover “optional” benefits and services. These include case management, physical and other therapy services, durable medical equipment, vision and dental services, the extent of home and community-based services, respiratory care, hospice care, and prescription drugs. [13] Nationally, about 30 percent of Medicaid spending is for such benefits and services.[14]
- Beneficiary mix. Some states have a mix of beneficiaries that is less (or more) costly than other states, the product not only of states’ varying eligibility rules (as noted above) but also of their varying demographic characteristics.
In particular, states with larger shares of seniors and people with disabilities tend to have higher average per-beneficiary costs: such individuals constitute just one-quarter of Medicaid beneficiaries nationally but account for two-thirds of all Medicaid expenditures both because of their greater health care needs and because Medicaid is the primary funder of long-term care services, particularly nursing home care. In 2007, average Medicaid spending per beneficiary was $12,499 for seniors and $14,481 for persons with disabilities, compared to just $2,135 for children and $2,541 for non-disabled, non-elderly adults.[15]
In 2007, the share of the Medicaid caseload consisting of seniors ranged from an average of 15 percent in the five highest states (Maine, Wisconsin, New Jersey, Florida, and Alabama) to 7 percent in the five lowest states (Utah, Arizona, New Mexico, Alaska, and Wyoming). [16]
Similarly, people with disabilities accounted for an average of 26 percent of Medicaid beneficiaries in the five highest states (Massachusetts, West Virginia, Kentucky, Pennsylvania, and Alabama) but just 11 percent in the five lowest states (California, Arizona, New Mexico, Hawaii, and Delaware). [17]
In part because of differences in the beneficiary mix, the share of total state Medicaid expenditures going to long-term-care services and supports, rather than acute care, varies enormously — from 64 percent in North Dakota to 24 percent in Michigan. [18]
- Adoption of cost-containment strategies. Some states have been more aggressive in implementing effective cost-containment strategies that lower costs per beneficiary. Such strategies include: (1) use of managed care; (2) instituting efficiencies in prescription drug coverage by negotiating greater discounts with drug manufacturers, setting more cost-effective pharmacy reimbursement rates, and managing the care of people with chronic illnesses who require extensive use of prescription medications; and (3) experimenting with delivery system reforms like medical homes and pay-for-performance for a state’s fee-for-service providers and managed care plans.
Lower-Spending States Would Get Smaller Block Grants
Under a block grant, states that have not expanded their Medicaid programs to include certain optional categories of adults, seniors, and people with disabilities would receive smaller allotments because their current spending level will not reflect the costs of serving those individuals. Similarly, states that now cover a narrower range of optional services would receive a smaller block grant than other states. In addition, states with lower provider reimbursement rates than other states would effectively have those lower rates built into their block grant allocations. Such states would be essentially foreclosed from improving provider participation and beneficiary access to needed care.
For higher-cost states, their relatively higher spending would be locked into the block grant allotments, which may advantage them over the short term relative to other states. They would be as likely as lower-cost states, however, to experience Medicaid expenditure growth in coming years that significantly exceeds the rate at which their block grant allocation would increase.
Block Grant Would Produce Disparate, Harmful Effects for States Over Time
As noted, converting Medicaid into a block grant is intended to produce federal budgetary savings over time by giving states less federal funding each year than the current financing system would, with the disparity growing over time. Block grant proposals typically accomplish this by increasing aggregate federal payments each year at a rate well below the baseline growth rate for federal Medicaid funding, which reflects growth in health care costs throughout the U.S. health care system, the aging of the population, and expected enrollment growth as the size of the U.S. population increases. Over time, such a block-grant structure would sharply reduce federal funding relative to the current financing structure, irrespective of the specific formula used to allocate individual states’ shares of the national block grant amount.
The effects of these growing reductions in coming years would not, however, be evenly distributed across the states. That is because Medicaid growth rates will vary significantly across states (as well as within a state) over time.
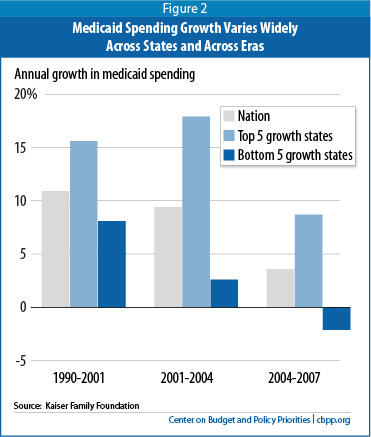
- From 2001 to 2004, the five states with the highest Medicaid expenditure growth (Arizona, Georgia, Nevada, Alaska, and Maine) experienced average annual increases of 18 percent, compared to 3 percent among the five states with the slowest growth (Oregon, Kansas, Wisconsin, New Jersey, and Michigan). Oregon, the state with the slowest growth over this period, had one of the highest growth rates in the previous decade.
- Between 2004 and 2007, the five states with the highest spending growth (Arizona, Oklahoma, Texas, Virginia, and Delaware) had average annual increases of 9 percent. In contrast, the average annual growth rate was negative 2 percent among the five states with the lowest growth rates (Georgia, Mississippi, Maine, New Hampshire, and Tennessee). [19] Georgia, the state with the slowest growth over this period, had one of the highest growth rates in the previous three-year period (see Figure 2).
Numerous factors contribute to changes in a state’s level of Medicaid expenditures over time and ultimately would determine how a particular state would fare under a block grant relative both to other states and to the current Medicaid financing structure. Key factors include the state-specific effects of recessions (which would affect growth in states’ Medicaid enrollment), differences across states in overall health care cost and utilization growth, the aging of the state’s population, and other factors that affect the rate of growth in per-beneficiary costs.
Enrollment Growth Rates
The growth rate in a state’s Medicaid enrollment depends on a number of factors, including its eligibility rules and enrollment and renewal procedures, its population growth and other demographic factors, changes in economic conditions, and policy changes. For example, when people lose their jobs and access to employer-sponsored insurance during a recession, many become eligible for and enroll in Medicaid. According to modeling by the Urban Institute, a one percentage-point increase in the national unemployment rate results in a 1 million person increase in Medicaid enrollment among children and non-elderly adults.[20]
Enrollment growth rates among individual states varied considerably during the recent downturn, ranging from an average of 33 percent between 2007 and 2009 in the five states with the fastest growth (Wisconsin, Maryland, Nevada, Colorado, and Florida) to just 3 percent in the five states with the slowest growth (Tennessee, Rhode Island, Maine, Arkansas, and South Carolina). [21]
States may also see enrollment increases due to natural disasters or other local events. New York experienced an increase in Medicaid enrollment of about 360,000 between 2000 and 2001; the overwhelming contributor appears to have been enrollment after the 9/11 terrorist attacks in New York City. [22] Similarly, Louisiana and neighboring states experienced Medicaid enrollment increases related to Hurricane Katrina.
Per-Beneficiary Cost Growth
Growth in per-beneficiary Medicaid costs also varies significantly by state. Between 2001 and 2008, per beneficiary costs rose 7 percent per year, on average, in the five states with the highest cost growth (Delaware, New Mexico, Tennessee, Mississippi, and Missouri), while falling 0.2 percent per year in the five states with the slowest growth (Wisconsin, North Dakota, Michigan, Illinois, and New York). [23]
Block Grant Would Disproportionately Shift the Costs of Health Reform’s Medicaid Expansion to Certain States
Under the Affordable Care Act, state Medicaid programs will be required to cover all non-elderly individuals up to 133 percent of the poverty line ($24,700 for a family of three) starting in 2014. The federal government will pick up the vast majority of states’ costs in covering newly-eligible categories of beneficiaries — 96 percent of those costs through 2019, according to CBO estimates, and no less than 90 percent thereafter. As a result of this expansion, CBO expects that by 2019, some 16 million more people will be enrolled in Medicaid than would have been the case under prior law, but the costs borne by the states themselves will be only 1.25 percent higher than in the absence of health reform. The Medicaid expansion is one of the main reasons why CBO expects the Affordable Care Act to reduce the number of uninsured people by an estimated 32 million by 2019.
Since overall federal Medicaid funding would be substantially lower under a block grant than under the current funding structure, the federal government would pay for substantially less of the cost of the Medicaid expansion. Moreover, because block-grant proposals typically give states much greater flexibility regarding Medicaid eligibility, it is difficult to see how the federal government could still require states to institute the Medicaid expansion in the health reform law.
If a block grant were instituted and the Medicaid expansion were still required, states almost certainly would have to bear a greater share of the cost and some states would face particularly large increases. A number of states currently cover parents only up to very low income limits and do not cover non-disabled adults without children at all. Such states would have to expand their programs to a much greater degree than other states to comply with the Affordable Care Act’s requirement to extend Medicaid coverage to non-elderly people with incomes up to 133 percent of the poverty line. It is likely that under a block grant structure that maintained the ACA’s Medicaid expansion, the increase in costs that states would have to bear would be significantly greater in these states than in states that have already expanded Medicaid eligibility for parents and/or childless adults.
Such variation can reflect a number of factors, with differences in the rate of growth in the overall cost of health care services and in health care utilization across states being a critical factor. Policy changes affecting benefit packages and provider reimbursement rates also play a role. Another factor, which will assume increasing importance in the future, is changes in the demographic mix of Medicaid beneficiaries. As noted, seniors and people with disabilities incur significantly greater costs because of their greater needs for medical and long-term care service and supports.
The Census Bureau forecasts that between 2000 and 2030, the senior population will increase by an average of 223 percent in the five states with the largest such increases (Nevada, Alaska, Arizona, Florida, and New Mexico), while declining by 17 percent in the District of Columbia. [24]
While projected changes in the incidence of disability across states are not readily available, there is wide variation among disability rates as a proportion of a state’s population. In the five states with the highest proportion of residents who are on SSI and thus categorically eligible for Medicaid (West Virginia, Kentucky, Mississippi, the District of Columbia, and Louisiana), an average of 4 percent of residents receive SSI benefits. By comparison, an average of only 1 percent of state residents receives SSI in the five states with the lowest SSI enrollment as a proportion of the population (Utah, Wyoming, Colorado, New Hampshire, and North Dakota). [25]
Similarly, while projected changes in the incidence of chronic diseases across states are not readily available, there is wide variation among states in the prevalence of people with diabetes, cancer, and Alzheimer’s disease.
- In the top five states in 2009 (West Virginia, Alabama, Mississippi, Kentucky, and Louisiana), 12 percent of adults had been informed by their doctor that they had diabetes. The rate was 6 percent in the bottom five states (Colorado, Alaska, Utah, Vermont, and Minnesota). [26]
- Similarly, the incidence of cancer (adjusted for age) was 518 cases per 100,000 people in the top five states in 2006 (Maine, Delaware, Vermont, Connecticut, and New Jersey), compared to 407 cases per 100,000 people in the bottom five states (New Mexico, Utah, South Dakota, Colorado, and Hawaii).[27]
- Alzheimer’s disease is nearly three times more prevalent in Washington, North Dakota, Tennessee, Louisiana, and South Carolina (38 deaths per 100,000 people) than in New York, Nevada, Hawaii, New Mexico, and Maryland (13.3 deaths per 100,000 people). [28]
Finally, certain states may experience the disproportionate impact of a new disease or condition. For example, in the 1980s and 1990s, California had a disproportionate share of people with HIV/AIDS; the number of new cases of HIV in California more than doubled over one 12-month span between 1992 and 1993.[29]
Block grants are ill-equipped to deal with such developments and to enable states to respond to them effectively.
Previous Block Grant Proposal Would Have Had Widely Disparate Impacts on States
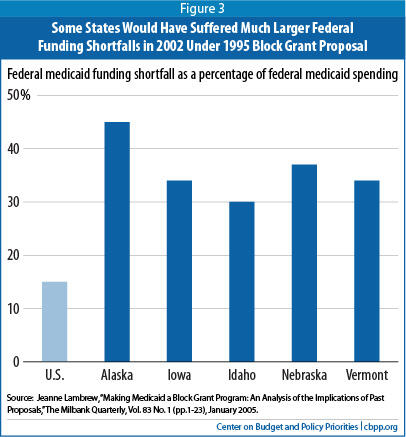
The five states that would have faced the largest reductions in federal funding in 2002 would have lost an average of 36 percent of their funding. At the same time, two states would have gotten more funding under the block grant than they actually received. [30] (See Figure 3.)
Effects of Inadequate Federal Funding Especially Sharp in Poorer States
The financial risks that a block grant would pose would be especially great for poorer states, because the federal government now pays a larger share of their Medicaid costs. In a relatively affluent state that now has a 50 percent federal matching rate, the federal government pays $1 of every $2 in state Medicaid expenditures. Hence, under a block grant, such a state would lose $1 in federal Medicaid funding for each $2 that its Medicaid costs increased (beyond the amount the block grant covered). In contrast, in a poorer state that now has a federal Medicaid matching rate of 75 percent, the state would lose $1.50 in federal funds for every $2 that its Medicaid costs rose above the amount the block grant covered. States would have to make up for these losses of federal funds either by coming up with additional state funds or cutting their Medicaid programs.
Could the Block Grant Formula Be Fixed to Limit the Adverse Distributional Effects?
Because proposals to convert Medicaid into a block grant are intended to produce substantial federal budget savings, all states would face increasingly inadequate federal funding over time and likely have to institute painful cuts, but some states would fare considerably worse than others. [31] As noted, the most harshly affected states likely would include those that currently have relatively low Medicaid expenditures, those that will experience faster-than-average cost growth in coming years, and those that receive high federal Medicaid matching rates under the current financing structure.
In theory, efforts could be made to design the formula for allocating state block grant amounts to take into account some states’ low current expenditure rates and to raise their block grant amounts to some degree. The annual adjustments to each state’s block grant amount also could, in theory, try to take into account expected higher expenditure growth due to some state-specific factors. In practice, however, it is extremely difficult to design accurate and equitable ways to do this.
Moreover, other states almost certainly would vigorously oppose such changes. If overall federal Medicaid funding is subject to an annual cap, any increases in funding for some states will have to be offset by deeper cuts for other states.
The inevitable “formula fight” that would ensue is one of the reasons that previous block-proposals were not enacted. Another key reason is that no formula can do as well as the current financing system in adjusting automatically and promptly for the various factors that determine a state’s Medicaid costs in a given year and for changes in those costs from year to year. By paying a fixed percentage of each state’s costs, the federal government now responds automatically and immediately to these various factors.
Conclusion
Converting Medicaid to a block grant at funding levels that fall steadily farther below what the federal government would otherwise provide would leave states “holding the bag” — they would face federal funding that becomes increasingly inadequate over time. States would either have to contribute more in state funding by raising taxes or cutting other programs or exercise the broader programmatic flexibility that a block grant would give them to institute wide-ranging, and in many cases damaging, cuts that affect eligibility, benefits, and/or provider reimbursement rates. The end result almost certainly would be increases in the ranks of the uninsured and underinsured.
A block grant also would deepen state budget holes sharply during recessions, forcing even larger state budget cuts or tax increases in those periods and thereby further slowing state economies and making the loss of jobs still greater.
Some states would fare substantially worse than others. Those that now have relatively low medical expenditures and those that experience faster cost growth due to economic and demographic changes, overall health care cost increases, or other factors largely beyond their control would face particular adversity.
End Notes
[1] A proposal offered by Representative Paul Ryan (R-WI) and Alice Rivlin to the President’s fiscal commission. Congressional Budget Office, “Letter from Douglas W. Elmendorf to the Honorable Paul D. Ryan,” November 17, 2010. See also Alice Rivlin and Paul Ryan, “A Long-Term Plan for Medicare and Medicaid,” November 17, 2010 available at http://paulryan.house.gov/UploadedFiles/rivlinryan.pdf.
[2] See Edwin Park and Matt Broaddus, “Medicaid Block Grant Would Shift Financial Risks and Costs to States,” Center on Budget and Policy Priorities, February 23, 2011. See also Edwin Park, “Medicaid Block Grant or Funding Caps Would Shift Costs to States, Beneficiaries and Providers,” Center on Budget and Policy Priorities, January 6, 2011.
[3] CBPP calculations based on CMS and Census data.
[4] In addition, in Minnesota, parents with incomes between 215 percent and 275 percent of the poverty line are eligible for more limited Medicaid benefits. Martha Heberlein, Tricia Brooks, Jocelyn Guyer, Samantha Artiga and Jessica Stephens, “Holding Steady, Looking Ahead: Annual Findings Of A 50?State Survey Of Eligibility Rules, Enrollment And Renewal Procedures, And Cost Sharing Practices In Medicaid and CHIP, 2010?2011,” Kaiser Commission on Medicaid and the Uninsured, January 2011.
[5] Kaiser Commission on Medicaid and the Uninsured, “Medicaid Financial Eligibility: Primary Pathways for the Elderly and People with Disabilities,” February 2010. Nationally, just under one-third of Medicare beneficiaries are “optional,” meaning that federal law does not require states to cover them. See Kaiser Commission on Medicaid and the Uninsured, “Medicaid: An Overview of Spending on ‘Mandatory’ vs. ‘Optional’ Populations and Services,” June 2005.
[6] Kaiser Family Foundation analysis of MEPS data. Table available at http://www.statehealthfacts.org/comparetable.jsp?ind=175&cat=3 .
[7] CBPP analysis of Census data.
[8] Genevieve Kenney, Victoria Lynch, Allison Cook, and Samantha Phong, “Who and Where Are the Children Yet to Enroll in Medicaid and the Children’s Health Insurance Program?” Health Affairs, October 2010. Table available at http://www.statehealthfacts.org/comparemaptable.jsp?ind=868&cat=4 .
[9] CBPP analysis of Urban Institute and Kaiser Commission on Medicaid and the Uninsured estimates based on CMS data. Table available at http://www.statehealthfacts.org/comparemaptable.jsp?ind=183&cat=4 .
[10] Kaiser Family Foundation analysis of MEPS data. Table available at http://www.statehealthfacts.org/comparetable.jsp?typ=4&ind=271&cat=5&sub=67 .
[11] Dartmouth Atlas of Health Care (includes spending related to Medicare Part A and Part B but not Medicare Part D).
[12] Stephen Zuckerman, Aimee Williams, and Karen Stockley, “Medicaid Physician Fees Grew By More Than 15 Percent From 2003 to 2008, Narrowing Gap With Medicare Physician Payment Rates,” Health Affairs, April 2009. Table available at http://www.statehealthfacts.org/comparetable.jsp?ind=195&cat=4 .
[13] Starting in 2006, low-income Medicare beneficiaries also on Medicaid became eligible for prescription drug coverage through the Medicare program rather than through Medicaid, which lowered states’ prescription drug costs.
[14] Kaiser Commission on Medicaid and the Uninsured, “Medicaid: An Overview of Spending on ‘Mandatory’ vs. ‘Optional’ Populations and Services,” op. cit.
[15] Ibid.
[16] Ibid.
[17] Ibid.
[18] The cost of long-term-care services and supports, however, tends to grow more slowly than the cost of acute care services. CBPP analysis of Urban Institute and Kaiser Commission on Medicaid and the Uninsured estimates based on CMS data. Table available at http://www.statehealthfacts.org/comparetable.jsp?ind=178&cat=4 .
[19] CBPP analysis of Urban Institute and Kaiser Commission on Medicaid and the Uninsured estimates based on CMS data. Table available at http://www.statehealthfacts.org/comparetable.jsp?ind=181&cat=4 .
[20] It also results in a little more than 1 million person increase in the number of uninsured. John Holahan and A. Bowen Garrett, “Rising Unemployment, Medicaid and the Uninsured,” Kaiser Commission on Medicaid and the Uninsured, January 2009.
[21] CBPP calculations based on Medicaid enrollment data from the Kaiser Commission on Medicaid and the Uninsured.
[22] Kathryn Haslanger, “Radical Simplification: Disaster Relief Medicaid in New York City,” Health Affairs, January 2003.
[23] CBPP analysis of CMS-64 data.
[24] U.S. Census Bureau, “Table 4: Interim Projections: Change in Total Population and Population 65 and Older, by State: 2000-2030,” April 21, 2005.
[25] Kaiser Family Foundation analysis of SSA and Census data. Table available at http://www.statehealthfacts.org/comparemaptable.jsp?ind=254&cat=4 .
[26] Kaiser Family Foundation analysis of CDC data. Table available at http://www.statehealthfacts.org/comparemaptable.jsp?ind=70&cat=2 .
[27] Data is not available for Arizona and Wisconsin. Kaiser Family Foundation analysis of CDC data. Table available at http://www.statehealthfacts.org/comparemaptable.jsp?ind=64&cat=2 .
[28] Kaiser Family Foundation analysis of CDC data. Table available at http://www.statehealthfacts.org/comparemaptable.jsp?ind=63&cat=2 .
[29] Cindy Mann and Joan Alker, “Federal Medicaid Waiver Financing: Issues for California,” Kaiser Commission on Medicaid and the Uninsured, July 2004.
[30] Jeanne Lambrew, “Making Medicaid a Block Grant Program: An Analysis of the Implications of Past Proposals,” The Milbank Quarterly, Vol. 83 No. 1 (pp.1-23), January 2005.
[31] Edwin Park and Matt Broaddus, op. cit.
More from the Authors

Areas of Expertise