Food Stamp Benefits Steadily Eroding in Value
Food stamp benefits average only about $1 per person per meal, and as a result of benefit cuts enacted in the 1996 welfare law, the purchasing power of most households’ food stamp benefits is eroding in value each year.
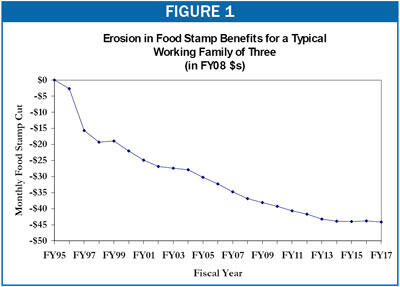
- In 2008, a typical working parent with two children will receive about $37 less in food stamps each month than they would have without the 1996 welfare law’s across-the-board benefit cuts.
- By 2017, the average benefit reduction from those provisions will reach almost $45 a month (in 2008 dollars). In fact, by 2017 the benefit cuts will cost a typical working parent of two the equivalent of more than one and a half months’ worth of food stamps each year.
The bulk of the benefit loss caused by the welfare law, and the cut that deepens with each passing year, is from a freeze in the “standard deduction.” Similar to income tax rules, food stamp rules allow households to subtract a standard deduction from their income to reflect the cost of non-food essentials such as housing and transportation. Prior to 1996, the standard deduction was indexed each year to account for inflation, since basic living expenses rise with inflation. The welfare law, however, froze the standard deduction permanently. This causes a deeper cut in benefits with each passing year, for most households. The welfare law also reduced the maximum food stamp benefit level by 3 percent (which results in a benefit cut of more than three percent for most food stamp households).
Almost every food stamp household is affected by the welfare law’s benefit cuts, but the cuts target the deepest cuts on working households that have high housing expenses in relation to their income. The attached table shows the total amount of the benefit cut by state.
2002 Farm Bill Provided a Fix, But Only for Larger Households
In the 2002 Farm Bill, Congress changed the standard deduction from a flat $134 for all households to 8.31 percent of the federal poverty income guidelines. This helped larger households (since the poverty guidelines are higher for larger households), raising their benefit levels and stopping the erosion of their benefits.
But the 2002 change has had no effect thus far on households with three or fewer members, a group that makes up three-quarters of all food stamp households. For these households, the standard deduction is scheduled to remain frozen at $134 for another 7 to 31 years.
What Can Be Done?
The 2007 Farm Bill gives Congress an opportunity to address this matter and improve the adequacy of food stamp benefits for the nation’s neediest families. For a cost of roughly $9 billion over five years, Congress could restore the standard deduction to its pre-1996 level for all household sizes. This level of resources is not likely to be available in the 2007 Farm Bill, but there are two other approaches that would partially restore the standard deduction at a substantially lower cost:
- Index the standard deduction for households of three or fewer members to inflation. This would cost about $1.3 billion over five years. These smaller households would not regain any of the ground lost since 1996, but the real value of their food stamp benefits would stop deteriorating further with each passing year. Benefits for households of four or more would be unchanged.
- Raise the standard deduction from 8.31 percent of the poverty line to 10 percent, as the Administration and a bipartisan group of senators proposed in 2002. This change, which would cost about $2 billion over five years, would increase benefits right away for three-person households. And because the change would also help larger families, which tend to be poorer than smaller ones, it is more progressive than the first option. Under this approach, however, the erosion in food stamp benefits would not end until 2016 for two-person households and until 2030 for one-person households.
| Number of People Affected and Benefits Lost Due to the Erosion of the Standard Deduction Since the 1996 Welfare Bill | ||||
| Average Monthly # of People Affected (in 000s) | Benefits Lost (in $ millions) | |||
|---|---|---|---|---|
| FY08 | FY08 | FY08-12 | FY08-17 | |
| Alabama | 363 | $35 | $196 | $460 |
| Alaska | 42 | $5 | $28 | $66 |
| Arizona | 315 | $29 | $161 | $379 |
| Arkansas | 246 | $23 | $131 | $307 |
| California | 1,465 | $125 | $702 | $1,656 |
| Colorado | 130 | $13 | $75 | $179 |
| Connecticut | 131 | $16 | $89 | $213 |
| Delaware | 40 | $4 | $22 | $51 |
| District of Columbia | 56 | $6 | $32 | $75 |
| Florida | 845 | $97 | $549 | $1,304 |
| Georgia | 578 | $56 | $313 | $737 |
| Hawaii | 82 | $13 | $76 | $182 |
| Idaho | 56 | $6 | $33 | $77 |
| Illinois | 667 | $73 | $414 | $980 |
| Indiana | 362 | $36 | $201 | $472 |
| Iowa | 136 | $14 | $78 | $183 |
| Kansas | 120 | $13 | $74 | $174 |
| Kentucky | 407 | $43 | $242 | $569 |
| Louisiana | 446 | $45 | $251 | $592 |
| Maine | 108 | $13 | $75 | $177 |
| Maryland | 188 | $21 | $117 | $277 |
| Massachusetts | 282 | $30 | $170 | $403 |
| Michigan | 699 | $65 | $368 | $864 |
| Minnesota | 214 | $28 | $158 | $376 |
| Mississippi | 245 | $21 | $118 | $276 |
| Missouri | 477 | $47 | $261 | $611 |
| Montana | 53 | $5 | $31 | $72 |
| Nebraska | 74 | $8 | $43 | $102 |
| Nevada | 79 | $9 | $50 | $118 |
| New Hampshire | 40 | $4 | $25 | $59 |
| New Jersey | 296 | $32 | $179 | $425 |
| New Mexico | 173 | $16 | $87 | $204 |
| New York | 1,251 | $115 | $651 | $1,554 |
| North Carolina | 505 | $53 | $299 | $702 |
| North Dakota | 28 | $3 | $17 | $39 |
| Ohio | 612 | $66 | $370 | $875 |
| Oklahoma | 261 | $25 | $140 | $327 |
| Oregon | 272 | $31 | $173 | $408 |
| Pennsylvania | 699 | $74 | $414 | $978 |
| Rhode Island | 61 | $5 | $30 | $71 |
| South Carolina | 337 | $30 | $168 | $393 |
| South Dakota | 30 | $3 | $17 | $41 |
| Tennessee | 533 | $53 | $297 | $700 |
| Texas | 1,578 | $135 | $756 | $1,769 |
| Utah | 83 | $8 | $42 | $99 |
| Vermont | 33 | $4 | $22 | $51 |
| Virginia | 341 | $36 | $202 | $475 |
| Washington | 369 | $33 | $187 | $443 |
| West Virginia | 189 | $20 | $112 | $262 |
| Wisconsin | 212 | $19 | $107 | $250 |
| Wyoming | 17 | $2 | $10 | $23 |
| Guam | 8 | $1 | $7 | $15 |
| Virgin Islands | 7 | $0 | $2 | $6 |
| Total | 16,840 | $1,665 | $9,370 | $22,097 |
| Estimates based on the Congressional Budget Office (CBO) March 2007 baseline and the 2005 Food Stamp Quality Control data. | ||||