The Relationships Among SNAP Benefits, Grocery Spending, Diet Quality, and the Adequacy of Low-Income Families’ Resources
Supporting households’ access to nutritious foods in adequate amounts has long been the primary goal of the Supplemental Nutritional Assistance Program (SNAP), which now assists about 45 million people. Despite SNAP’s reach, questions remain about the adequacy of the resources that low-income households devote to food. In this analysis we find:
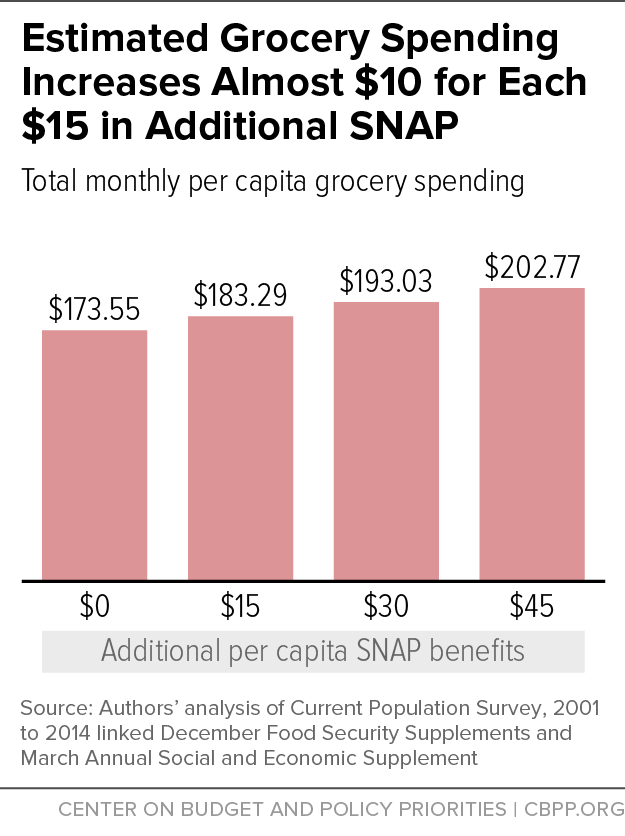
- An additional $30 per capita of monthly SNAP benefits raises food spending by $19.48 per capita per month among SNAP recipients.
- An additional $19.48 per capita per month in spending on food is associated with increases in the purchase of more nutritious foods and in time spent shopping for and preparing food, as well as with lower food insecurity among SNAP recipients.
- On average, low-income families report that to adequately meet food needs, they would need to spend an additional $4-$9 per capita weekly.
- Food insecurity and the amount of additional resources that low-income households say they need to meet food needs vary with household characteristics. For example, households of similar size are more likely to be food insecure and report needing more resources for food if the children are teenagers than if they are younger children.
Introduction
Food insecurity is common among low-income families in the United States.[2] In 2014, 34 percent of households with income under 185 percent of the poverty line were food insecure, as were almost 40 percent of households below the poverty line.[3] Food insecurity is defined by the U.S. Department of Agriculture (USDA) as “limited or uncertain availability of nutritionally adequate and safe foods or limited or uncertain ability to acquire acceptable foods in socially acceptable ways.”[4]
To measure the rate of food insecurity in the population, the U.S. Census Bureau employs a ten-item interview (18 items for households with children) that starts by asking households if they agree with such statements as “the food that we bought just didn’t last and we didn’t have money to buy more” and “we couldn’t afford to eat balanced meals,” and progresses to questions such as “did you or other adults in your household ever not eat for a whole day because there wasn’t enough money for food?” and “were the children ever hungry, but you just could not afford more food?”[5] Affirmative responses to three or more items will classify a household as food insecure, which encompasses both low food security and very low food security. Low food security is defined by the USDA as when “households reduced the quality, variety, and desirability of their diets, but the quantity of food intake and normal eating patterns were not substantially disrupted.”[6] To be classified as having very low food security, defined as when “eating patterns of one or more household members were disrupted and food intake reduced,” households must have a much higher number of affirmative responses.[7]
Given this definition of low food security, a key element of understanding the adequacy of low-income families’ food resources is examining the quality of their diets, and thus asking whether increasing their resources would increase not only the quantity of food but also its nutritional quality. A significant way to increase low-income families’ food resources is through the Supplemental Nutrition Assistance Program (SNAP), which has been shown to reduce rates of food insecurity, especially among children and among households suffering from very low food security.[8]
While many studies have estimated the role of a dollar more in SNAP benefits on spending for groceries, much less is known about its impact on diet quality. Answering this question is not entirely straightforward outside of an experimental setting, since households make decisions about whether to apply for SNAP based on unobserved aspects of their preferences for food and access to additional resources. Similarly, a household’s food choices are made within the constraints of its current resources, and again are based on unobserved preferences. Our approach is necessarily observational, but we can predict how the ability to spend more money on food could affect dietary quality if we assume that the food choices of households that spend slightly more on groceries (that is, food bought at stores) are a good predictor of how households with slightly lower spending on groceries would behave if their resources were to increase.
In this paper, then, we first use the observed correlation between SNAP benefits and spending on groceries by SNAP recipients to predict how spending might increase in the presence of higher benefits. Next, we use observed correlations between grocery spending by SNAP recipients and diet quality to predict how higher spending might increase diet quality. Additionally, we look at the effect of higher SNAP benefits on related outcomes, such as time spent on food preparation and food shopping. To support our main analysis we also document that grocery spending is positively related to income and negatively related to food insecurity, and that lower-income households and food-insecure households report a desire to spend more on groceries. Additionally, we find that many of the same household characteristics that are associated with a higher probability of households being food insecure also are associated with households reporting that they require more additional spending to cover their food needs.
Higher SNAP Benefits Predict More Groceries, Better Nutrition
Based on a sample of SNAP recipients in linked December-March Current Population Surveys (CPS), we observe that per capita spending on groceries is about 65 cents higher for households with an additional dollar in per capita monthly SNAP benefits, controlling for household characteristics and year in a regression framework. We use this result to predict that each additional $30 in real per capita SNAP benefits would increase spending on groceries by $19.48.
We can predict that increasing spending on groceries by $19.48 would increase consumption of healthier foods.Similarly, using a sample of SNAP recipients in the National Health and Nutrition Examination Survey (NHANES), which allows us to observe the relationship between per capita grocery spending and a range of food and nutrition outcomes, we can predict that increasing spending on groceries by $19.48 would increase consumption of healthier foods. Most notably, consumption of tomatoes and yellow vegetables would increase by almost 3 percent and green vegetables by just over 2 percent, while consumption of fast food would fall by over 2.5 percent, with all but green vegetables based on statistically significant relationships in the data. At the same time, while the changes are mostly not statistically significant, consumption of beef and pork is predicted to decline by almost 1 percent while consumption of fish and poultry increases by a similar amount. Finally, there are statistically significant increases of just below 3 percent in time spent on food preparation and just over 3 percent in time spent on food shopping, and a statistically significant drop of 0.7 percent in the probability of being food insecure.
The Effect of SNAP Benefit Levels on Grocery Spending
We start our investigation into how an increase in SNAP benefits might affect nutritional outcomes by estimating the relationship between benefit levels and spending on groceries among SNAP households. Since SNAP can be spent only on food, by definition a dollar in SNAP benefits will be spent on a dollar of groceries. However, this does not mean that an extra dollar of SNAP benefits will result in an extra dollar of grocery spending, since the SNAP benefits can free up household income that previously went to groceries for spending on other needs.
To investigate how grocery spending varies with SNAP benefits and income, we regress reported spending on food bought at stores on reported SNAP benefit level for a sample of households reporting SNAP receipt in the past 30 days. All dollar values are indexed using the consumer price index (CPI) and transformed into real, monthly, per capita values. The reported grocery spending and SNAP benefit levels come from the 2001 to 2014 December Food Security Supplements of the Current Population Surveys linked to the March Annual Social and Economic Supplement of the CPS that covers that same calendar year.[9] Grocery spending is collected as dollars spent last week at supermarkets, grocery stores, warehouse clubs, convenience stores, meat markets, produce stands, bakeries, and other specialty food stores, minus any amounts spent on nonfood items at these stores, and then multiplied by 4.33 to create a monthly value.
Typical studies on the marginal propensity to consume food at home regress spending on SNAP benefits and on income (and potentially a set of demographic controls) for a sample of low-income households including both SNAP recipients and non-recipients.[10] This is not the approach taken here, for several reasons.
First, while we have available very detailed information on annual household income from the March Annual Social and Economic Supplement, average monthly income over the past year may not match well with actual income in December, especially for the types of families that are likely to be food insecure.[11] Second, we are not trying to estimate the impact of receiving SNAP benefits versus not receiving benefits, which is essentially what the standard model is attempting. Rather, we are interested in the relationship between higher benefits and grocery spending among SNAP recipients. Broadly speaking, variation in benefit levels reflects differences in the resources available to the household, for which we cannot properly control.[12] Instead, we use this variation in benefits to predict the relationship between monthly SNAP benefit levels and spending on groceries. Thus, we are able to see how an extra dollar of SNAP benefits is related to additional grocery spending. This estimated correlation shows grocery spending that is about 65 cents higher for each additional dollar of SNAP benefits.[13] Thus, as shown in Figure 1, per capita monthly grocery spending would be predicted to increase by $9.74 for every $15 in additional per capita SNAP benefits. Appendix Table 1 presents the full results from this regression.[14]
The Effect of Increased Spending on Dietary Quality and Other Outcomes
Having determined that higher SNAP benefits are associated with higher levels of grocery spending, we can now predict how this higher level of grocery spending is correlated with choices about food and nutrition, as collected in the 24-hour dietary recall interview component of the NHANES.[15] Since 2007, the NHANES has also surveyed respondents about household food spending at stores over the last 30 days, explicitly reminding them to include the value of food bought with SNAP benefits.[16] Thus, for data from 2007 through 2012 we can derive real monthly per capita spending on groceries, and then relate it to information from the dietary recall interview. In the NHANES, individual foods consumed are recorded using a detailed eight-digit USDA food code. Food groups used here are based on the first one or two digits of this code (e.g., all vegetables have a first digit of 7, while dark green vegetables start with 72). Based on a regression of a specific nutritional outcome for the household member whose food consumption is recorded (e.g., daily grams of vegetables) on real per capita grocery spending (controlling for year), we can predict the nutritional change arising from the change in grocery spending that is induced by an increase in SNAP. Using the same data, we can look at the change in the probability that the household is food insecure.[17]
Similarly, we can use American Time Use Survey (ATUS) data matched with the December CPS to relate grocery spending to time spent in food preparation and in food shopping.[18] Note that we limit ourselves to individuals who report spending at least some time in the activity, and then assume the food preparation and shopping for the entire household are done by this person, so we continue to use a per capita measure of spending on food at stores. For all of these regressions, we limit our sample to households that received SNAP within the previous 30 days. Appendix Table 2 presents the full set of regression coefficients.
We then use these results, along with those in Appendix Table 1, to simulate the impact of a $30 per capita increase in monthly SNAP benefits. Figures 2 through 5 summarize the results of this simulation exercise, while Appendix Table 3 presents the complete set of simulation results.[19] In all cases, a $30 per capita increase in monthly SNAP benefits is assumed to increase monthly spending on food at stores by $19.48 per capita (based on the results in Figure 1); then, given the relationship between per capita grocery spending and nutrition outcomes, we calculate the predicted change in a given outcome for this $19.48 change in grocery spending. Finally, we calculate a percentage change based on the mean level of each outcome, and we show these predicted percentage changes in the figures.
Starting with Figure 2, we see relatively small but at least marginally statistically significant predicted increases in consumption of milk and grains, along with a small but not statistically significant increase in fruits.[20] At the same time, there is a marginally statistically significant predicted decrease in legumes, a healthy food but one that may be considered to be an inferior good, given that it is a cheaper source of protein than most meats. Eggs, another cheaper source of protein, are predicted to have essentially no change. In Figure 3, we see a small but quite statistically significant increase overall in meat, the more expensive protein. Broken down into subtypes, we see that the increases are only in the healthier meat choices of poultry and fish, while beef and pork are actually predicted to decline. Note, however, that only the increase in poultry is even marginally statistically significant. In all cases the changes are fairly small, at 1 percent or less.
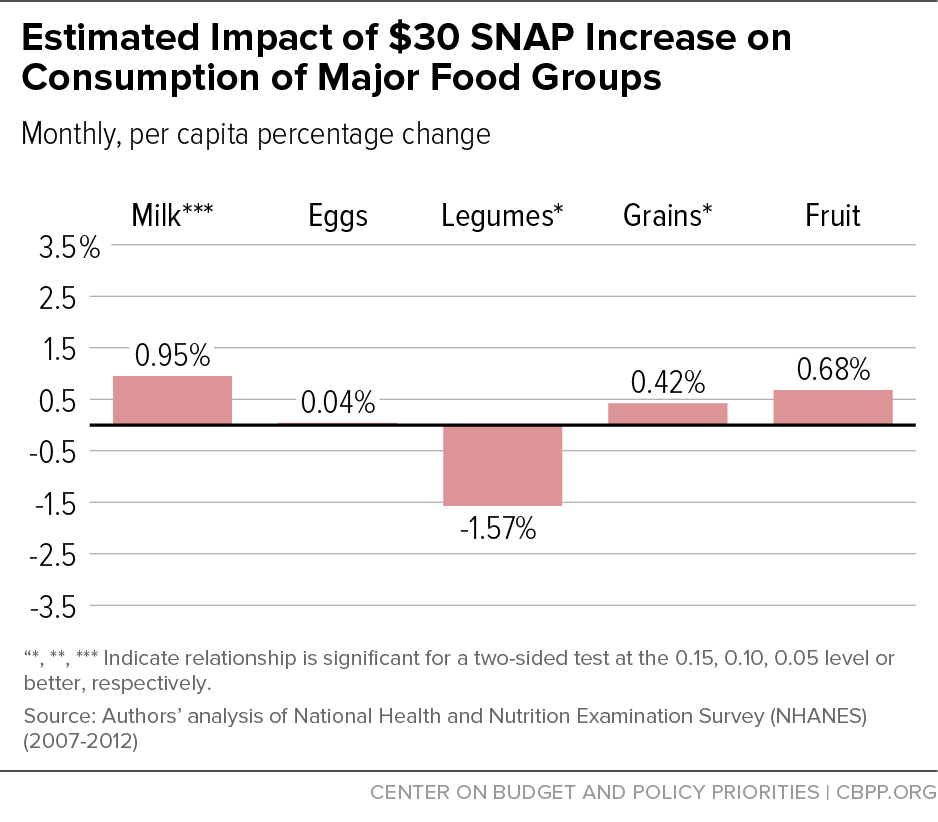
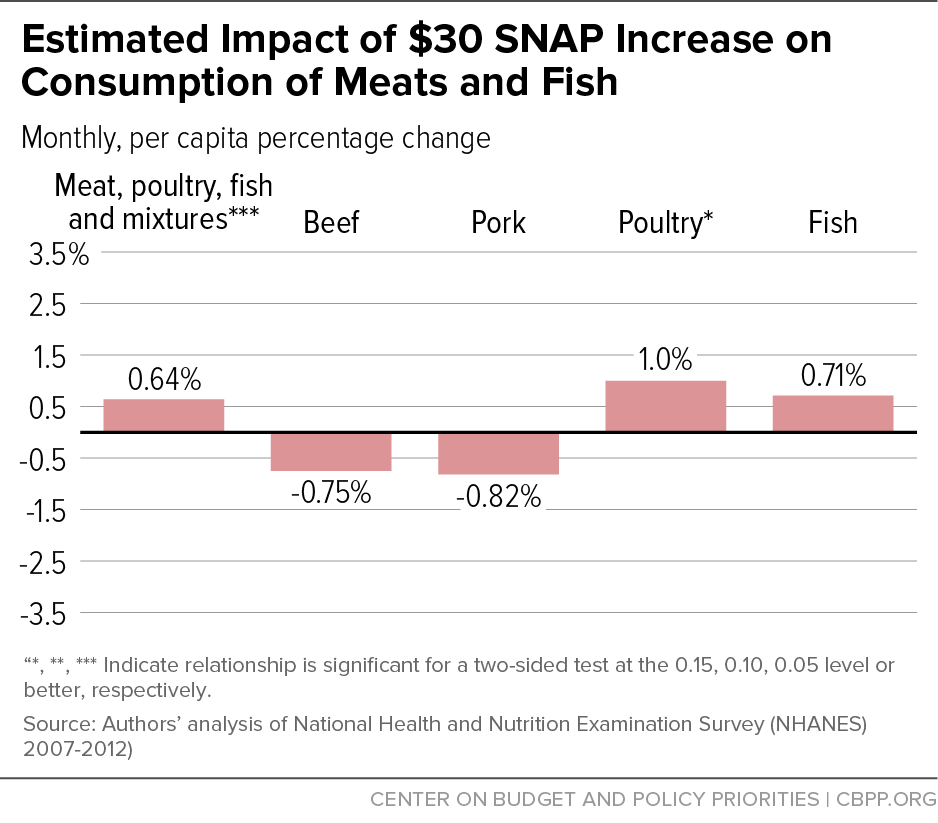
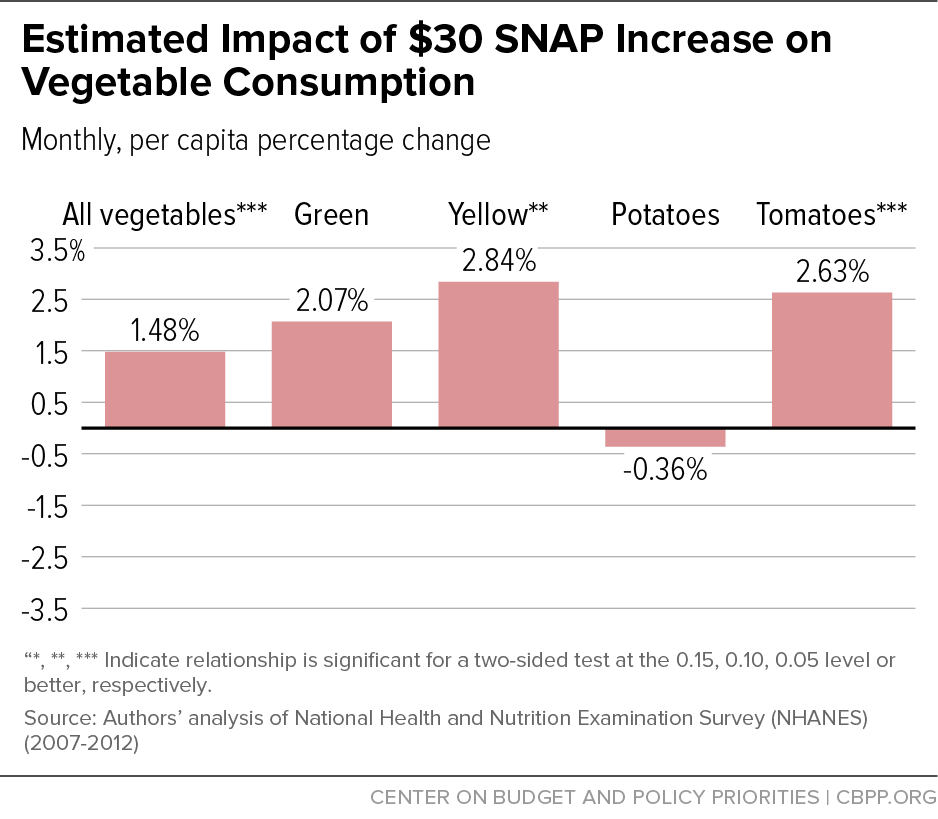
Figure 4 turns to consumption of vegetables overall and several subtypes. Here, we see a very statistically significant increase overall of 1.48 percent, with especially large and significant increases in yellow vegetables (2.84 percent) and tomatoes (2.63 percent), and a relatively large but not quite significant increase in green vegetables (2.07 percent). All of these are healthier choices than potatoes, consumption of which is predicted to decline slightly, albeit not significantly.
Finally, Figure 5 shows a range of additional outcomes, starting with a significant 2.52 percent decrease in the percent of meals that are fast food, which is consistent with the overall move toward healthier food groups seen in prior figures. We also see increases in time spent preparing and shopping for food, as might be expected for households eating less fast food. Additionally, eating more vegetables may require more time shopping, if fresh foods need to be purchased more often to avoid wastage, as well as more prep time for cleaning and chopping. Both the 2.55 percent increase in per capita minutes spent on food preparation and the 3.36 percent increase in per capita minutes spent on food shopping are significant. Recall that these are calculated based only on individuals who report spending some time in food preparation (or food shopping).
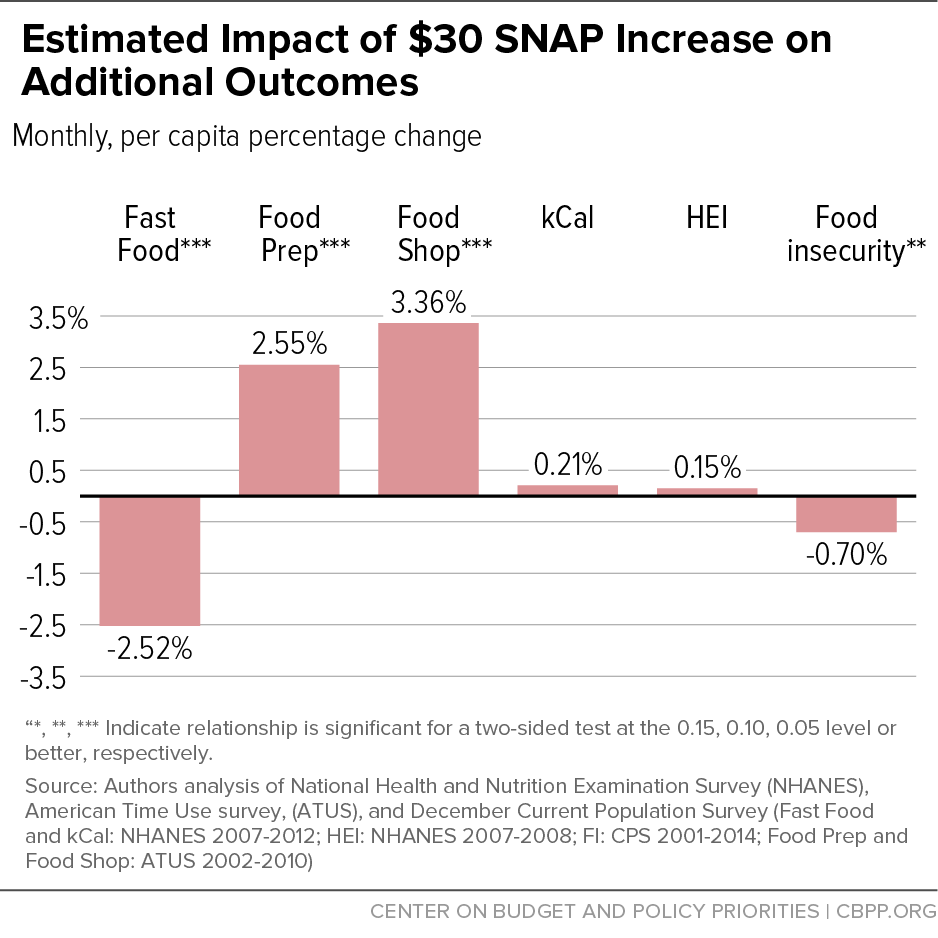
Interestingly, there are only almost imperceptible and not statistically significant changes in calories consumed and in the Healthy Eating Index (HEI).[21] Note that the HEI result is based only on data from 2007-2008, rather than the full six-year period. Finally, spending more on groceries is related to a small but statistically significant decline of almost 1 percent in the probability of being food insecure.
Comparison With Past Studies
While there are no studies attempting to measure exactly what we have measured here, Mabli et al. can provide some context to our results.[22] They investigate the effect of $26 of additional food spending using expenditure data from 2005. Note that this is equivalent to $29.95 when indexed to 2011 dollars, as all of the spending data we use are, implying that this is very similar to the $45 per capita addition to monthly SNAP benefits shown in the third row of each panel of Appendix Table 3, which results in $29.23 in additional food spending. The only outcome they look at that exactly overlaps with ours is the HEI, for which they find a 0.33 percent increase for SNAP households, compared to the 0.22 percent increase we find (Appendix Table 3). Note, however, that the imprecision of our HEI estimate (based on only one year of data) implies that an increase of 0.33 percent is well within the 95 percent confidence interval of our estimate.
In terms of our findings on the percentage change in grams of a specific food group consumed, it appears the closest outcome they look at is the percentage change in that food group’s component of the HEI. Given both are percentage changes, though, they are fairly comparable. In several cases, we find slightly bigger effects. For example, they estimate a 0.88 percent increase in the vegetable component of the HEI, while we estimate a 2.22 percent increase in grams of vegetables. Similarly, they estimate a 0.42 percent increase in the milk component of the HEI, while we estimate a 1.43 percent increase in grams of milk; while they estimate only a 0.05 percent increase in the grain component of the HEI, we estimate a 0.63 percent increase. For fruit, however, they estimate a 1.96 percent increase in the HEI component, while we estimate only a 1.02 percent increase in grams. Note that in all of these specific food group cases, our 95 percent confidence intervals would overlap with the Mabli et al. estimates.
Supporting Evidence in Data on Low-Income Households’ Patterns of Grocery Spending
There are other pieces of information available in the Current Population Survey that can help us characterize the adequacy of low-income families’ resources devoted to food. In addition to information on total food spending and spending on groceries, households are asked how much additional money they would need to spend on food per week to meet their nutritional needs. In this section, we shift the focus from all SNAP recipients to low-income households that are potential SNAP recipients. To that end, we limit our sample first to households with annual incomes less than 300 percent of the federal poverty line. Recall that average monthly income calculated from annual income may be very different from monthly income for December; the latter will govern whether a household was eligible for SNAP in December. Since in our data set of December SNAP recipients, 95 percent of households have annual income below 300 percent of the poverty line, we choose this threshold. Similarly, we limit the sample to households headed by a citizen. While it is true that households headed by a non-citizen may have members eligible for SNAP, less than 8 percent of our SNAP sample has a non-citizen head, so this restriction seems appropriate.
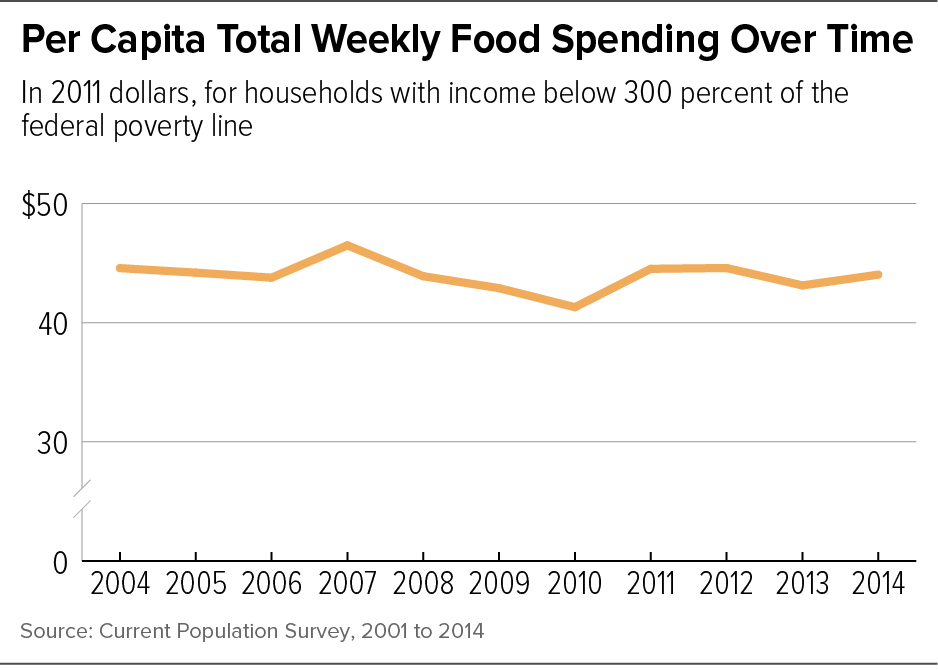
Using this sample, we look more closely at food spending and at the additional resources households report needing for food to paint a more complete picture of the adequacy of food resources. To begin, Figure 6 plots the per capita spending on food reported in the Current Population Survey, by year. We can see that spending on food drops with the beginning of the Great Recession, and then, in 2009, at the time when SNAP benefits are expanded as part of the Recovery Act in 2009, food spending stops its slide and rebounds.[23] While this pattern does not prove that these benefits resulted in more food spending, it is consistent with that interpretation.
Figure 7 shows the amount of real per capita weekly food spending by household income as a percent of the poverty line.[24] Food spending is graphed separately for households that report that they are food secure and those that report that they are food insecure. Spending on food increases as household income relative to the poverty line increases, and at each point households that report that they are food secure spend more on food than those that are food insecure. Compared to food-secure households with similar measured incomes, the food insecure spend less on food, suggesting that there are unmeasured needs that pull resources away from food.
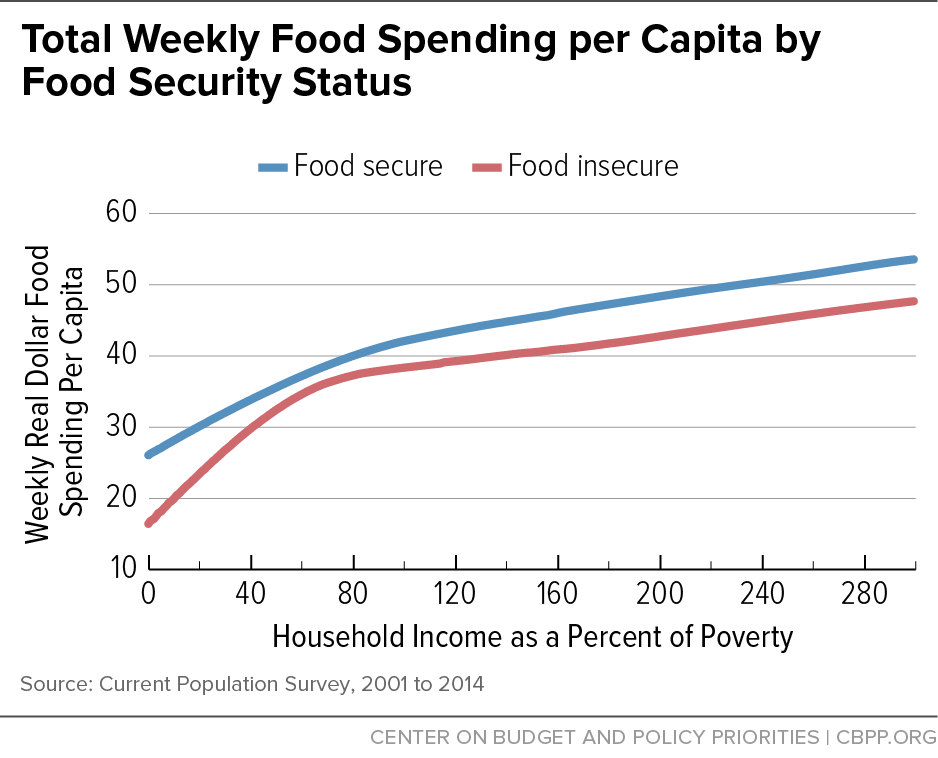
Note that when we estimate how much of an additional dollar in SNAP benefits is spent on food at stores, we see that, if anything, more of an additional dollar is spent on food by those households reporting that they are food insecure.[25] This, again, suggests that the food insecure would increase food spending in response to higher SNAP benefits.
Supporting Evidence in Data on Low-Income Households’ Desired Increases in Grocery Spending
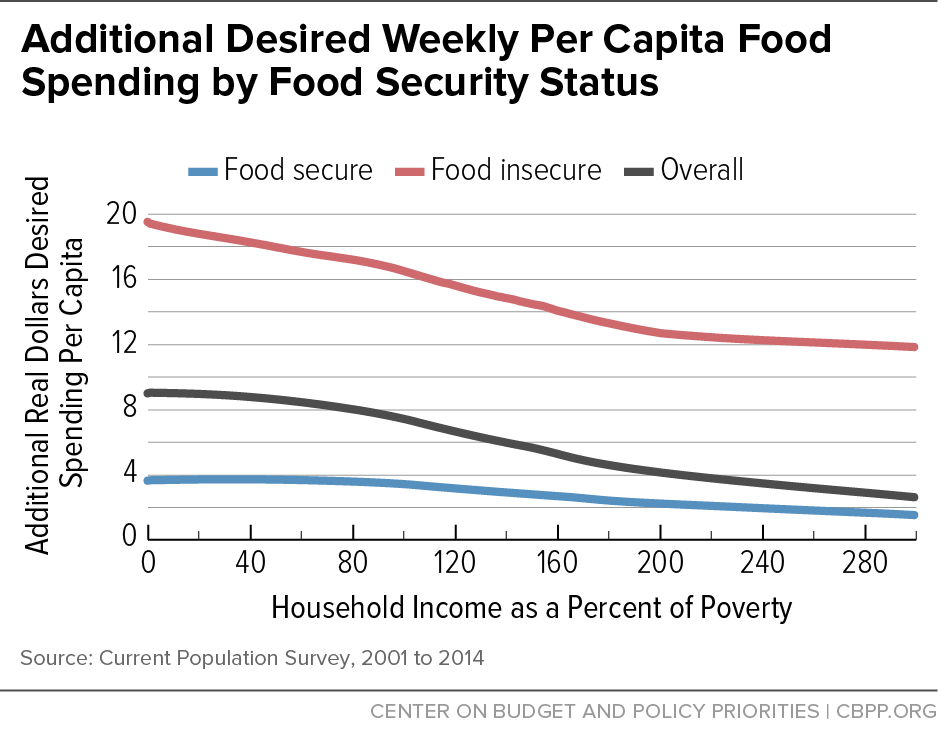
Next, we examine how much additional spending on food households report they need in order to meet their food needs. Figure 8 plots the real weekly per capita additional desired spending by income as a percent of the poverty line, both overall and separately for food-insecure and food-secure households.[26] On average, the lowest-income households report needing about $9 more spending per week per capita to meet their food needs, and this falls to about $4 per week per capita among those approaching 300 percent of the poverty line. Food-insecure households report needing much more additional spending than do food-secure households.[27] Food-insecure households’ additional spending needs per week range from about $20 per capita for the lowest-income households to about $12 per capita for those in the top income group in this sample of low-income households.[28]
We can also use these data to predict how the risk of food insecurity and the amount of additional food spending required vary with different household characteristics. In Appendix Table 4 we present results from a regression of the amount of additional money a respondent says the household needs to spend on groceries (expressed on an annualized basis as a percentage of the household’s annual income) on a set of household characteristics, holding constant households’ income-to-poverty level. In column 2, the table also shows estimates of the relationship between food insecurity status and these same right-hand-side variables (using a linear probability model).
First, we note that, broadly speaking, the same characteristics that predict a greater probability of households being food insecure also predict that households require more additional spending to cover their food needs. We see that households headed by people with disabilities, women, African Americans, other nonwhites, and high school dropouts, and households that are non-rural and do not own their own homes, are more likely to be food insecure and to report that they need a larger amount of money to meet their food needs than other similar households. We also see differences by the age structure of the household.
Interestingly, the estimates here suggest that households with more older children, especially children in the 13 to 18 age range, are about 3.5 percentage points more likely to be food insecure than other households. These households also report needing to spend more money to cover food needs. The estimated coefficient of 0.261 on number of children aged 13 to 18 (in column 1) suggests that households with an additional teenage child require a little over a quarter of a percent of their annual income in additional expenditures on food to cover their needs.
Using these coefficient estimates, we can provide a rough estimate of the additional spending on food that would give households the amount of food that they say they need. Looking at just 2014 in our regression sample, average household annual income was just over $31,000 and spending on food at stores was about $99 per week.[29] Therefore, this estimate suggests that for each additional teenager, households need to spend an additional $1.60 per week on food to meet household needs (holding household size and other observable characteristics constant).[30] It is worth noting that currently, although SNAP benefit calculations respond to household size, they do not respond to ages of the children in the household.[31]
Conclusion
The preceding analysis is necessarily descriptive because we do not have a randomized controlled experiment, or quasi-experimental policy variation, that holds households identical except for the amount of their SNAP benefits. However, evidence available from research that uses these methods indicates that these estimates, at the very least, are correct for the direction of correlation, even if they are under- or over-estimates of the exact dollar amounts that would be spent on different food categories if families were to have access to more SNAP benefits.
Recent research that uses state variation in benefits to compare food insecurity for single-parent low-income households, some that live in more- and others in less-generous benefit[32] states, finds that each $1,000 per year in cash or food benefits reduces the percent of households that are food insecure by four percentage points (about a 12 percent reduction in incidence).[33] This corroborates our finding that additional resources in the form of SNAP benefits would result in reduced food insecurity. Similarly, recent research that relies on variation in the initial rollout of SNAP (then food stamps) by county over time to create comparisons between very similar individuals who did and did not have access to these benefits finds long-term beneficial effects of food stamps on health outcomes for those whose families had access to food stamps during developmentally critical periods of childhood.[34] Again, this research corroborates our findings that households, when given access to additional resources, spend them on food and, importantly, on more nutritious foods that may yield better long-term health outcomes.
Overall, these results suggest that there are unmet food needs, and that these unmet needs vary in ways that can be predicted with household characteristics. On average, households report that their unmet food needs are on the order of $4 to $9 per capita per week, depending on their annual income. Our simulations suggest that if we give households an additional $30 per month per capita in SNAP benefits, their food spending goes up by about $19. Further, if they spend more on groceries, they purchase foods that are more nutritious, spend more time shopping for it and preparing it, and are less likely to be food insecure.
| APPENDIX TABLE 1 | |||
|---|---|---|---|
| Relationship Between SNAP Benefits and Grocery Spending | |||
| Per capita spending on food at grocery stores | |||
| SNAP per capita | 0.649 | ||
| (0.027) | |||
| 0.000 | |||
| Black | 13.878 | ||
| (3.228) | |||
| 0.000 | |||
| Other nonwhite | 14.401 | ||
| (6.261) | |||
| 0.021 | |||
| Female head | -1.954 | ||
| (3.129) | |||
| 0.532 | |||
| Disabled | 12.646 | ||
| (3.550) | |||
| 0.000 | |||
| Rural | -11.913 | ||
| (3.516) | |||
| 0.001 | |||
| Homeowner | -4.891 | ||
| (3.423) | |||
| 0.153 | |||
| HS drop out | 3.539 | ||
| (3.092) | |||
| 0.253 | |||
| # children < 5 | -6.240 | ||
| (2.916) | |||
| 0.032 | |||
| # children 5 to 12 | -3.832 | ||
| (2.369) | |||
| 0.106 | |||
| # children 13 to 18 | -3.271 | ||
| (2.878) | |||
| 0.256 | |||
| # of people in HH | -8.649 | ||
| (1.799) | |||
| 0.000 | |||
| R-square | 0.094 | ||
| # obs | 11,882 | ||
| APPENDIX TABLE 2 | ||||||
|---|---|---|---|---|---|---|
| Relationship Between Per Capita Grocery Spending and Assorted Outcomes | ||||||
| % Meals fast food | % Rec of kcal | 2007-08 HEI | Grams of milk | Grams of meat | Grams of eggs | Grams of legumes |
| -0.013 | 0.000 | 0.004 | 0.136 | 0.060 | 0.000 | -0.015 |
| (0.003) | (0.000) | (0.004) | (0.057) | (0.030) | (0.009) | (0.009) |
| 0.000 | 0.200 | 0.351 | 0.018 | 0.042 | 0.959 | 0.097 |
| Grams of grains | Grams of fruit | Grams of vegetable | Grams of beef | Grams of pork | Grams of fish | Grams of poultry |
| 0.064 | 0.057 | 0.087 | -0.007 | -0.003 | 0.004 | 0.017 |
| (0.040) | (0.041) | (0.027) | (0.008) | (0.005) | (0.008) | (0.011) |
| 0.111 | 0.168 | 0.001 | 0.373 | 0.466 | 0.608 | 0.111 |
| Grams of greens | Grams of yellows | Grams of potatoes | Grams of tomato | PC mins prep | PC mins shop | Rate of food insecurity |
| 0.007 | 0.005 | -0.008 | 0.025 | 0.040 | 0.038 | -0.0002 |
| (0.005) | (0.003) | (0.012) | (0.009) | (0.007) | (0.011) | (0.0001) |
| 0.171 | 0.079 | 0.517 | 0.006 | 0.000 | 0.001 | 0.076 |
| APPENDIX TABLE 3 | ||||||||
|---|---|---|---|---|---|---|---|---|
| Estimated Effect of Per Capita Increase in Monthly SNAP Benefit on Assorted Outcomes | ||||||||
Change in natural units |
||||||||
| Per capita addition to monthly SNAP | CPS data groceries | % meals fast food | % rec of kcal | 2007-08 HEI | Grams of milk | Grams of meat | Grams of eggs | Grams of legumes |
| $15 | $9.74 | (0.13) | 0.001 | 0.04 | 1.32 | 0.59 | 0.00 | (0.15) |
| $30 | $19.48 | (0.25) | 0.002 | 0.07 | 2.64 | 1.18 | 0.01 | (0.30) |
| $45 | $29.23 | (0.38) | 0.003 | 0.11 | 3.96 | 1.77 | 0.01 | (0.45) |
| Means | $173.55 | 10.02 | 0.97 | 50.34 | 277.39 | 184.54 | 22.30 | 19.12 |
| Per capita addition to monthly SNAP | CPS data groceries | Grams of grains | Grams of fruit | Grams of vegetable | Grams of beef | Grams of pork | Grams of fish | Grams of poultry |
| $15 | $9.74 | 0.62 | 0.55 | 0.85 | (0.07) | (0.03) | 0.04 | 0.17 |
| $30 | $19.48 | 1.25 | 1.11 | 1.70 | (0.14) | (0.07) | 0.08 | 0.33 |
| $45 | $29.23 | 1.87 | 1.66 | 2.56 | (0.21) | (0.10) | 0.12 | 0.50 |
| Means | $173.55 | 299.22 | 162.38 | 115.06 | 18.74 | 8.26 | 10.96 | 33.33 |
| Per capita addition to monthly SNAP | CPS data groceries | Grams of greens | Grams of yellows | Grams of potatoes | Grams of tomato | 2002-10 food prep | 2002-10 food shop | Rate of food insecurity |
| $15 | $9.74 | 0.07 | 0.05 | (0.08) | 0.24 | 0.39 | 0.37 | 0.00 |
| $30 | $19.48 | 0.14 | 0.11 | (0.15) | 0.49 | 0.79 | 0.75 | 0.00 |
| $45 | $29.23 | 0.21 | 0.16 | (0.23) | 0.73 | 1.18 | 1.12 | 0.00 |
| Means | $173.55 | 6.91 | 3.70 | 42.13 | 18.47 | 30.98 | 22.31 | 0.44 |
Percentage change relative to the mean |
||||||||
| Per capita addition to monthly SNAP | CPS data groceries | % meals fast food | % rec of kcal | 2007-08 HEI | Grams of milk | Grams of meat | Grams of eggs | Grams of legumes |
| $15 | $9.74 | -1.26% | 0.10% | 0.07% | 0.48% | 0.32% | 0.02% | -0.79% |
| $30 | $19.48 | -2.52% | 0.21% | 0.15% | 0.95% | 0.64% | 0.04% | -1.57% |
| $45 | $29.23 | -3.77% | 0.31% | 0.22% | 1.43% | 0.96% | 0.06% | -2.36% |
| Per capita addition to monthly SNAP | CPS data groceries | Grams of grains | Grams of fruit | Grams of vegetable | Grams of beef | Grams of pork | Grams of fish | Grams of poultry |
| $15 | $9.74 | 0.21% | 0.34% | 0.74% | -0.38% | -0.41% | 0.35% | 0.50% |
| $30 | $19.48 | 0.42% | 0.68% | 1.48% | -0.75% | -0.82% | 0.71% | 1.00% |
| $45 | $29.23 | 0.63% | 1.02% | 2.22% | -1.13% | -1.24% | 1.06% | 1.49% |
| Per capita addition to monthly SNAP | CPS data groceries | Grams of greens | Grams of yellows | Grams of potatoes | Grams of tomato | 2002-10 food prep | 2002-10 food shop | Rate of food insecurity |
| $15 | $9.74 | 1.03% | 1.42% | -0.18% | 1.32% | 1.27% | 1.68% | -0.35% |
| $30 | $19.48 | 2.07% | 2.84% | -0.36% | 2.63% | 2.55% | 3.36% | -0.70% |
| $45 | $29.23 | 3.10% | 4.26% | -0.54% | 3.95% | 3.82% | 5.03% | -1.05% |
| APPENDIX TABLE 4 | ||
|---|---|---|
| OLS Estimated Relationships Between Outcome Variables and Selected Household Characteristics | ||
| Percent more income needed to meet food needs | Food insecure | |
| Mean of dependent variable | 2.579 | 0.219 |
| Income-to-poverty | -0.015*** | -0.001*** |
| (0.000) | (0.000) | |
| Black | 1.634*** | 0.051*** |
| (0.063) | (0.004) | |
| Other nonwhite | 0.396*** | 0.009 |
| (0.107) | (0.006) | |
| Female head | 0.483*** | 0.045*** |
| (0.055) | (0.003) | |
| Disabled | 2.566*** | 0.184*** |
| (0.086) | (0.005) | |
| Rural | -0.193*** | -0.002 |
| (0.060) | (0.003) | |
| Homeowner | -1.022*** | -0.120*** |
| (0.053) | (0.003) | |
| HS dropout | 0.533*** | 0.028*** |
| (0.065) | (0.004) | |
| # children < 5 | -0.034 | 0.010*** |
| (0.057) | (0.003) | |
| # children 5 to 12 | 0.134*** | 0.019*** |
| (0.045) | (0.003) | |
| # children 13 to 18 | 0.261*** | 0.035*** |
| (0.052) | (0.003) | |
| # of people in HH | 0.151*** | 0.014*** |
| (0.032) | (0.002) | |
| R-squared | 0.087 | 0.095 |
| # observations | 71,167 | 78,793 |
End Notes
[1] Patricia M. Anderson is a professor of economics at Dartmouth College. Kristin F. Butcher is the Marshall I. Goldman professor of economics at Wellesley College.
[2] For a brief summary of issues surrounding food insecurity, see Diane Whitmore Schanzenbach, Lauren Bauer, and Gregory Nantz, “12 Facts About Food Insecurity and Policies to Alleviate It,” Economic Facts by The Hamilton Project, 2016.
[3] See USDA, ERS statistics at http://www.ers.usda.gov/topics/food-nutrition-assistance/food-security-in-the-us/key-statistics-graphics.aspx#householdtype.
[4] See USDA, ERS definitions at http://www.ers.usda.gov/topics/food-nutrition-assistance/food-security-in-the-us/measurement.aspx.
[5] The full set of items can be found at http://www.ers.usda.gov/topics/food-nutrition-assistance/food-security-in-the-us/measurement.aspx.
[6] See USDA, ERS definitions at http://www.ers.usda.gov/topics/food-nutrition-assistance/food-security-in-the-us/measurement.aspx.
[7] The exact number depends on whether there are children in the household. Without children the household will have very low food security with six or more affirmative answers, while with children it is eight or more. Note that if two or more of the eight questions specifically about children are affirmative, the children are said to be food insecure, and with five or more they are said to have very low food security. A food-insecure household may include children who are food secure.
[8] See for example Shaefer and Gutierrez (H. Luke Shaefer and Italo A. Gutierrez, “The Supplemental Nutrition Assistance Program and Material Hardships Among Low-Income Households With Children,” Social Service Review 87, no. 4 (2013), 753-79), who find a 13 percentage point reduction in household food insecurity from SNAP participation; Kreider et al. (Brent Kreider, John V. Pepper, Craig Gundersen, and Dean Jolliffe, “Identifying the Effects of SNAP (Food Stamps) on Child Health Outcomes When Participation Is Endogenous and Misreported,” Journal of the American Statistical Association 107 (2012), pp. 968-73), who find a reduction of eight percentage points in child food insecurity due to SNAP receipt in general; and Schanzenbach, Bauer, and Nantz (2016), who find an almost three percentage point decrease in very low food security after SNAP benefits were increased under the American Recovery and Reinvestment Act of 2009.
[9] For more details about the data used, which come from matching the March and December CPS samples, see Patricia M. Anderson, Kristin F. Butcher, Hilary W. Hoynes, and Diane Whitmore Schanzenbach, “Beyond Income: What Else Predicts Very Low Food Security Among Children?” Southern Economic Journal (forthcoming), available pre-publication at http://onlinelibrary.wiley.com/doi/10.1002/soej.12079/epdf.
[10] For a discussion of the drawbacks of these models, see Hilary Hoynes, Leslie McGranahan, and Diane W. Schanzenbach, “SNAP and Food Consumption,” University of Kentucky Center for Poverty Research Discussion Paper Series, DP2014-03, 2014.
[11] For example, less than 72 percent of the households receiving SNAP in December had annual incomes below 130 percent of the poverty line (the SNAP cutoff under federal rules), with over 13 percent having annual incomes over twice the poverty line.
[12] We do control for year and basic demographics, including household composition.
[13] Note this is higher than the 0.17 to 0.47 found in the studies referenced in Hoynes, McGranahan, and Schanzenbach (2014), but recall that these studies rely mainly on comparisons of low-income SNAP recipients and non-recipients. The estimated coefficient from our model using a sample of all households with incomes below 300 percent of the poverty line (instead of only all recent SNAP recipients) is 0.28, which is in range with those studies.
[14] Note that the R-square of 0.094 might strike some as low, but is quite typical for cross-sectional studies. Essentially, there is a large idiosyncratic component to grocery purchases in a given week, making it difficult to explain all of the variation observed across households. This difficulty has no bearing on the interpretation of the marginal effect of SNAP benefits on spending, which is highly statistically significant and makes clear that there is a strong positive correlation between levels of benefits and levels of grocery spending.
[15] More details on the NHANES dietary interview component can be found at http://www.cdc.gov/nchs/nhanes/nhanes_questionnaires.htm by following the link for a given survey year.
[16] See Anderson, Butcher, Hoynes, and Schanzenbach (forthcoming) for more details about the NHANES data more generally. As in the CPS, food spending is collected for supermarkets and grocery stores, as well as other types of stores that sell food.
[17] The NHANES uses the same 18-item battery of questions to determine food security status as the Food Security Supplement in the CPS.
[18] For more details about matching the ATUS data to the March and December CPS, see Patricia M. Anderson, Kristin F. Butcher, Hilary W. Hoynes, and Diane Whitmore Schanzenbach, “Understanding Food Insecurity During the Great Recession: Final Report Submitted to the Russell Sage Foundation Award 92-12-09,” 2014. We use this matched ATUS data from 2002 to 2010.
[19] Simulations of larger ($45) and smaller ($15) increases in per capita SNAP benefits are also presented for comparison.
[20] Note that the figures mark changes for which a zero change cannot be rejected using a two-sided hypothesis test at better than the 5, 10, or 15 percent level. While 15 percent is generally above the level used for statistical significance, for one preferring a one-sided test (i.e., no change versus an increase/decrease in healthier/less healthy foods), this level would imply that a zero change could be rejected at the 7.5 percent level, well below the 10 percent level often used.
[21] The Healthy Eating Index is a 100-point score that determines how well individuals follow U.S. dietary guidelines. More details can be found at http://www.cnpp.usda.gov/healthyeatingindex.
[22] James Mabli, Laura Castner, James Ohls, Mary Kay Fox, Mary Kay Crepinsek, and Elizabeth Condon, “Food Expenditures and Diet Quality Among Low-Income Households and Individuals,” Final Report submitted to USDA, FNS for Contract Number AG-3198-D-07-0114, 2010, http://www.fns.usda.gov/sites/default/files/FoodExpendDietQuality.pdf.
[23] This is consistent with findings in Mark Nord and Mark Prell, “Food Security Improved Following the 2009 ARRA Increase in SNAP Benefits,” Economic Research Report 116, Economic Research Service, USDA, April 2011, www.ers.usda.gov/media/127913/err116.pdf.
[24] We use locally weighted regression to create these figures.
[25] Here, we re-estimated the model reported in Appendix Table 1 separately for SNAP recipients reporting that they are food secure and food insecure. The food insecure are estimated to spend 0.676 of an additional dollar in SNAP benefits on food at stores, compared to 0.624 for the food secure.
[26] Note that in this sample, food insecurity declines from about 32 percent of households for those with incomes under the poverty line to about 13 percent for those with incomes between 250 percent and 300 percent of the poverty line.
[27] Note that even among households that report they are food secure, the average additional spending needed to meet food needs is not zero. In order to be classified as food insecure, a household must answer “yes” to at least three questions in the battery. Thus, there may be households that are food secure that, nonetheless, self-describe as having some challenges.
[28] For comparison, CBPP calculates $420 in monthly SNAP benefits for a family of three (one adult, two children) with monthly income of $1,256 (full-time minimum wage work) and shelter costs of $862 and dependent care costs of $74 per month (see https://www.cbpp.org/research/a-quick-guide-to-snap-eligibility-and-benefits). Thus, SNAP benefits for this example family are about $32 per capita per week. Our estimates suggest that food-insecure families report needing an additional $12 to $20 per capita per week.
[29] Recall that the sample is limited to households with incomes less than 300 percent of the poverty line.
[30] Average annual household income in 2014 for our regression sample is $31,328.01. Taking 0.261 percent of that yields about $81.77 on an annual basis. Thus, the additional weekly amount required is $81.77 divided by 52, which is $1.57 per teen child (based on estimates that hold other observable household characteristics constant).
[31] While SNAP benefits do not respond to the age of children, the totality of food aid may be said to respond since Women, Infants, and Children (WIC) benefits are available when children are under the age of 5, and free and reduced-price meals are available to children who attend school. However, the results here show that the combination of these programs still leaves households with teenagers reporting needing more money to cover food needs and being more vulnerable to food insecurity.
[32] Although SNAP benefit levels are set by the federal government and therefore do not vary across states, states do set the amount of Temporary Assistance to Needy Families (TANF) benefits and the rate at which these benefits are reduced with SNAP benefits. Therefore, the effective SNAP benefit levels vary with these state rules. For details see Lucie Schmidt, Lara Shore-Sheppard, and Tara Watson, “The Effect of Safety Net Programs on Food Insecurity,” Journal of Human Resources, forthcoming.
[33] Schmidt, Shore-Sheppard, and Watson (forthcoming).
[34] Hilary Hoynes, Diane Whitmore Schanzenbach, and Douglas Almond, “Long-Run Impacts of Childhood Access to the Safety Net,” American Economic Review 106, no. 4 (2016), pp. 903-34.
More from the Authors

Patricia M. Anderson is a professor of economics at Dartmouth College.
Kristin F. Butcher is the Marshall I. Goldman professor of economics at Wellesley College.