SNAP Caseload and Spending Declines Accelerated in 2016
Return of Three-Month Time Limit a Factor in Many States
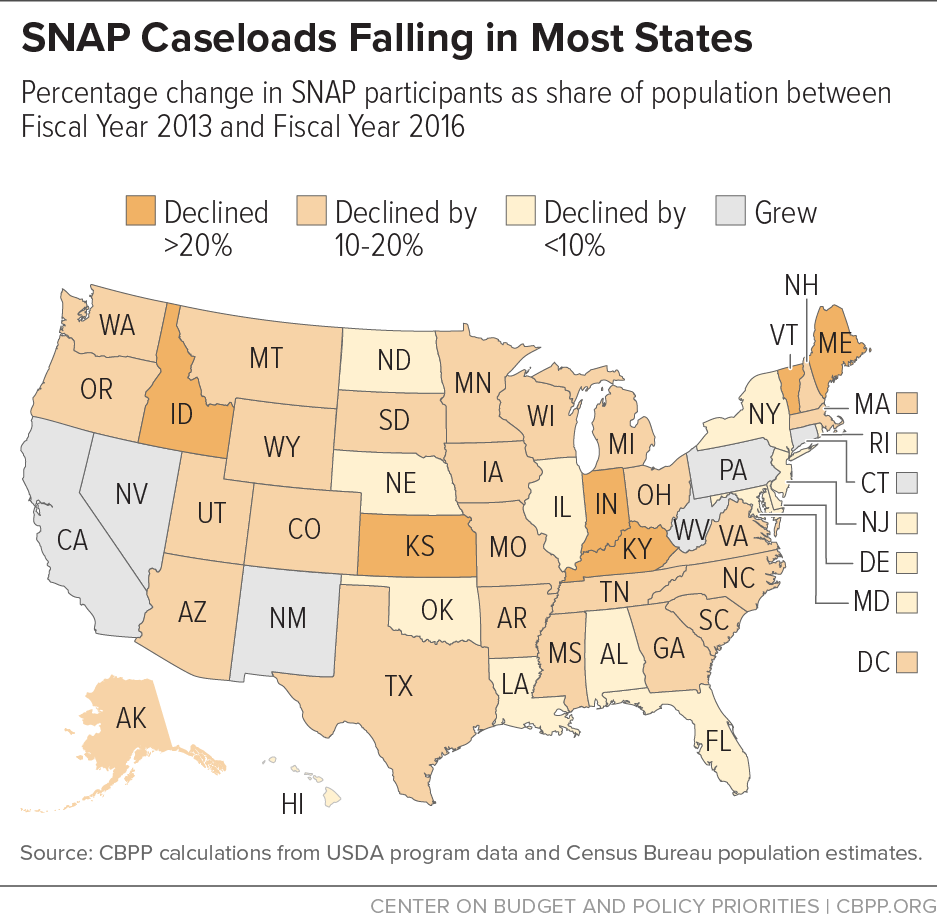
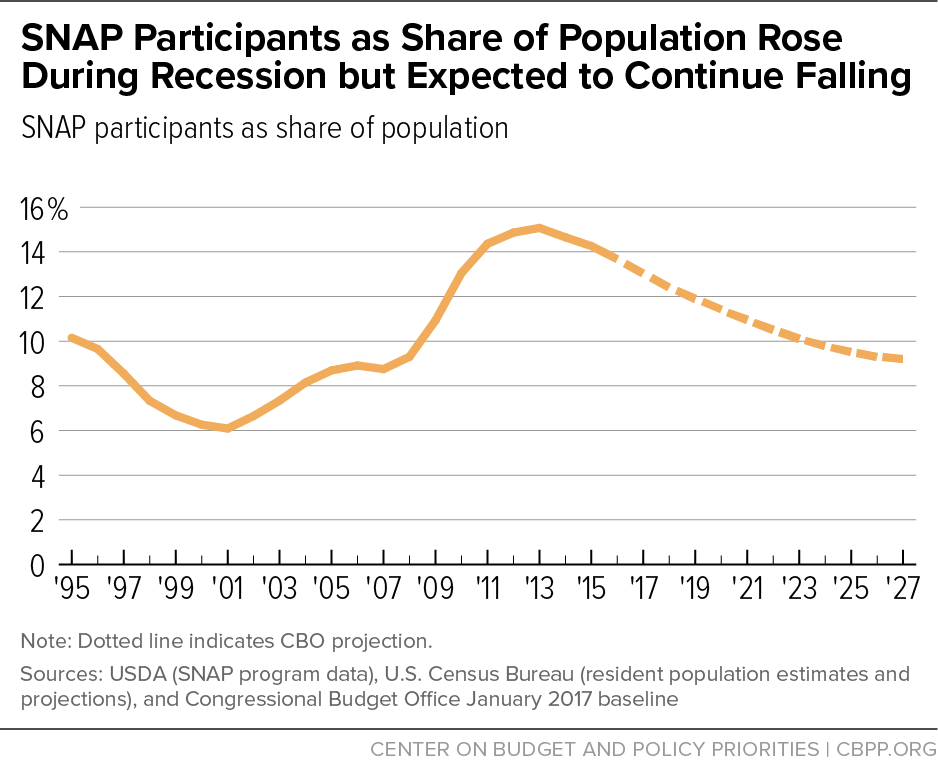
The number of people participating in the Supplemental Nutrition Assistance Program (SNAP, formerly food stamps) has declined by more than 4 million people, or 9 percent, since peaking in December 2012, reflecting the program’s responsiveness to an improving economy, as well as the effects of the returning three-month time limit for unemployed childless adults. The share of the population participating in SNAP has returned to 2011 levels, and is projected to continue to fall. The share of the population receiving SNAP was lower in 2016 than in 2013 in 45 states.The SNAP caseload declines have been widespread; the share of the population receiving SNAP was lower in 2016 than in 2013 in 45 states.[1] (See Figure 1.)
SNAP spending also has fallen. SNAP outlays fell for the third straight year and were 4 percent lower in 2016 than in 2015. The only time since 2000 when SNAP spending declined faster was in 2014 when the Recovery Act’s SNAP benefit boost ended. In 2016 SNAP spending dropped to its lowest point since 2010, and more than 11 percent below 2013 peak levels. (These figures refer to nominal spending, not adjusted for inflation.)
Previously, SNAP caseloads had grown significantly between 2007 and 2012 as the recession and lagging recovery led more low-income households to qualify and apply for help. As the effects of the economic recovery began to reach low-income households, SNAP caseload growth slowed substantially in 2012 and 2013, and caseloads fell by about 2 percent in 2014 and another 2 percent in 2015.
SNAP participation declined at a faster rate in 2016. The number of SNAP participants in an average month of 2016 was 3.4 percent lower than in 2015, about 50 percent greater than the rate of decline in the previous two years. SNAP caseloads fell by about 1 million people in both 2014 and 2015, but by 1.5 million people in 2016.
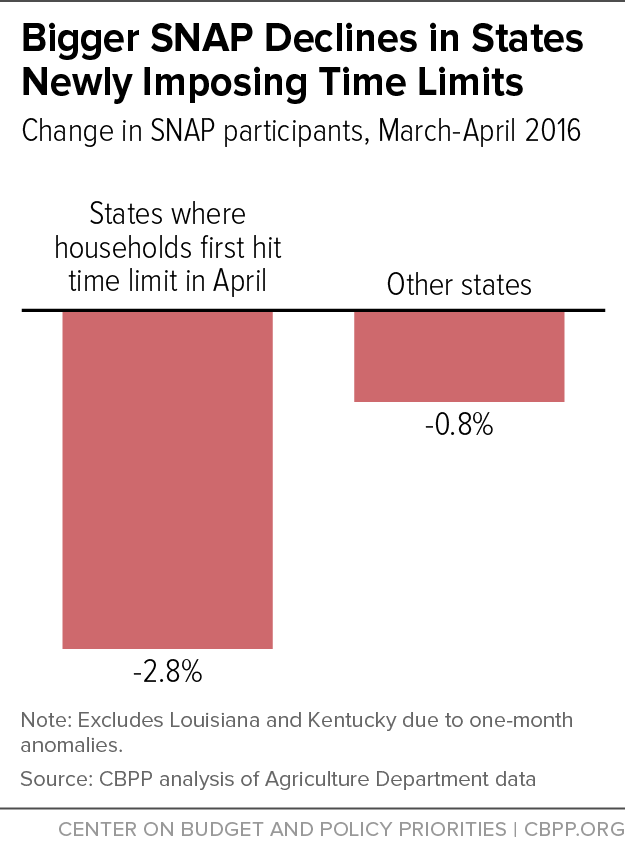
The return of the three-month time limit in January 2016 in about 20 states contributed to falling caseloads, particularly beginning in April, when those newly subject to the time limit began exhausting their three months of benefits. Nationally, 773,000 fewer individuals participated in SNAP in April 2016 than in the prior month, the largest one-month drop since temporary disaster benefits for Hurricane Katrina victims ended in 2005.[2] Eight of the ten states with the largest percentage caseload drop in April implemented the time limit in January, including Florida, Missouri, Alabama, and Arkansas. Caseloads fell by 2.8 percent in the states that began cutting people off SNAP in April due to time limits; caseloads fell 0.8 percent in the other states.
Caseloads Have Fallen in Most States
SNAP caseloads increased substantially in every state during the recession and slow recovery (that is, 2007 through 2012), as national caseloads were rising. The picture has been less uniform across the states since caseloads peaked in December 2012.
Nationally, the number of SNAP participants fell by about 7 percent between 2013 and 2016. Because the total U.S. population grew slightly over this period, the share of the population participating in SNAP fell by more than 9 percent over this period.[3] In 45 states, a smaller share of the population participated in SNAP in 2016 than in 2013. (See Figure 1 and Appendix.)[4]
- Caseloads have declined substantially in most states since 2013. In 26 states, the share of the population participating in SNAP fell by 10 to 20 percent between 2013 and 2016. In six states it fell by more than 20 percent. These two groups of states account for 32 states and more than half of the SNAP caseload. In many of these states, caseloads have fallen steadily since peaking in 2012 or 2013. All of the states with greater than 20 percent declines in the share of the population participating in SNAP (and most of the other states with declines of 10 to 20 percent) reinstated the three-month time limit between 2013 and 2016.
- In the remaining 19 states, SNAP caseloads have fallen by less than 10 percent or have grown somewhat. This group includes several states where SNAP has been declining steadily for some time but at a slower rate (such as New York), and others (such as Illinois) where declines began more recently (in late 2014 or 2015), and as a result caseloads have not fallen as significantly. The share of the population now receiving SNAP in California and Pennsylvania is higher than in 2013 (by about 2 percent in California and 4 percent in Pennsylvania), though it started to decline in both states in recent months. Because some of the states that have been declining less or growing are larger states, they have a disproportionate impact on national SNAP caseloads.
Re-imposition of Time Limit a Major Driver of Caseload Declines in 2016
The re-implementation of the three-month time limit for childless adults in 2016 was likely a major driver of the significant caseload declines that occurred in 2016.[5]
An austere provision from the 1996 welfare law limits unemployed adults aged 18-49 who aren’t disabled or raising minor children to three months of SNAP every three years. Since the recession, this three-month limit hadn’t been in effect in most states because the law allows states to suspend it in areas with high and sustained unemployment. Many states qualified for and received statewide waivers of the time limit due to the Great Recession and its aftermath.
But as unemployment rates have fallen, most states have remained eligible to waive only high-unemployment areas within the state, or have opted to forgo waivers all together. More than 40 states implemented the time limit in 2016, 22 of them for the first time since before the recession.[6] As a result, we estimate that at least 500,000 childless adults lost SNAP over the course of 2016.[7]
The re-imposition of the three-month time limit appears to account for a large share of the SNAP caseload decline in April 2016, when individuals in states that began implementing the time limit in January 2016 started reaching the three-month limit and losing benefits:
- April’s one-month drop of 773,000 individuals was the largest single-month decline in SNAP participants since late 2005, when temporary disaster SNAP benefits following Hurricane Katrina ended.[8]
- States where individuals began losing benefits in April also saw sharper declines than other states. Eight of the ten states with the largest percentage caseload drop that month implemented the time limit in January, including Florida, Missouri, Alabama, and Arkansas.
- Caseloads fell by 2.8 percent in the states that began cutting people off SNAP in April due to time limits, while falling 0.8 percent in the other states.[9] (See Figure 2.) Over the year, the trend was similar: states implementing the time limit at some point in 2016 saw a decline of 4.2 percent, compared to 2.4 percent for states that did not newly re-implement in 2016, though several states with the steepest caseload declines in 2016 did not re-implement the time limit in 2016, so it was not the only factor. In the prior two years, the two groups of states’ caseloads declined at close to the same rate.[10]
Individuals subject to the time limit can receive only three months of SNAP benefits out of every three years unless they are working or in a work training program for at least 20 hours a week. States are not required to provide slots in training programs to ensure that recipients subject to the time limit have an opportunity to meet the requirement, and most don’t. As a result, even people who are working fewer than 20 hours a week or are looking for a job or willing to participate in a work program can lose benefits after three months.
Because individuals can lose SNAP even if they can’t work or would like to work and are looking for a job, falling SNAP participation among people subject to the time limit doesn’t mean they’re better off. Research shows that many of those subject to the time limit have a strong connection to the labor force and cycle in and out of work, turning to SNAP while between jobs. They also frequently face significant barriers to work, such as low skill levels or education or mental or physical health impairments.[11] Losing their modest SNAP benefits doesn’t help them find work; it only increases hardship.[12]
SNAP Grew During the Recession Due to Rising Caseloads and Recovery Act Spending
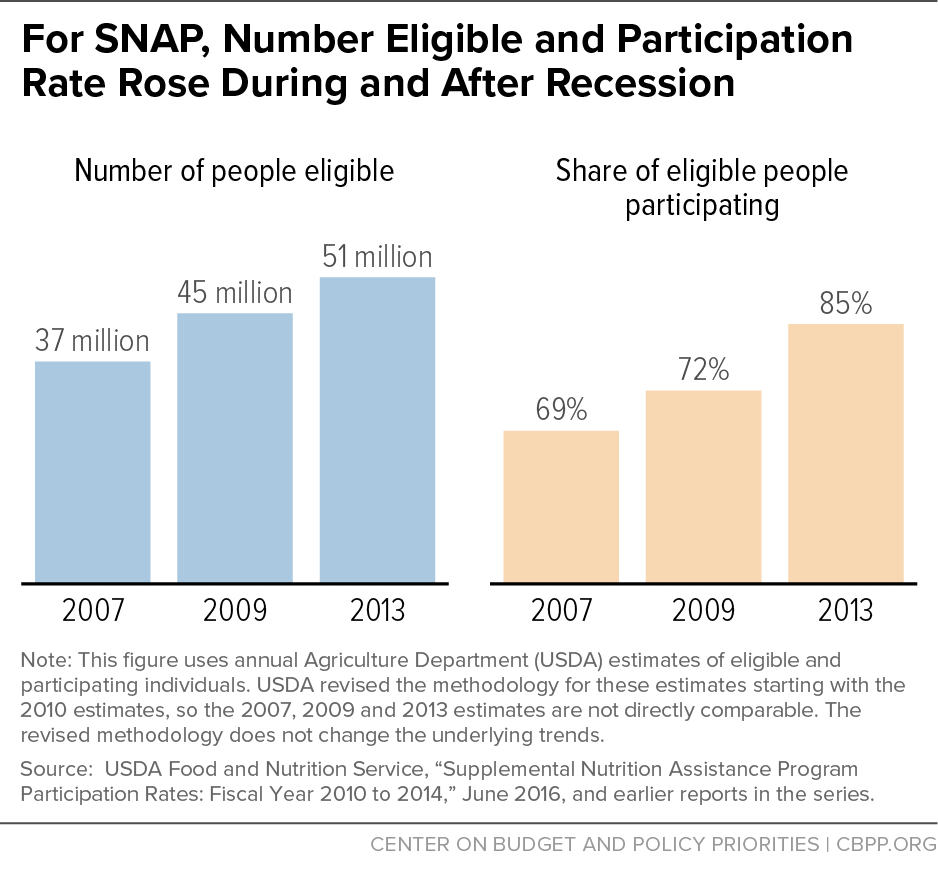
Between 2007 and 2013 two factors drove SNAP caseload growth: first, more households qualified due to the steep recession and sluggish initial recovery and, second, a larger share of eligible households applied for help.[13] Figure 3 shows the considerable increases in both areas.
- More people eligible. The number of people eligible for SNAP rose from 37 million in 2007 (before the recession) to 45 million in 2009 and 51 million in 2013, Department of Agriculture (USDA) data show. The Congressional Budget Office (CBO) has confirmed that “the primary reason for the increase in the number of participants was the deep recession . . . and subsequent slow recovery; there were no significant legislative expansions of eligibility.”[14]
- More eligible participated. The participation rate among eligible individuals also rose, from 69 percent in 2007 to 85 percent in 2013.[15]
Several factors likely contributed to the increase in the participation rate. The widespread and prolonged effects of the recession, particularly the record long-term unemployment, may have made it more difficult for family members and communities to help people struggling to make ends meet. Households that already were poor became poorer during the recession and may have been in greater need of help. In addition, states continued efforts begun before the recession to reach more eligible households — particularly working families and senior citizens — by simplifying SNAP policies and procedures. Finally, research shows that take-up of SNAP among eligible households is higher when benefits are higher, so the temporary increase in benefits from the 2009 Recovery Act may have raised participation rates.
SNAP costs also grew during the recession because the 2009 Recovery Act temporarily boosted SNAP benefits to provide fast and effective economic stimulus and push against the rising tide of hardship for low-income Americans. Economists at CBO and Moody’s Analytics consider SNAP one of the most effective forms of economic stimulus.[16] The Recovery Act benefit boost raised SNAP spending (above what it otherwise would have been) by over $40 billion, before ending early in fiscal year 2014.[17]
SNAP Caseloads Are Falling; Expected to Continue Falling
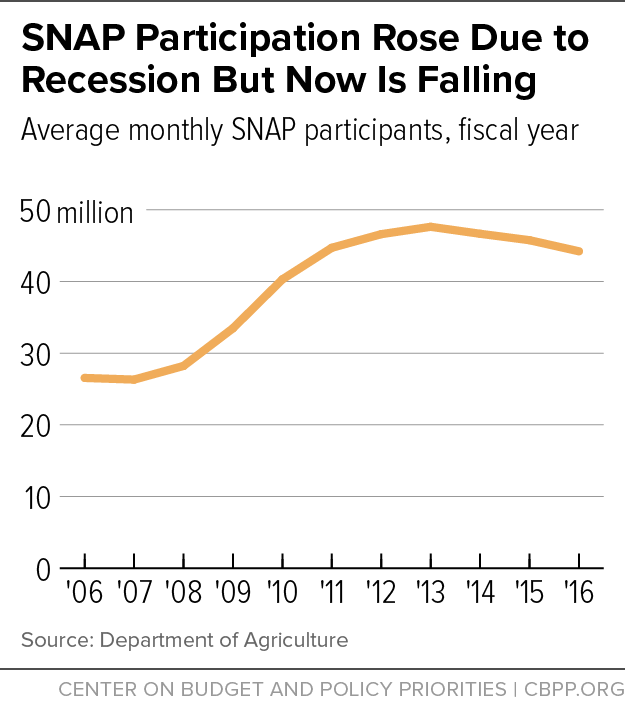
Annual SNAP caseload growth slowed to 4 percent in 2012 and 2 percent in 2013. In 2014 and 2015 SNAP caseloads declined in most states; as a result, the national SNAP caseload fell by 2 percent both years. Caseloads declined more quickly in 2016. In 2016 the number of SNAP participants was 3.4 percent lower than in 2015 — 50 percent more than the annual rate of decline in each of the previous two years. (See Figure 4.) [18]
Nationally, SNAP caseloads have been falling for more than three years; 4.3 million fewer people participated in SNAP in September 2016 than in December 2012, when participation peaked.
Over the longer term, the CBO expects that as the economy improves, the number of participants will fall by about 2 to 4 percent each year over the next decade: from 44. 2 million in 2016, to 42. 6 million in 2017, 40.9 million in 2018, and 32.5 million by 2026.[19] By 2027, CBO forecasts that the share of the population receiving SNAP will return close to 2007 levels, at about 9 percent. (See Figure 5.)
Factors Influencing Caseload Trends
SNAP caseloads have historically tracked economic conditions, rising when the economy weakens and then falling — with a several-year lag — when it recovers. Research suggests that the economic recession and slow recovery were the largest factors in the caseload growth, and that there is often a substantial lag between economic improvement and caseload declines. Emerging research on the Great Recession finds that economic factors explain between about half and 90 percent of the increase in SNAP caseloads between 2007 and 2011. One study, which tested different measurements of the effect of the economy on SNAP caseloads at the state and local level, found that the economy explained 70 to 90 percent of the increase in caseloads; it also found substantial lags — of up to two years — between changes in the economy and changes in SNAP participation.[20]
Conversely, it is likely that most of the decline since 2012 can be explained by economic improvement, with the time limit re-implementation playing a major role in 2016.
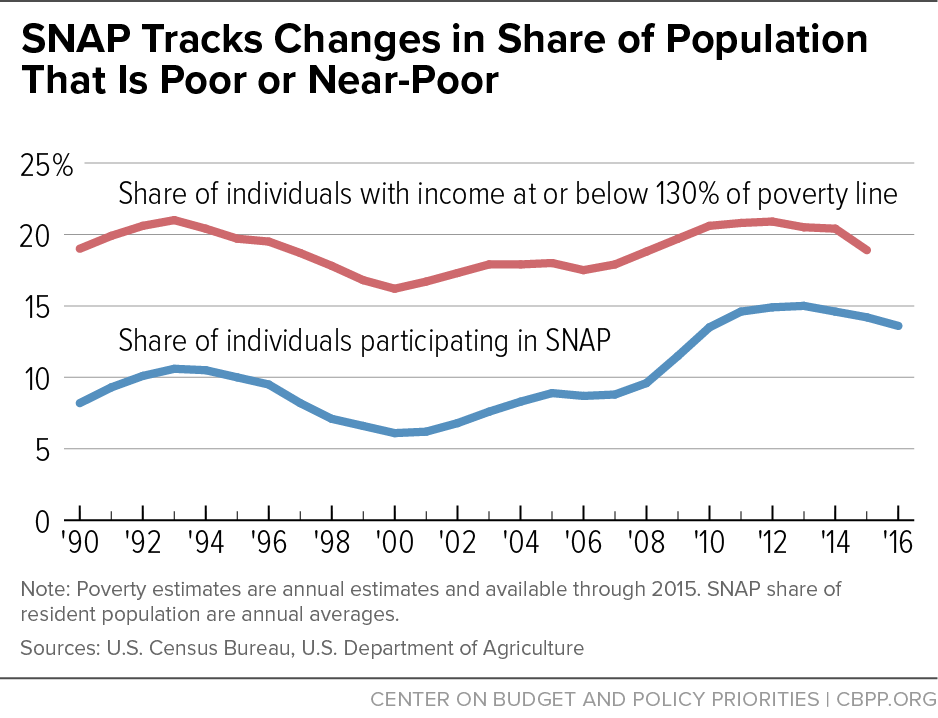
In addition, the poverty rate remained elevated above pre-recession levels through 2015 (the most recent year for which such data are available). Some SNAP critics suggest the fact that the unemployment rate has returned to pre-recession levels while SNAP enrollment has not indicates a problem with SNAP. However, poverty is a better indicator of need for SNAP than the unemployment rate, this suggests that the drop in the overall unemployment rate masks continued hardship for many. (See Figure 6.)[21]
Since, as discussed above, increases in participation rates among those eligible for SNAP was a substantial contributing factor in the increase in the number of SNAP participants after the start of the Great Recession, if participation rates have remained at higher levels one would expect the number of SNAP participants to remain elevated above pre-recession levels, even as the number of eligible people may have declined.
Early evidence confirms that SNAP participation rates have not declined substantially. In fact, the program is doing a better job at reaching some groups of eligible households that historically have had low participation rates, such as the elderly and households with earnings.
- The most recent USDA SNAP participation rate estimates (for 2014) were only slightly lower than 2013 (83 percent compared to 85 percent).
- Another USDA measure of participation rates, the Program Access Index, rose by one and a half percentage points in 2015 (from about 74.1 percent in 2014 to about 75.6 percent in 2015) after dropping by only one percentage point in 2014 (74 percent in 2014 compared to 75 percent in 2013).[22]
- Despite the improving economy, SNAP participation grew in 2015 for two groups that historically have had low participation rates: individuals in working households and seniors. The number of individuals in households with earnings while receiving SNAP in an average month rose by 2 percent in 2015 (from 19.5 million in 2014 to 20 million in 2015) and the number of elderly SNAP participants rose by 3 percent (from 4.65 million to 4.8 million).[23] Poverty fell for both the elderly and workers in 2015.[24] It is therefore likely that SNAP participation rates for these groups, both of which have historically been low, continued to increase.[25]
In addition to the improving economy, participation rate trends, and returning three-month time limit, some other factors can affect caseload trends at the state level:
- Administrative factors. Some states with especially large caseload declines experienced delays in processing SNAP applications and other administrative problems over the last year or more. Media reports have described problems with SNAP administration in Georgia, Maine, Massachusetts, Missouri, Nebraska, and North Carolina, for example.[26] Most recently, Kentucky had large volatility in SNAP caseloads in March and April 2016 reportedly due to the implementation of new automated eligibility systems.[27] Difficulty in obtaining SNAP benefits may suppress participation in some places and may explain subsequent increases in participation once these problems have been resolved. Alternatively, when states improve access to SNAP, higher participation rates among those eligible may contribute to caseload increases or slower declines.
- Short-term disaster benefits. Individuals in states affected by disasters can receive short-term benefits to replace lost food. In the last year, large numbers of households in Louisiana and South Carolina have received these benefits due to storms and flooding, as well as smaller numbers in other states.[28]
Spending and Caseloads Will Continue Falling, Forecasts Indicate
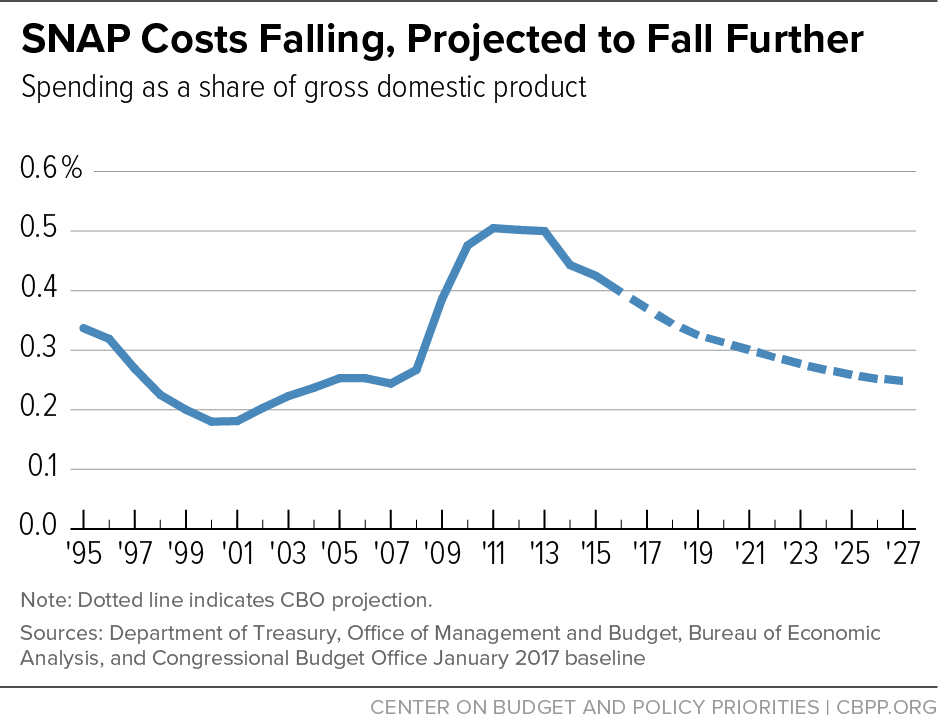
CBO and others expect SNAP spending to continue to decline as the economy recovers and the number of SNAP participants falls.[29] CBO expects SNAP spending to fall every year as a share of Gross Domestic Product, returning to its 1995 level by 2019. (See Figure 7.)
Once the economy has fully recovered, SNAP costs are expected to rise only in response to growth in the size of the low-income population and increases in food prices. Unlike health care programs and Social Security, SNAP faces no demographic or programmatic pressures that will cause its costs to grow faster than the overall economy. Thus, SNAP will not contribute to the nation’s long-term fiscal problems.
Looking Ahead
To the extent that recent and future SNAP caseload declines reflect improving economic circumstances among low-income households, they are welcome. However, the large declines seen in April 2016 as states re-implement the time limit are troublesome. The loss of benefits will likely cause serious hardship among many, since the average income of those potentially affected is less than 20 percent of the poverty line while they’re receiving SNAP.[30]
Another key issue is whether states will be able to maintain their progress in reaching eligible households. As noted, SNAP caseloads grew during the recession both because more people qualified for help (due to the weak economy) and because a larger share of eligible people applied for and received benefits. To the extent that administrative barriers are a factor in recent SNAP caseload declines, state and federal policymakers should address the problems. States have made significant gains in lowering barriers to SNAP for eligible individuals and should assess whether some eligible individuals continue to face barriers to applying for and receiving SNAP.
| Appendix: SNAP Caseload Changes by State, Fiscal Year 2013 to Fiscal Year 2016 | ||||||
|---|---|---|---|---|---|---|
| Average Monthly SNAP Participants, FY 2013 (000s) | Average Monthly SNAP Participants, FY 2016 (000s) | Percentage Change in Number of Participants, FY 2013-FY 2016 | Average Monthly Participants as Share of Population, FY 2013 | Average Monthly Participants as Share of Population, FY 2016 | Percentage Change in Average Monthly Participants as Share of Population, FY 2013-FY 2016 | |
| Alabama | 915 | 851 | -7.0% | 19.0% | 17.5% | -7.7% |
| Alaska | 91 | 82 | -9.9% | 12.4% | 11.1% | -10.6% |
| Arizona | 1,111 | 960 | -13.6% | 16.8% | 13.9% | -17.3% |
| Arkansas | 505 | 426 | -15.6% | 17.1% | 14.3% | -16.4% |
| California | 4,159 | 4,340 | 4.4% | 10.9% | 11.1% | 1.9% |
| Colorado | 508 | 476 | -6.3% | 9.7% | 8.6% | -10.9% |
| Connecticut | 425 | 432 | 1.5% | 11.8% | 12.1% | 1.9% |
| Delaware | 153 | 148 | -3.6% | 16.6% | 15.5% | -6.4% |
| District of Columbia | 145 | 135 | -7.1% | 22.5% | 19.9% | -11.6% |
| Florida | 3,556 | 3,455 | -2.9% | 18.2% | 16.9% | -7.5% |
| Georgia | 1,948 | 1,733 | -11.0% | 19.6% | 16.9% | -13.7% |
| Hawaii | 189 | 177 | -6.7% | 13.5% | 12.4% | -8.3% |
| Idaho | 227 | 185 | -18.4% | 14.1% | 11.1% | -21.6% |
| Illinois | 2,031 | 1,914 | -5.8% | 15.8% | 14.9% | -5.3% |
| Indiana | 926 | 742 | -19.9% | 14.1% | 11.2% | -20.7% |
| Iowa | 420 | 381 | -9.4% | 13.6% | 12.2% | -10.7% |
| Kansas | 317 | 254 | -19.9% | 11.0% | 8.7% | -20.4% |
| Kentucky | 872 | 666 | -23.6% | 19.8% | 15.0% | -24.3% |
| Louisiana | 940 | 927 | -1.4% | 20.3% | 19.8% | -2.6% |
| Maine | 249 | 189 | -24.0% | 18.7% | 14.2% | -24.1% |
| Maryland | 771 | 744 | -3.5% | 13.0% | 12.4% | -4.9% |
| Massachusetts | 888 | 779 | -12.2% | 13.3% | 11.5% | -13.7% |
| Michigan | 1,7736 | 1,474 | -17.0% | 17.9% | 14.8% | -17.3% |
| Minnesota | 553 | 479 | -13.4% | 10.2% | 8.7% | -15.0% |
| Mississippi | 669 | 583 | -12.9% | 22.4% | 19.5% | -12.9% |
| Missouri | 930 | 811 | -12.8% | 15.4% | 13.3% | -13.6% |
| Montana | 129 | 117 | -9.3% | 12.7% | 11.2% | -11.7% |
| Nebraska | 180 | 176 | -2.1% | 9.6% | 9.2% | -4.1% |
| Nevada | 361 | 440 | 21.8% | 13.0% | 15.0% | 15.7% |
| New Hampshire | 117 | 98 | -16.0% | 8.9% | 7.4% | -16.8% |
| New Jersey | 875 | 880 | 0.6% | 9.8% | 9.8% | 0.0% |
| New Mexico | 440 | 471 | 7.0% | 21.1% | 22.6% | 7.2% |
| New York | 3,170 | 2,968 | -6.4% | 16.1% | 15.0% | -10.7% |
| North Carolina | 1,704 | 1,568 | -7.9% | 17.4% | 15.5% | -10.7% |
| North Dakota | 57 | 54 | -4.0% | 7.9% | 7.2% | -9.1% |
| Ohio | 1,825 | 1,609 | -11.8% | 15.8% | 13.9% | -12.2% |
| Oklahoma | 622 | 613 | -1.4% | 16.2% | 15.6% | -3.4% |
| Oregon | 818 | 735 | -10.1% | 20.9% | 18.0% | -13.5% |
| Pennsylvania | 1,785 | 1,864 | 4.4% | 14.0% | 14.6% | 4.3% |
| Rhode Island | 180 | 171 | -4.9% | 17.1% | 16.2% | -5.2% |
| South Carolina | 876 | 805 | -8.1% | 18.4% | 16.3% | -11.6% |
| South Dakota | 104 | 96 | -7.8% | 12.4% | 11.1% | -10.0% |
| Tennessee | 1,342 | 1,113 | -17.1% | 20.7% | 16.8% | -18.9% |
| Texas | 4,042 | 3,768 | -6.8% | 15.3% | 13.6% | -11.4% |
| Utah | 252 | 220 | -12.6% | 8.7% | 7.2% | -16.8% |
| Vermont | 101 | 80 | -20.7% | 16.0% | 12.8% | -20.5% |
| Virginia | 941 | 826 | -12.2% | 11.4% | 9.8% | -13.8% |
| Washington | 1,113 | 1,011 | -9.2% | 16.0% | 14.0% | -13.0% |
| West Virginia | 351 | 379 | 1.9% | 18.9% | 19.5% | 2.9% |
| Wisconsin | 857 | 728 | -15.0% | 14.9% | 12.6% | -15.6% |
| Wyoming | 38 | 34 | -11.0% | 6.6% | 5.8% | -11.8% |
| Guam | 46 | 47 | 2.5% | 28.5% | 28.7% | 0.7% |
| Virgin Islands | 27 | 28 | 1.2% | 26.1% | 27.0% | 3.1% |
| United States | 47,636 | 44,219 | -7.2% | 15.1% | 13.7% | -9.2% |
End Notes
[1] Unless otherwise noted, all years presented here are fiscal years. The number of SNAP participants fell by more than 4 million people from December 2012, the peak after the recession, to September 2016, the most recent month for which data are available and the last month of fiscal year 2016.
[2] The drop in April is consistent with CBPP’s estimate that more than 500,000 people would lose benefits in 2016 due to the time limit.
[3] The remainder of this section analyzes the number of SNAP participants as a share of state population in order to more accurately represent SNAP caseload changes in the states where population is growing or shrinking substantially.
[4] There are 53 “states” in SNAP because the District of Columbia, Guam, and the Virgin Islands operate SNAP programs. The District of Columbia is included in the 45 states with declines. SNAP caseloads grew slightly in Guam and the Virgin Islands between 2013 and 2016. (Puerto Rico receives a nutrition block grant and is not included in these figures.)
[5] In the states that re-implemented the time limit in January 2016, many people were cut from SNAP after three months, in April 2016. It appears, however, that the time limit’s effect may have begun earlier in some of the states. It could be that some households started to receive notices and may not have reapplied in the interim. In addition, several states (notably, Florida) re-imposed work requirements in their SNAP Employment and Training program at the same time, and individuals may have had their cases closed as a sanction for lack of compliance with work requirements before three months elapsed.
[6] For more detail on which states re-implemented the time limit in January 2016 see Ed Bolen, et al., “More Than 500,000 Adults Will Lose SNAP Benefits in 2016 as Waivers Expire,” Center on Budget and Policy Priorities, updated January 21, 2016, https://www.cbpp.org/research/food-assistance/more-than-500000-adults-will-lose-snap-benefits-in-2016-as-waivers-expire. Note that though Alaska was on this list, the state later became eligible for (and adopted) a statewide waiver due to rising unemployment. For a current list of state waiver status, see http://www.fns.usda.gov/snap/able-bodied-adults-without-dependents-abawds.
[7] The drop in the number of SNAP participants in 2016 is consistent with these estimates. It will, however, be at least a year before detailed information on the characteristics of SNAP participants in 2016 is available that will allow us to conduct analyses to estimate a more precise figure.
[8] Looking at just one month of SNAP participation data in isolation can be misleading for three reasons: the figures are preliminary and may later be revised, there may be seasonal trends, and often there are distortions from one-time anomalies. In the case of April 2016 data, there are two such anomalies: in Louisiana the number of SNAP participants is lower by about 100,000 individuals because of disaster SNAP benefits in March following flooding; in Kentucky, caseloads dropped substantially (by about 80,000 people) the prior month, reportedly because of issues with a new eligibility system, but rebounded somewhat (by more than 50,000) in April. If we exclude these two states, then SNAP caseloads in the other states fell by 723,000 between March 2016 and April 2016. Because of these anomalies we have not included these two states in the data used for the chart in Figure 2.
[9] Many of the states that implemented the time limit prior to 2016 also saw large one-month drops in participation at that time. For example, Kansas re-imposed the time limit in October 2013, with the first childless adults losing eligibility three months later, in January 2014. The caseload decline expected due to the improving economy — about 3,000 to 4,000 participants per month — suddenly accelerated in January to about 15,000 individuals, then returned to its previous pace.
[10] Most of the states that did not re-implement the time limit in 2016 re-implemented it in 2013, 2014, or 2015. There was a not as large as an effect on overall SNAP participation for this group in any of these years because in each year, only a handful of states implemented, though there have been large effects on participation in individual states.
[11] Steven Carlson, Dorothy Rosenbaum, and Brynne Keith-Jennings, “Who Are the Low-Income Childless Adults Facing the Loss of SNAP in 2016?” Center on Budget and Policy Priorities, February 8, 2016, https://www.cbpp.org/research/food-assistance/who-are-the-low-income-childless-adults-facing-the-loss-of-snap-in-2016.
[12] For more information on the adults subject to the three month time limit see https://www.cbpp.org/unemployed-adults-without-children-who-need-help-buying-food-only-get-snap-for-three-months.
[13] For more detail on the relationship between the economy and SNAP caseloads, see Dorothy Rosenbaum and Brynne Keith-Jennings, “SNAP Costs and Caseloads Declining,” Center on Budget and Policy Priorities, March 8, 2016, https://www.cbpp.org/research/food-assistance/snap-costs-and-caseloads-declining.
[14] Congressional Budget Office, “The Supplemental Nutrition Assistance Program,” April 2012.
[15] Kelsey Farson Gray and Karen Cunnyngham, “Trends in Supplemental Nutrition Assistance Program Participation Rates: Fiscal Years 2010 to 2014,” USDA, June 2016, table F.1. The estimated participation rates are not directly comparable between 2007 and 2013 because of revisions to the methodology. The participation rate dropped slightly (to 83 percent) in 2014, the most recent year for which estimates are available.
[16] Both Mark Zandi of Moody’s Analytics and the CBO have listed SNAP as one of the most effective policies to increase economic growth and employment in a weak economy. CBO has generally ranked transfer payments to individuals, including SNAP, as having one of the top stimulus multipliers as well. See, for example, “Estimated Impact of the American Recovery and Reinvestment Act on Employment and Economic Output in 2013,” February 2014, http://www.cbo.gov/sites/default/files/cbofiles/attachments/45122-ARRA.pdf. Zandi has consistently ranked SNAP as having one of the top fiscal stimulus multipliers (see, for example, https://www.cbpp.org/research/economy/the-financial-crisis-lessons-for-the-next-one).
[17] See Stacy Dean and Dottie Rosenbaum, “SNAP Benefits Will Be Cut for Nearly All Participants In November 2013,” Center on Budget and Policy Priorities, August 2, 2013, https://www.cbpp.org/cms/?fa=view&id=3899 and Brynne Keith-Jennings and Dottie Rosenbaum, “SNAP Benefit Boost in 2009 Recovery Act Provided Economic Stimulus and Reduced Hardship,” Center on Budget and Policy Priorities, March 31, 2015, https://www.cbpp.org/research/food-assistance/snap-benefit-boost-in-2009-recovery-act-provided-economic-stimulus-and.
[18] The acceleration in SNAP participation declines occurred despite a larger number of people receiving SNAP benefits as a result of disasters in 2016 than in 2015. There were virtually no new SNAP participants from disaster benefits in 2015 compared to an average of more than 70,000 in an average month in 2016, including 125,000 in September. See Table 2a: http://www.fns.usda.gov/sites/default/files/datastatistics/keydata-september-2016_0.pdf.
[19] Congressional Budget Office, “Supplemental Nutrition Assistance Program: CBO Baseline, January 2017,” January 24, 2017, https://www.cbo.gov/about/products/baseline-projections-selected-programs#20.
[20] Peter Ganong and Jeffrey B. Liebman, “The Decline, Rebound, and Further Rise in SNAP Enrollment: Disentangling Business Cycle Fluctuations and Policy Changes,” National Bureau of Economic Research, Working Paper 19363, August 2013, http://www.nber.org/papers/w19363.pdf?new_window=1; James P. Ziliak, “Why Are So Many Americans on Food Stamps?” in J. Bartfeld et al., editors, SNAP Matters: How Food Stamps Affect Health and Well Being, Stanford University Press, 2015; Marianne Bitler and Hilary Hoynes, “The More Things Change, the More They Stay the Same? The Safety Net and Poverty in the Great Recession,” Journal of Labor Economics, Vol. 34, Issue S1, 2016; and Jacob Alex Klerman and Caroline Danielson, “Can the Economy Explain the Explosion in the Supplemental Nutrition Assistance Program? An Assessment of the Local-level Approach,” American Journal of Agricultural Economics, 2016.
[21]As Figure 6 shows, the share of the population with incomes below 130 percent of poverty (i.e., those who likely are eligible for SNAP) fell somewhat faster in 2015 than the share of the population participating in SNAP. As mentioned, the number of SNAP recipients fell by 2 percent in 2015. According to the Census Bureau’s Current Population Survey (CPS), which is the source of the data for Figure 6, the number of people with annual income below 130 percent poverty fell by about 6.5 percent. According to another Census Survey, the American Community Survey, which has larger sample sizes, the number with annual income below 130 percent poverty fell by less: about 3 percent, between 2014 and 2015. In addition to the explanation explored in the text that SNAP participation rates may still be on the rise and offsetting declines in eligibility, the research documenting a lag in timing for when economic changes are reflected in SNAP participation may be a contributing factor to the somewhat slower drop in SNAP participation in 2015. As discussed, SNAP participation declines accelerated to -3.4 percent in 2016.
[22] USDA calculates the Program Access Index annually for states and the United States as a whole using administrative data on the number of SNAP participants and the number of people with income below 125 percent poverty from the Census Bureau’s American Community Survey. See USDA, “Calculating the Supplemental Nutrition Assistance Program (SNAP) Program Access Index: A Step-by-Step Guide for 2015, January 2017,” https://www.fns.usda.gov/sites/default/files/ops/PAI2015.pdf.
[23] These figures are from USDA SNAP Household Characteristics data for fiscal years 2014 and 2015, and are for individuals receiving SNAP in an average month in households with earnings and aged 60 and up. See USDA, “Characteristics of Supplemental Nutrition Assistance Households: Fiscal Year 2014,” https://www.fns.usda.gov/snap/characteristics-supplemental-nutrition-assistance-program-households-fiscal-year-2014 and “Characteristics of Supplemental Nutrition Assistance Households: Fiscal Year 2015,” https://www.fns.usda.gov/snap/characteristics-supplemental-nutrition-assistance-households-fiscal-year-2015.
[24] Both the number of people in poverty and the poverty rate fell among elderly individuals and individuals who worked in the last year, according to Census data. For example, see Historical Poverty Tables 3 (for ages 65 and up) and 25, here: http://www.census.gov/data/tables/time-series/demo/income-poverty/historical-poverty-people.html.
[25] In 2014, according to USDA estimates, 42 percent of eligible elderly individuals and 70 percent of eligible individuals in households with earnings participated on SNAP. Prior to the recession the participation rates for these groups were substantially lower: about 30 percent and 57 percent, respectively. (These figures are not directly comparable because USDA changed the methodology for the participation rate estimates in 2010.)
[26] See, for example, Craig Schneider, “Food Stamp Woes Put $76 Million at Risk,” Atlanta Journal-Constitution, March 30, 2014; Christopher Cousins, “Short-staffing at DHHS blamed for delays in delivering food stamp benefits to Mainers,” Bangor Daily News, June 17, 2014; Nancy Cambria, “Missouri policies blocking access to food stamps, Medicaid and other support for the needy,” St Louis Post-Dispatch, March 23, 2014; Lynn Bonner, “NC Counties Receive Staffing Help to Get Through Food Stamp Backlog,” Charlotte Observer, January 10, 2014; Susan Spence, “Red tape glitches cut food stamp recipients,” Worcester Telegram and Gazette, June 7, 2015; Martha Stoddard, “Nebraska risks losing $17M a year in federal funds if processing of food stamp applications continues to drag,” Omaha World-Herald, April 18, 2015.
[27] For example, Deborah Yetter, “New KY benefits system disrupting aid for many,” Courier-Journal, March 25, 2016, http://www.courier-journal.com/story/news/politics/2016/03/25/new-ky-benefits-system-disrupting-aid-many/82206656/.
[28] See: http://www.fns.usda.gov/disaster/disaster-assistance.
[29] Low food price inflation the past several years also is a contributing factor. SNAP benefits are based the cost of the “Thrifty Food Plan,” the Agriculture Department’s estimate of a very low-cost, nutritionally adequate diet.
[30] See Bolen et al.
More from the Authors

Areas of Expertise