Administration’s 2018 Budget Would Severely Weaken and Cut the Supplemental Nutrition Assistance Program
President Trump’s 2018 budget proposal calls for more than $193 billion in cuts to the Supplemental Nutrition Assistance Program (SNAP) over the next ten years ― a more than 25 percent cut. The bulk of the cuts (about $116 billion) would come from abandoning the federal commitment to provide food assistance to low-income Americans through a national program. This proposal would severely undercut one of the nation’s most effective anti-poverty programs and risk resurrecting serious problems that our country has largely solved. Instead, in a massive cost-shift, the budget would force states to pay 25 percent of the cost of SNAP benefits while allowing states to cut benefits — flexibility many would likely need to take to ease this new financial mandate. This proposal would severely undercut one of the nation’s most effective anti-poverty programs and risk resurrecting serious problems that our country has largely solved — severe hunger and malnutrition.
Additional deep cuts would terminate assistance to millions and cut benefits to millions more, targeting the unemployed, low-income working families with children, and the elderly and disabled. Among these proposals, the budget would impose an abrupt benefit cliff, further curtail time-limit waivers for unemployed adults, and eliminate the small minimum benefit available mostly to seniors and people with disabilities. (See Table 1.) [1]
This package of SNAP proposals is in addition to nearly $2 trillion in proposed cuts to programs that provide basic supports, such as health care, benefits to people with disabilities, housing, and other core services to low- and moderate-income people. The same budget proposes to lavish tax cuts on the wealthy. Taken as a whole, the Administration’s budget would increase income inequality and make the lives of millions of low-income Americans harder, risking serious consequences for many.
| TABLE 1 | |
|---|---|
| SNAP Cuts in the President’s 2018 Budget | |
| Proposal | Federal Savings Over Ten Years |
| Impose a 25 Percent Match Requirement on States | -$116.2 billion |
| Restrict Categorical Eligibility | -$31.1 billion |
| Limit Able-Bodied Adults Without Dependents Waivers | -$20.7 billion |
| Eliminate Minimum Benefit | -$2.7 billion |
| Cap Large Households’ Benefit | -$1.8 billion |
| Retailer Fees | -$2.4 billion |
| Effects from Eliminating Low Income Home Energy Assistance Program (LIHEAP)/Terminating the SNAP-LIHEAP Connection | -$13.3 billion |
| Impose Standardized Utility Allowances Across States | -$10.4 billion |
| Child Support Enforcement Measures | -$0.2 billion |
| Interactions and Special Immigrant Visa Proposal# | about $5.5 billion |
| Total | -$193.3 billion |
Terminating SNAP’s Status as a National Program
The President’s budget would fundamentally alter SNAP’s funding structure, undermining the longstanding bipartisan federal commitment to ensuring that low-income individuals can afford an adequate diet wherever they live and placing enormous pressure on state budgets.
Since its inception, SNAP benefits have been financed with federal funds, while states (and some local jurisdictions) share in the costs of program administration. This structure was designed to address disparities across states in hunger, poverty, and state resources. The budget would require states to pay an average of 25 percent of SNAP’s benefit costs.[2] According to the budget documents, each state’s mandated share of SNAP benefits would be “based on a formula that incorporates the economic indicators that drive SNAP participation along with State resources.” As a result, some states’ share would be higher than 25 percent and others’ would be lower. The change would cut SNAP by $116 billion over the ten-year budget window ($17 billion to $18 billion a year by the 2023 to 2028 period when the average required state share reaches 25 percent), according to the Administration’s estimates.[3] The Agriculture Department’s (USDA) budget documents note that to help “states manage their costs,” states would be given new flexibility to set benefit levels.
-
The change would be a massive cost-shift to states. A quarter of SNAP benefits would be a significant burden on state budgets. For example, in Texas, 25 percent of SNAP benefits (about $1.3 billion per year) is roughly equivalent to the state’s share of the annual salary of 64,000 of the state’s teachers. In Pennsylvania, 25 percent of SNAP spending (about $680 million per year) is more than twice what the state spends on community colleges. States cannot afford to assume these costs without raising taxes or cutting spending. Many are still recovering from the Great Recession. State funding for higher education per student, for example, is still down 18 percent from before the recession. Meanwhile, state revenues currently are lower than expected in many states.
States must balance their budgets each year. To cover this significant new cost, they would likely need to increase taxes in order to raise revenue, cut other state spending to accommodate the new cost, cut SNAP benefits in order to reduce their required contribution, or some combination of the three.
See Table 2 for the annual size of the cost-shift in each state based on 2016 SNAP benefits (if every state’s share were 25 percent) and an estimate of the cost-shift over ten years, based on the Administration’s estimates.
-
States would likely need to cut benefits. SNAP benefit levels now are set federally based on the Thrifty Food Plan, an amount designed to allow households to afford a bare-bones healthy diet. As mentioned, under the budget, states would be allowed to cut SNAP benefit levels to “mitigate the effects of the funding shift.” As discussed above, states would very likely do so.
The Administration’s estimates do not, however, include any additional savings from assuming states would cut benefit levels. To the extent that states would cut SNAP benefits, households would lose more food assistance and federal savings would increase. For example, once the mandated state share reached 25 percent (in 2023), if each state were able to make up only 80 percent of the required amount, that would result in a more than $12 billion cut each year for SNAP households, on top of the budget’s other SNAP benefit cuts. As a result of this cut alone, SNAP benefits would fall by more than $25 per person per month in nominal dollars. Every SNAP household would experience the cut.[4] Under this scenario, federal savings from the SNAP provisions in the President’s budget would increase from $193 billion to almost $230 billion over ten years. In total, by 2023 (and in later years) the President’s budget would cut SNAP benefits by about 30 percent under this scenario and federal SNAP spending by almost half.
SNAP benefits average only $1.40 per person per meal. A growing body of research documents that SNAP benefits already are inadequate to fully meet the nutritional needs of eligible households, so cuts of this magnitude would have severe consequences for low-income households and many communities.
- SNAP would not be able to respond effectively to recessions. SNAP now expands automatically in response to economic downturns. When more households in a state qualify and apply for help, the state can certify them and the federal benefits are automatically available. As a result, SNAP helps stabilize households that experience a job loss and acts as an “automatic stabilizer” for the economy, helping to support consumer demand. Under this proposal, however, when a recession hits, each additional dollar needed for SNAP would require an additional state contribution at a time when state budgets already would be strapped by declining revenues because of the economic downturn. States would need to cut benefits (or raise revenues) to serve additional applicants.
Once states began to reduce benefits in order to manage this cost or to avoid a future budget shortfall, SNAP’s ability to respond to hunger and poverty consistently across the country would begin to unravel. Currently, poor households with similar circumstances are eligible for the same benefit regardless of where they live. This is not true of other benefits, where states set the conditions of eligibility and benefit levels, such as cash assistance. Cash assistance benefit levels under Temporary Assistance for Needy Families (TANF) for a single-parent family of three range from $170 per month in Mississippi to $923 in Alaska and in $789 in New York.[5] Introducing such a range in food benefit levels across states would weaken SNAP’s effectiveness as an anti-poverty and food assistance program.
Restricting Categorical Eligibility
The President’s budget would eliminate a key aspect of “categorical eligibility,” a SNAP option that allows states to raise income cutoffs and ease asset limits based on providing households a TANF-funded benefit. More than 40 states are currently implementing this option, which addresses SNAP’s abrupt benefit cutoff above 130 percent of poverty and reduces administrative complexity and cost. See Table 3 for a listing of which states have taken this option. The Administration estimates the proposal would save more than $31 billion over ten years.
- Poor working families, seniors, and people with disabilities would face benefit cuts. Many working families have gross income just above SNAP’s income limit of 130 percent of the federal gross poverty limit but face significant expenses, including costly housing and childcare, that can put a healthy diet out of reach. States can use the categorical eligibility option to ease their SNAP income cutoff and provide SNAP benefits to these working poor families. In an average month, approximately 1 million low-income households receive food assistance as a result of this option; they would lose all their benefits under the Administration’s proposal. Households that contain individuals with disabilities or seniors do not face a gross income test under federal rules. The categorical eligibility option allows states to create parity across all households with respect to this rule.
- The proposal would create a benefit cliff. Absent categorical eligibility, a family would lose substantial SNAP benefits from a small increase in earnings that raises its gross income above 130 percent of the federal poverty level. Using categorical eligibility to lift the gross income limit allows families to gradually phase off the SNAP program when wages increase. For example, a single mother with two children working full time at $12 an hour would have income at 125 percent of the poverty level and receive about $170 a month from SNAP.[6] If her hourly wage increased by 50 cents (or $80 a month) and lifted her income just above 130 percent of poverty, the family would become ineligible for SNAP and lose about $90 in net resources. The Administration’s proposal would impose a benefit cliff in the 31 of SNAP’s 53 states currently using categorical eligibility to raise the gross income limit.[7]
- Re-imposing asset limits would penalize families for accruing modest savings. This option also permits states to ease the federal asset limit, thereby allowing households with savings of more than the federal limit of $2,250 (or $3,250 for households with an elderly or disabled member) to participate. Building assets helps low-income families invest in their futures. Modest savings can allow households to avert a financial crisis that may push them deeper into poverty or even lead to homelessness; avoid accumulating debt that can impede economic mobility; and be better prepared to avoid poverty (and therefore heavy reliance on the government) in old age. If states that have eliminated or raised asset tests using the categorical eligibility option were forced to re-impose federal SNAP limits, poor families participating in SNAP who have managed to save as little as $2,250 would lose food assistance.
Limiting Waivers of SNAP’s Time Limit Would Increase Hardship for Unemployed Adults Looking for Work
The President’s budget also proposes severely restricting SNAP benefits for unemployed childless adults living in areas with high unemployment by allowing waivers of a three-month time limit only for areas with unemployment rates of 10 percent or more. Since few areas have sustained unemployment rates that high, close to 1 million individuals could lose benefits in a typical month even if working less than half time or looking for work.[8]
SNAP restricts eligibility for unemployed adults who aren’t caring for minor children to three months out of every three years, unless they are working at least 20 hours per week or participating in a qualifying workfare or job training program. States are not obligated to provide jobs or training programs for motivated people who could use the help, and most do not. This rule is not a work requirement — it’s a harsh three-month cutoff that denies help to people who want to work and would accept any job or work slot offered them. Most of these adults are simply cut off SNAP after three months, even if they are working part time but not 20 hours a week or are actively applying for jobs. This group is extremely poor and faces significant barriers to employment.[9]
Claims that the Administration will “do everything we can to help you find a job” are incorrect because the government does not provide individuals with a way of meeting the 20-hour requirement necessary to keep food assistance. Notably, looking for a job does not count towards meeting the 20-hour requirement. Moreover, the budget proposes significant cuts in job training programs outside of SNAP that could serve as job training opportunities for these individuals.[10] Contrary to the rhetoric, the Administration’s budget would do nothing to help unemployed childless adults who participate in SNAP find a job.
Under the law, states can request a temporary waiver of the time limit for areas with high unemployment. Areas are eligible for waivers only if they meet strict criteria documenting high unemployment or a lack of jobs for at least 24 months. Virtually every state, with governors of both parties, has sought to suspend the time limit temporarily in areas of high unemployment during tough economic times.[11] See Table 3 for a listing of states that currently have temporary waivers from this rule for some or all of their state.
The Administration’s proposal would eliminate this state waiver authority, except in the rare cases where an area’s unemployment rate is 10 percent or higher averaged over 12 months. This proposal would cut SNAP benefits by an average of $2.07 billion per year. On average, nearly 1 million individuals would lose benefits because areas currently eligible and waived would no longer be eligible.
- Very little of the country would be protected. Now, 1,078 counties (of 3,142 nationwide) have waivers due to high unemployment (not all states seek waivers for eligible areas), though just 54 of those counties currently waived have an unemployment rate high enough to meet the proposed rule. These counties represent just 1.3 percent of the country’s population. (A total of 160 counties meet the proposed 10 percent threshold, but not all states have sought waivers for eligible areas.)
- An average unemployment rate of 10 percent is extremely high, even during a recession. During the months of the Great Recession (December 2007 to June 2009), the monthly national unemployment rate climbed steadily and hit 9.5 percent in June 2009. That month, only 549 counties had unemployment rates averaging 10 percent or higher over the preceding 12 months. The monthly national unemployment rate hit its peak of 10 percent in October 2009, representing 15.4 million unemployed people — but that month, only 932 counties met the proposed threshold of an average annual unemployment rate of 10 percent.
- Congress routinely deems unemployment rates that are well below 10 percent to be sufficiently high to warrant intervention or special attention. Limiting waivers to areas with unemployment rates above 10 percent ignores other measures of poor employment opportunities that have warranted government intervention. Congress has enacted emergency federal unemployment insurance programs, like Emergency Unemployment Compensation (EUC) in 2008, in every major recession since the 1950s. States qualified for additional weeks of EUC when their unemployment rate was 6 percent or higher. Similarly, the TANF block grant gives states access to additional federal funding through its Contingency Fund when a state’s average unemployment rate is 6.5 percent and rising above the prior year’s level.
Eliminating the Minimum Benefit
The President’s budget would eliminate the minimum SNAP benefit for small, low-income households. Currently, income-eligible households with one or two members that would otherwise receive $15 or less based on the SNAP benefit calculation qualify for a “minimum benefit” — a modest $16 per month.[12] The proposal would remove the benefit floor, and benefits for one- and two-person households would be strictly calculated according to the benefit formula. Under the provision, households currently receiving the minimum benefit would see their food assistance reduced, often to negligible levels, or would lose benefits altogether. The Administration expects this proposal will cut SNAP benefits to these households by $2.7 billion over ten years. See Table 4 for an estimate of the state-by-state impact of this change.
Under this provision, over 1.3 million low-income households would be cut off SNAP, and another nearly 280,000 households’ benefits would be cut. The proposal would particularly harm people with disabilities and seniors, who live in approximately 80 percent of households that receive the minimum SNAP benefit. Because of large out-of-pocket medical costs, many seniors and individuals with disabilities face more constrained budgets than their incomes may suggest. Even a modest cut to food assistance, coupled with the other damaging policies included in the President’s budget, could cause these vulnerable groups to struggle to afford groceries.
Capping SNAP Benefits at the Maximum Benefit for a Six-Person Household
This proposal would cut approximately $180 million in benefits each year to about 80,000 larger households. In effect, this proposal would eliminate benefits to the 170,000 “extra” people who live in households larger than six people, and affect another 470,000 participants living in these large households. The Administration estimates this proposal would cut benefits to these families by $1.8 billion over ten years.
The SNAP maximum benefit is based on 100 percent of the cost of the Thrifty Food Plan and adjusted for household size, which provides larger families more benefits to help them buy food. Under the current policy, the maximum monthly benefit is $925 for a six-person household in the 48 contiguous states and Washington, D.C. in fiscal year 2017, or $154 per person.[13] Although the maximum benefit is higher for larger households, larger households get less benefit per person than smaller households. For example, in fiscal year 2015, households with six or fewer people received an average per-person monthly benefit of $126 in SNAP, while larger households received $103.
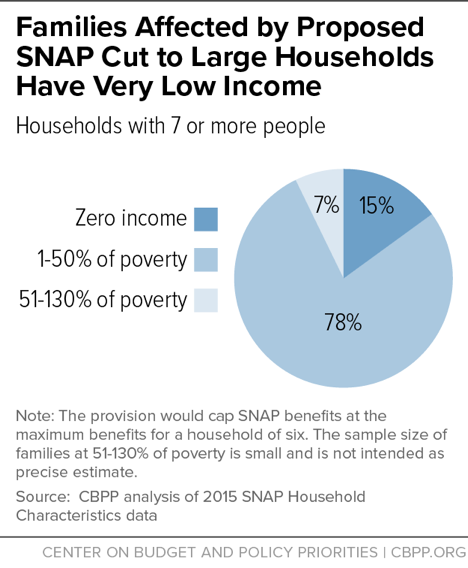
The proposal would target households with children. On average, households affected by this proposal have six children, including two preschool-age children. Children make up about three-quarters of participants in households affected. About a third of affected households are headed by a single parent, 40 percent are headed by married parents, and the rest of households are children living with other multiple adults. Most of these households have seven or eight members: 39 percent of households that would be affected have seven people and one-third have eight. The average household size is 8.2 people.
The larger households that would be affected by the proposal are extremely poor. (See Figure 1.) Their income averages 25 percent of the federal poverty line, the equivalent of $852 for an eight-person household each month in fiscal year 2017. On average, these households receive about $1,120 in monthly SNAP benefits. More than half of these households are working while receiving SNAP. On average, the proposal would cut about $190 in SNAP benefits per household each month.
The proposal would disproportionately affect states with a higher share of larger households. Nationally, the proposal would affect about 0.4 percent of SNAP households, and would eliminate benefits to a similar share of SNAP participants. At the state level, Alaska, Utah, and Guam would be hit hardest. In Alaska, about 4 percent of SNAP households have more than six people, and 14 percent of SNAP participants live in these households. The proposal would affect more than 1 percent of SNAP households and cut off 1.5 percent of SNAP participants in Alaska.[14] In particular, this proposal would disproportionately affect rural areas of Alaska. About 20 percent of Alaska SNAP households are in rural Alaska, while about half of the state’s households that this proposal would affect are in rural Alaska.[15] In addition to Alaska, this proposal would also cut off about 1 percent of SNAP participants in Utah and 3 percent in Guam.
Cutting Benefits to SNAP Households With Out-of-Pocket Utility Expenses
The budget includes three proposals that would restrict assistance to low-income households with utility bills. First, the budget proposes to eliminate the Low Income Home Energy Assistance Program (LIHEAP), a program that helps many low-income households offset a portion of their utility costs. LIHEAP currently provides roughly $3 billion a year in energy assistance to low-income households.[16] The budget also proposes to reduce SNAP benefits to households with out-of-pocket utility expenses through two separate proposals. In total, SNAP benefits to these low-income households would be cut by nearly $24 billion over ten years.
Eliminating the Connection Between LIHEAP and SNAP
By eliminating LIHEAP, the Administration would make it more difficult for LIHEAP participants to pay their heating and cooling bills. The elimination of LIHEAP would also result in fewer SNAP benefits for some households that participate in both programs due to the elimination of an administrative simplification.
When calculating how much disposable income a household has available to purchase food, SNAP provides deductions for certain expenses. One of the expenses taken into consideration is shelter costs, which includes out-of-pocket heating and cooling costs. Under federal rules, states simplify the process of capturing receipts for heating and cooling costs by opting to use a Standard Utility Allowance (SUA) in lieu of actual household utility expenses. Households with out-of-pocket heating or cooling costs qualify for the heating or cooling SUA, which can affect a household’s eligibility and benefit amount. Under federal law, states can further simplify the process by recognizing receipt of a LIHEAP payment as proxy for out-of-pocket heating or cooling costs. This is sensible as households determined by LIHEAP as eligible for energy assistance have demonstrated that they are unable to pay their utility bills.
If LIHEAP no longer exists, SNAP participants who are also LIHEAP participants will no longer be able to claim an SUA solely on the basis of proving their participation in LIHEAP. Some of these households will struggle to produce verification of their utility bills. They may be doubled up with other families and have informal arrangements to cover utilities. In other cases, states may be in a rush to process benefits and may not provide applicants with enough information about which expenses are most important to verify. In these cases, SNAP participants eligible to claim utility expenses would miss out and receive a smaller SNAP benefit.
USDA is proposing to amend SNAP law to recognize the proposed elimination of LIHEAP by severing this relationship between the two programs. Therefore, even if LIHEAP is not eliminated, SNAP households would lose this simplification. This proposal is estimated to save $13.3 billion over ten years. The savings would come almost entirely from cutting benefits to eligible SNAP participants (rather than terminating eligibility). An estimated 1 to 2 million households would lose about $100 a month in SNAP benefits, the vast majority of which have children, elderly, or members with a disability.
Eliminating State Flexibility to Set the Standard Utility Allowance
Currently, to establish Standard Utility Allowances states must annually submit a methodology to the USDA’s Food and Nutrition Service (FNS) for review and approval. Typically, states work with local utilities, or use consumer surveys and other data sources, to determine the local utility costs low-income consumers pay. Because utilities are regulated locally and the types of utilities, particularly for heating, vary dramatically by region, states play an important role in assessing the best data to use and at what level to set their SUA. Heating costs in the Northeast, which rely heavily on home heating oil, can vary significantly from costs in a community where natural gas or electricity are the primary means of providing heat. Setting a national methodology could generate winners and losers across states and regions.
SUA levels are intended to be set high enough to capture the cost of virtually all low-income consumers in order to ensure that few households lose benefits as a result of not documenting their actual utility bills. When participants believe that the standard fairly captures their typical expenses, they are much more likely to claim the standard in lieu of insisting that the state review all of their individual monthly bills — a more arduous and time-consuming process. Moreover, as a part of the 1996 welfare law, Congress permitted states to require households to use the SUA in order to simplify the program and reduce errors, taking away their ability to claim actual expenses if they exceed the SUA. As a result, when states have moved to the mandatory SUA, they have sought to set the standard at a level that would capture virtually all consumers.
The President’s budget proposes to restrict state flexibility in this area. It would “provide for a consistent approach nationally for determining [the heating and cooling SUA] levels by eliminating the variation in HCSUA methodologies that currently exists from State to State.” The Administration estimates that imposing a national methodology would reduce SNAP benefits to households claiming the SUA by $10.4 billion over ten years.
Proposed Retailer Fees Alter SNAP’s Public-Private Partnership
Currently retailers, i.e., grocery stores, supermarkets, and other food outlets that wish to participate in SNAP, must apply to participate, meet the program’s criteria, and pay for the equipment to process EBT transactions, but there is no fee to apply. Stores do incur program participation costs, such as training staff on the program rules, reporting information to FNS, and otherwise complying with the program’s requirements. But in addition to those costs, the President’s budget proposes that stores be required to pay an application fee to participate in the program. The Administration estimates that this fee will generate $252 million in fiscal year 2018 and a total of $2.357 billion over ten years.
The budget proposes scaling the fee from $250 for small retailers to up to $20,000 for super-centers and large supermarket chains (it’s not clear if the $20,000 fee would apply to one store or to multiple stores in a chain).
Currently 260,000 retailers are authorized to participate, ranging from small neighborhood corner stores, convenience stores, and local grocers to supercenters like Target and WalMart.[17] In 2016, FNS approved 26,300 retailers and reauthorized almost 38,700. Stores are currently required to reauthorize at least once every five years, and the budget would require them to pay a fee for that process as well.
Historically, the federal government has encouraged qualified retailers to participate to ensure that SNAP participants have adequate access to affordable food. Adding a recurring fee adds to the cost of becoming an authorized retailer and may have an impact on access. Some smaller stores, non-traditional retailers such as farmers’ markets, and stores operating in less lucrative markets may be deterred from participating in SNAP. Public and private efforts to address food deserts by encouraging and providing incentives to stores in underserved areas may be disproportionately affected as these retail efforts often operate on razor-thin margins, and the additional cost of an application fee could pose a real threat to the viability of these projects.
Administration’s Justifications for SNAP Cuts Are Based on Myths and Misinformation
Both the budget documents and statements made by Office of Management and Budget Director Mick Mulvaney demonstrate that the Administration’s arguments for SNAP cuts are based on misunderstandings and erroneous assumptions about the program and its participants. For example, in the press briefing about the budget, Director Mulvaney suggested that SNAP participation levels could be high because of “folks who are on there who don't want to work.”a The truth is that SNAP is a highly successful program that helps vulnerable people, including many workers, and that SNAP participation levels reflect both continued poverty and increased state effectiveness:
- SNAP helps vulnerable people and is well-targeted. Over 80 percent of SNAP households have income below the poverty line, and they receive 92 percent of SNAP benefits. Families with income modestly above the poverty line generally include members who are elderly or with disabilities or are working families with children, whose modest incomes do not provide sufficient income after accounting for expenses like housing and child care.
- SNAP caseloads are declining because of the economic recovery and return of the three-month time limit, but participation among those eligible remains above pre-recession levels. SNAP caseloads grew during the recession as more people became eligible due to increasing poverty from the recession, but also because a higher share of eligible individuals participated. States continued efforts begun before the recession to reach more eligible households by simplifying SNAP policies and procedures and by using modern application procedures like online applications. As a result, the share of eligible people participating in SNAP grew from 69 percent in 2007 to 83 percent in 2014.b While the number of people eligible for and participating in SNAP has been falling due to the improved economy, the share of eligible households that participate remains high compared to historic levels. This shows that the program is working better, not that there is a problem to address.
- Most individuals who can work, do work, but often in low-wage jobs; others face barriers to work or challenging job markets for their skills. Many workers participate in SNAP to help feed their families while they work in jobs with low wages, volatile hours, and no benefits such as paid sick leave. These jobs often have high turnover, and workers are likely to be eligible for SNAP for part of the year, often when their hours are cut or they lose their job. Because of this volatility, work rates for working-age adults who participate in SNAP are much higher over the year than in an average month while they are participating.c Other adults participating in SNAP may face barriers to work, such as lack of affordable child care or reliable transportation, or labor market disadvantages such as having low skills or a criminal record. Proposals to limit SNAP to this population without providing support to address these barriers would likely increase hardship without increasing work rates.
a White House Office of the Press Secretary, “Press Briefing on the FY2018 Budget,” May 23, 2017, https://www.whitehouse.gov/the-press-office/2017/05/23/press-briefing-fy2018-budget.
b Dottie Rosenbaum and Brynne Keith-Jennings, “SNAP Caseload and Spending Declines Accelerated in 2016,” Center on Budget and Policy Priorities, updated January 27, 2017, https://www.cbpp.org/research/food-assistance/snap-caseload-and-spending-declines-accelerated-in-2016.
c Brynne Keith-Jennings and Vincent Palacios, “SNAP Helps Millions of Low-Wage Workers,” Center on Budget and Policy Priorities, May 10, 2017, https://www.cbpp.org/research/food-assistance/snap-helps-millions-of-low-wage-workers.
Child Support Enforcement Measures
The President’s budget includes a package of proposals aimed at increasing child support collections, through the office of child support enforcement at the Department of Health and Human Services, by $2.6 billion over ten years. The Administration projects that an increase in collections of this magnitude would reduce federal SNAP costs by $206 million, presumably as a result of increased child support income for households with custodial parents. The budget also projects resulting savings from the child support provision for TANF and Supplemental Security Income.
Additional Visas for Afghans that Have Assisted U.S. Troops
The President’s budget includes a proposal to authorize additional Special Immigrant Visas (SIV) for Afghans. The SIV program provides visas to Iraqi and Afghan nationals who have worked with the U.S. Armed Forces as translators or interpreters. SIV recipients are eligible for the same benefits as refugees admitted through the U.S. Refugee Admissions Program. Therefore, the Administration’s proposal to increase the number of Special Immigrant Visas available to Afghans that have worked alongside the U.S. military would result in modest costs in SNAP.
Conclusion
SNAP is a highly effective program targeted to households that need its help to meet their basic food needs. With a small average benefit of just $1.40 per person per meal, it lifts millions out of poverty, and it has demonstrated long-term benefits for children that participate, including better health and education outcomes. While its overall enrollment and spending are coming down as the economy improves,[5][18] it provides vital assistance to over 40 million low-income Americans. The Administration has proposed to radically restructure SNAP, moving it from a national program with consistent benefit levels to one where states share in the costs and can cut benefits, undermining the program’s impact and effectiveness.
This shift in SNAP’s role as a national program and proposed cuts to food benefits for low-income unemployed, seniors, and families with children are in addition to another $2 trillion in proposed cuts to programs that help low- and moderate-income households make ends meet and access needed health care. And, at the same time it proposes these deep cuts to the safety net, the budget proposes massive tax cuts for the wealthy.[19][6]he budget proposal would damage our country’s response to the problems of hunger and poverty while further enriching the very wealthy.
| TABLE 2 | ||
|---|---|---|
| President Trump’s Proposed Budget Would Shift 25 Percent of SNAP Benefit Cost to States | ||
| State/Territory | 25 Percent of FY 2016 SNAP Benefit Cost (in millions) The magnitude of the average annual state contribution that would be required once the provision is fully in effect. Some states’ required contribution would be higher (and others lower) based on a formula. |
States’ Required Contribution to SNAP over 10 years (in millions)1 10-year cut assumed in the President’s budget for this provision ($116 billion) allocated to each state based on its share of 2016 SNAP benefits |
| Alabama | $314 | $2,186 |
| Alaska | $44 | $306 |
| Arizona | $351 | $2,442 |
| Arkansas | $144 | $1,006 |
| California | $1,809 | $12,607 |
| Colorado | $182 | $1,268 |
| Connecticut | $171 | $1,194 |
| Delaware | $55 | $384 |
| District of Columbia | $53 | $367 |
| Florida | $1,305 | $9,093 |
| Georgia | $666 | $4,639 |
| Hawaii | $121 | $843 |
| Idaho | $64 | $445 |
| Illinois | $760 | $5,297 |
| Indiana | $267 | $1,861 |
| Iowa | $127 | $884 |
| Kansas | $86 | $596 |
| Kentucky | $245 | $1,709 |
| Louisiana | $387 | $2,695 |
| Maine | $64 | $444 |
| Maryland | $270 | $1,880 |
| Massachusetts | $297 | $2,072 |
| Michigan | $542 | $3,776 |
| Minnesota | $151 | $1,050 |
| Mississippi | $204 | $1,419 |
| Missouri | $296 | $2,061 |
| Montana | $42 | $290 |
| Nebraska | $60 | $419 |
| Nevada | $157 | $1,097 |
| New Hampshire | $30 | $210 |
| New Jersey | $306 | $2,130 |
| New Mexico | $173 | $1,208 |
| New York | $1,231 | $8,574 |
| North Carolina | $562 | $3,917 |
| North Dakota | $20 | $137 |
| Ohio | $599 | $4,173 |
| Oklahoma | $221 | $1,543 |
| Oregon | $268 | $1,869 |
| Pennsylvania | $682 | $4,753 |
| Rhode Island | $68 | $475 |
| South Carolina | $306 | $2,129 |
| South Dakota | $36 | $252 |
| Tennessee | $418 | $2,913 |
| Texas | $1,327 | $9,247 |
| Utah | $75 | $526 |
| Vermont | $29 | $203 |
| Virginia | $292 | $2,037 |
| Washington | $363 | $2,531 |
| West Virginia | $125 | $869 |
| Wisconsin | $231 | $1,607 |
| Wyoming | $12 | $84 |
| Guam | $27 | $185 |
| Virgin Islands | $14 | $99 |
| United States2 | $16,649 | $116,000 |
| TABLE 3 | |||
|---|---|---|---|
| State-by-State Impact of President’s Budget Proposed SNAP Cuts: Eliminating Expanded Categorical Eligibility and Time-Limit Waivers |
|||
| Has the State Adopted the Expanded Categorical Eligibility Option?1 | Does the State Have Waivers from the Three-Month Time Limit? | ||
| State/Territory | Asset Test | Income Test | |
| Alabama | Yes | ||
| Alaska | Yes | ||
| Arizona | Yes | Yes | Yes |
| Arkansas | |||
| California | Yes | Yes | Yes |
| Colorado | Yes | Yes | |
| Connecticut | Yes | Yes | Yes |
| Delaware | Yes | Yes | |
| District of Columbia | Yes | Yes | Yes |
| Florida | Yes | Yes | |
| Georgia | Yes | Yes | |
| Hawaii | Yes | Yes | Yes |
| Idaho | Yes | Yes | |
| Illinois | Yes | Yes | Yes |
| Indiana | |||
| Iowa | Yes | Yes | |
| Kansas | |||
| Kentucky | Yes | Yes | |
| Louisiana | Yes | ||
| Maine | Yes | Yes | |
| Maryland | Yes | Yes | Yes |
| Massachusetts | Yes | Yes | Yes |
| Michigan | Yes | Yes | Yes |
| Minnesota | Yes | Yes | Yes |
| Mississippi | Yes | ||
| Missouri | |||
| Montana | Yes | Yes | Yes |
| Nebraska | Yes | ||
| Nevada | Yes | Yes | Yes |
| New Hampshire | Yes | Yes | Yes |
| New Jersey | Yes | Yes | Yes |
| New Mexico | Yes | Yes | Yes |
| New York | Yes | Yes | Yes |
| North Carolina | Yes | Yes | |
| North Dakota | Yes | Yes | Yes |
| Ohio | Yes | Yes | |
| Oklahoma | Yes | ||
| Oregon | Yes | Yes | Yes |
| Pennsylvania | Yes | Yes | Yes |
| Rhode Island | Yes | Yes | Yes |
| South Carolina | Yes | ||
| South Dakota | Yes | ||
| Tennessee | Yes | ||
| Texas | Yes | Yes | |
| Utah | Yes | ||
| Vermont | Yes | Yes | Yes |
| Virginia | Yes | ||
| Washington | Yes | Yes | Yes |
| West Virginia | Yes | Yes | |
| Wisconsin | Yes | Yes | |
| Wyoming | |||
| Guam | Yes | Yes | Yes |
| Virgin Islands | Yes | Yes | Yes |
| United States | 42 | 31 | 36 |
| TABLE 4 | |||
|---|---|---|---|
| State-by-State Impact of President’s Budget Proposed SNAP Cuts: Eliminating the Minimum Benefit |
|||
| Number Receiving Minimum Benefit in 2015 |
Annual SNAP Cut based on Minimum Benefit in 2015 |
||
| State/Territory | Households | Individuals | |
| Alabama | 25,000 | 27,000 | -$4,265,000 |
| Alaska | 4,000 | 4,000 | -$764,000 |
| Arizona | 32,000 | 43,000 | -$5,625,000 |
| Arkansas | 17,000 | 17,000 | -$2,717,000 |
| California | 79,000 | 110,000 | -$14,484,000 |
| Colorado | 13,000 | 15,000 | -$1,930,000 |
| Connecticut | 12,000 | 15,000 | -$2,054,000 |
| Delaware | 6,000 | 8,000 | -$1,141,000 |
| District of Columbia | 9,000 | 10,000 | -$1,577,000 |
| Florida | 114,000 | 139,000 | -$18,629,000 |
| Georgia | 58,000 | 67,000 | -$10,367,000 |
| Hawaii1 | 1,000 | 1,000 | -$335,000 |
| Idaho | 5,000 | 5,000 | -$767,000 |
| Illinois | 71,000 | 81,000 | -$12,400,000 |
| Indiana | 24,000 | 26,000 | -$3,794,000 |
| Iowa | 23,000 | 27,000 | -$3,958,000 |
| Kansas | 8,000 | 10,000 | -$1,317,000 |
| Kentucky | 22,000 | 23,000 | -$3,641,000 |
| Louisiana | 17,000 | 19,000 | -$3,018,000 |
| Maine | 11,000 | 14,000 | -$2,029,000 |
| Maryland | 40,000 | 51,000 | -$7,039,000 |
| Massachusetts | 32,000 | 42,000 | -$5,635,000 |
| Michigan | 75,000 | 89,000 | -$11,491,000 |
| Minnesota | 28,000 | 33,000 | -$5,141,000 |
| Mississippi | 14,000 | 16,000 | -$2,517,000 |
| Missouri | 22,000 | 26,000 | -$3,637,000 |
| Montana | 4,000 | 4,000 | -$636,000 |
| Nebraska | 7,000 | 7,000 | -$1,023,000 |
| Nevada | 23,000 | 29,000 | -$4,222,000 |
| New Hampshire | 5,000 | 6,000 | -$773,000 |
| New Jersey | 44,000 | 51,000 | -$7,253,000 |
| New Mexico | 11,000 | 12,000 | -$1,962,000 |
| New York | 79,000 | 97,000 | -$13,996,000 |
| North Carolina | 106,000 | 136,000 | -$19,120,000 |
| North Dakota1 | 2,000 | 2,000 | -$278,000 |
| Ohio | 77,000 | 92,000 | -$13,300,000 |
| Oklahoma | 23,000 | 25,000 | -$3,476,000 |
| Oregon | 47,000 | 57,000 | -$8,727,000 |
| Pennsylvania | 64,000 | 75,000 | -$11,217,000 |
| Rhode Island | 6,000 | 7,000 | -$1,022,000 |
| South Carolina | 28,000 | 30,000 | -$4,980,000 |
| South Dakota1 | 2,000 | 2,000 | -$267,000 |
| Tennessee | 42,000 | 45,000 | -$6,826,000 |
| Texas | 100,000 | 121,000 | -$16,338,000 |
| Utah | 5,000 | 6,000 | -$788,000 |
| Vermont | 3,000 | 3,000 | -$459,000 |
| Virginia | 28,000 | 31,000 | -$4,359,000 |
| Washington | 48,000 | 54,000 | -$8,548,000 |
| West Virginia | 19,000 | 24,000 | -$3,178,000 |
| Wisconsin | 73,000 | 91,000 | -$13,573,000 |
| Wyoming1 | 1,000 | 1,000 | -$136,000 |
| Guam1 | Less than 1,000 | Less than 1,000 | -$65,000 |
| Virgin Islands1 | Less than 1,000 | 1,000 | -$110,000 |
| United States2 | 1,610,000 | 1,931,000 | -$276,905,000 |
End Notes
[1] The estimates of the size of the cuts throughout this paper are based on the Fiscal Year 2018 Budget of the U.S. Government at https://www.whitehouse.gov/sites/whitehouse.gov/files/omb/budget/fy2018/budget.pdf; the “Explanatory Notes” the Department of Agriculture (USDA) provides to the Congress, available at http://www.obpa.usda.gov/32fnsexnotes2018.pdf; and the Department of Health and Human Services (HHS) Congressional Justification, available at https://www.acf.hhs.gov/olab/budget. On July 13, 2017, the Congressional Budget Office published its estimates of the President’s 2018 Budget proposals for the Supplemental Nutrition Assistance Program at https://www.cbo.gov/publication/52903
[2] The share would start at 10 percent in 2020 and phase up to 25 percent beginning in 2023. SNAP disaster benefits would continue to receive 100 percent federal funding.
[3] The Administration’s estimate of $116 billion in cuts over ten years calculates the state share based on SNAP benefits before the other cuts in the budget are taken into account. If the other cuts are taken into account first, the total cut attributable to mandating states to pay a share of SNAP benefits would be lower: about $105 billion. Though, as discussed below, the Administration’s estimates of the cuts from this provision are likely far too low because they assume every state will be able to pay its entire share.
[4] The budget documents provide that states would be allowed “new flexibility regarding benefit levels,” which we interpret to mean that they could cut SNAP maximum benefits across the board, but could not eliminate eligibility for specific groups. Under current law, changes to SNAP maximum benefit levels do not affect households that receive the minimum benefit, but because another provision of the budget eliminates the minimum benefit every remaining SNAP household would experience a benefit cut.
[5] Megan Stanley, Ife Floyd and Misha Hill, “TANF Cash Benefits Have Fallen by More Than 20 Percent in Most States and Continue to Erode,” Center on Budget and Policy Priorities, October 17, 2016, https://www.cbpp.org/research/family-income-support/tanf-cash-benefits-have-fallen-by-more-than-20-percent-in-most-states.
[6] Calculation assumes the family only has earned income and claims the $155 standard deduction, the 20 percent earned income deduction, and has $1,110 in monthly shelter costs (the median value for working households of three with children that have incomes at or above 125 percent of poverty based on the fiscal year 2015 SNAP Household Characteristics data.)
[7] For SNAP, states include the 50 states plus the District of Columbia, Guam, and the Virgin Islands.
[8] This estimate is based on CBPP calculations using the Administration’s estimate of the average annual savings from the provision divided by 12, divided by an average monthly benefit of $180.
[9] Steven Carlson, Dorothy Rosenbaum, and Brynne Keith-Jennings, “Who Are the Low-Income Childless Adults Facing the Loss of SNAP in 2016?” Center on Budget and Policy Priorities, February 8, 2016, https://www.cbpp.org/research/food-assistance/who-are-the-low-income-childless-adults-facing-the-loss-of-snap-in-2016 .
[10] Patrick Gillespie, “Trump budget proposes 40% cut to job training programs,” CNNMoney, May 24, 2017, http://money.cnn.com/2017/05/24/news/economy/trump-budget-job-training-programs/index.html.
[11] Ed Bolen and Stacy Dean, “Waivers Add Key State Flexibility to SNAP’s Three-Month Time Limit,” Center on Budget and Policy Priorities, March 24, 2017, https://www.cbpp.org/research/food-assistance/waivers-add-key-state-flexibility-to-snaps-three-month-time-limit.
[12] Alaska, Hawaii, Guam, and the Virgin Islands have a higher minimum benefit than the other 48 states. See https://www.fns.usda.gov/sites/default/files/snap/FY17-Minimum-Allotments.pdf.
[13] In fiscal year 2017, the maximum benefit for a six-person household is $1,364 in Guam, $1,189 in Virgin Islands, $1,608 in Hawaii, $1,127 in Urban Alaska, $1,437 in Alaska Rural I, and $1,749 in Alaska Rural II. The information is available at https://www.fns.usda.gov/snap/cost-living-adjustment-cola-information.
[14] Due to small sample size of larger households at the state level, the analysis used pooled SNAP Households Characteristics data for fiscal years 2011-2015.
[15] Due to small sample size of larger households at sub-state level, the analysis used pooled SNAP Households Characteristics data for fiscal years 2008-2015. Rural Alaska is defined by the Alaska Department of Health and Social Services. See http://dpaweb.hss.state.ak.us/main/manual/FSP/addendum1.pdf.
[16] In fiscal year 2015, states provided an estimated $2.9 billion in heating, cooling, crisis, and weatherization and energy-related repair assistance to low-income households. The total funding, including grants to tribes and territories, was $3.4 billion for 2017. Department of Health and Human Services, Fiscal Year 2018 Justification for Appropriations Committees, https://www.acf.hhs.gov/sites/default/files/olab/acf_master_cj_508_compmay_21_2017.pdf.
[17] USDA provides a listing of all retailers: https://www.fns.usda.gov/snap/retailerlocator. Basic information about retailer participation in the program is provided here: https://www.fns.usda.gov/snap-retailer-data.
[18] Dottie Rosenbaum, “SNAP Caseloads and Spending Declines Track CBO Projections,” Center on Budget and Policy Priorities, May 22, 2017, https://www.cbpp.org/blog/snap-caseloads-and-spending-declines-track-cbo-projections.
[19] Robert Greenstein, “Greenstein: Trump Budget Proposes a Path to a New Gilded Age,” Center on Budget and Policy Priorities, May 22, 2017, https://www.cbpp.org/press/statements/greenstein-trump-budget-proposes-path-to-a-new-gilded-age.
More from the Authors

Areas of Expertise

Areas of Expertise

Areas of Expertise

Areas of Expertise