2016 Appropriations Placed Low Priority on Low-Income Programs; Better Priorities Needed for 2017
The 2016 appropriations legislation enacted in December included a number of beneficial funding increases, but programs that assist households with low or moderate incomes fared considerably worse than others, on balance.
The legislation provided a significant increase for both defense and non-defense programs, made possible by October’s bipartisan budget agreement, which rolled back part of the cuts imposed under the Budget Control Act of 2011 (BCA). But even with this increase, Overall non-defense appropriations for 2016 remained well below their 2010 level.overall non-defense appropriations for 2016 remained well below their 2010 level, after adjusting for inflation.
Moreover, congressional decisions about how to allocate the boost in non-defense funding gave the appropriations subcommittees responsible for most low-income programs considerably smaller increases than most other subcommittees. Overall, low-income appropriated programs received less than half the average increase given to other non-defense programs.
The allocation of funding will be even more important for 2017, when the budget agreement doesn’t allow any overall increase above 2016 levels. If Congress gives low-income programs the same low priority in 2017 as in 2016, they could face cuts.
Low-Income Programs Received Disproportionately Small Share of 2016 Increase
For the past five years, appropriations have been governed by the BCA, which placed tight annual caps on overall defense and non-defense funding through 2021 and created a “sequestration” mechanism that substantially lowered those caps when policymakers failed to agree on other deficit-reduction measures in the fall of 2011. In the Bipartisan Budget Act of 2015, Congress and the President agreed to substitute alternate deficit-reduction measures for most (but not all) of the sequestration cuts for 2016 and 2017, thereby raising the appropriations caps set in the BCA for those two years closer to pre-sequestration levels.[1] That agreement also specified increased appropriations for Overseas Contingency Operations (OCO), which are funded outside the BCA caps. (See Appendix.)
As always, the first step in translating the newly agreed-on totals for 2016 into program-by-program funding levels was to allocate the overall defense and non-defense amounts among the 12 Appropriations subcommittees, each of which handles one of the 12 regular annual appropriations bills.[2] This was an informal process, led by the Committees’ Republican majority. The allocations are probably the single most important decision in the appropriations process, since they determine how much total funding will be available for the agencies that each subcommittee handles.
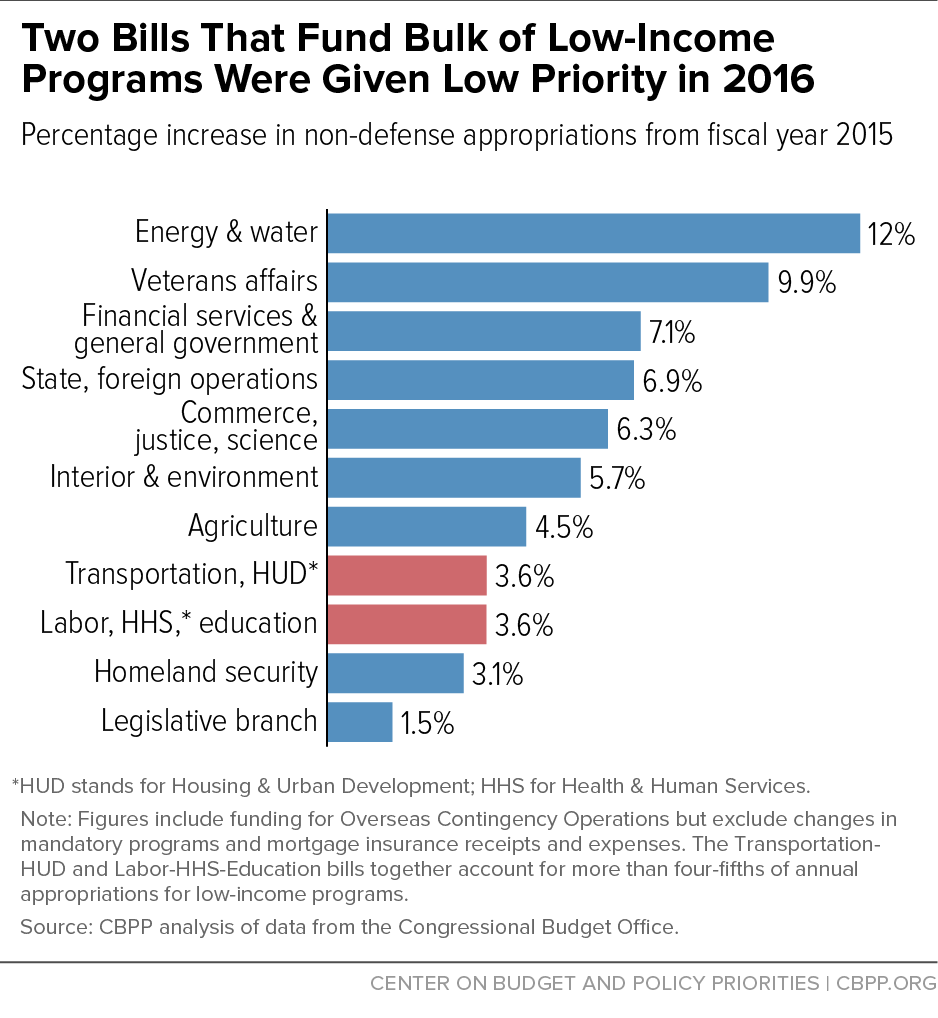
The appropriators allocated the available non-defense funds among the 11 subcommittees with non-defense responsibilities in a way that shortchanged low-income and other social programs (see Figure 1).[3]
-
The two subcommittees that together handle more than four-fifths of all appropriations for low-income programs — those for a) the Departments of Labor, Health & Human Services (HHS), and Education, and b) the Departments of Transportation and Housing & Urban Development (HUD) — each received an increase of 3.6 percent for 2016 relative to their 2015 funding levels.
-
The other nine subcommittees received an average increase of 6.9 percent.
-
Of the 11 non-defense subcommittees, Labor-HHS-Education and Transportation-HUD ranked eighth and ninth lowest in percentage increase above their 2015 levels.
Further, an analysis of funding for all low-income appropriated programs, including those funded by other appropriations bills, indicates that their increases averaged about 3.0 percent in 2016, less than half the average for other non-defense funding.
2016 Allocations Left Key Needs Unmet
The low priority that the House and Senate appropriators gave to these subcommittees had significant consequences.
Housing and Urban Development
Funding for low-income rental assistance remains far below need. Homelessness is a large and persistent problem, exacerbated by the growing gap between household incomes and rental costs.[4] Only about one in four low-income families eligible for rental assistance receives it, and waiting lists are long in most parts of the country. Sequestration worsened the problem, forcing state and local housing agencies to cut the number of families they provided with housing vouchers by about 100,000 by mid-2014.
Modest funding increases in 2014 and 2015 enabled agencies to restore roughly a third of the lost vouchers. The President’s 2016 budget requested funding to restore the remaining 67,000 lost vouchers[5] and $295 million to create 25,000 new units of supportive housing for people with serious disabilities who have experienced long-term or repeated bouts of homelessness. Yet the final 2016 appropriations package restored only a small fraction of the lost vouchers — about 8,000, for homeless veterans — and $38 million for a new initiative to reduce youth homelessness. These are small steps in the right direction, but Congress missed an opportunity to make more substantial progress in reducing homelessness.
Labor-HHS-Education
The final 2016 appropriations legislation increased some key Labor-HHS-Education programs substantially, such as Head Start (up 6.6 percent) and child care (up 13.4 percent). But it raised education for disadvantaged students by just 3.1 percent and formula grants for job training by just 3.3 percent, leaving those programs 10 percent and 18 percent, respectively, below their levels six years ago, after adjusting for inflation. It provided no increase at all for financial aid to college students.
Cuts Likely in Some Areas in 2017
The Bipartisan Budget Act of 2015 also set overall defense and non-defense funding limits for 2017. As always, the allocation of these amounts among the appropriations subcommittees will be key to determining funding for low-income assistance and other important programs. If anything, the allocations will be more critical in 2017 because funding will be tighter than in 2016.
For 2017, the budget agreement holds total defense and non-defense appropriations at essentially the 2016 level. But within this flat total, policymakers will almost certainly want to raise funding for some high-priority non-defense needs, such as veterans’ medical care, to reflect rising costs. Appropriations for veterans’ medical care are made largely in advance, in the prior year’s bill, and Congress has already enacted an increase of more than $4 billion to take effect in 2017. At the same time, receipts from sources like mortgage insurance programs that are credited to appropriations bills are likely to continue to fall. Since these receipts help offset the cost of spending in the bill, lower receipts means less can be spent on programs.
To stay within the flat caps despite these factors, policymakers will need to make cuts or find other offsetting savings. In that situation, reasonable and equitable allocations will be crucial to avoid placing undue burdens on low-income assistance and other programs serving important needs.
Appendix
The Numbers Used in This Paper
The totals used in this paper include all non-defense funding available under the BCA caps plus all non-defense OCO funding. We include appropriations for OCO, even though they are not subject to the caps, because the line between OCO and regular appropriations is becoming increasingly blurred, given the increased funding specified in the Bipartisan Budget Act of 2015. When OCO is included in both years, the increase in total non-defense appropriations between 2015 and 2016 is 6.3 percent.
Further, in order to focus on programmatic changes, we adjust the numbers for subcommittees (and groups of subcommittees) to remove the effects of certain offsetting savings from changes in mandatory programs (often referred to as “CHIMPs”) and from receipts from federal mortgage insurance programs. The net amount of these offsets decreased by $2.7 billion in 2016. Excluding the CHIMPs and mortgage insurance receipts, the programmatic increase in non-defense appropriations was 5.5 percent from 2015 to 2016.
Table 1 summarizes these basic elements of non-defense appropriations for 2015 through 2017.
| TABLE 1 | ||||
|---|---|---|---|---|
| Non-Defense Discretionary Appropriations, in billions | ||||
| 2015 | 2016 | 2017 | ||
| BCA caps after sequestration (before BBA 2015)* | 492.4 | 493.5 | 503.5 | |
| Cap increase | 25.0 | 15.0 | ||
| BCA caps (post-BBA 2015)* | 492.4 | 518.5 | 518.5 | |
| Non-defense OCO | 9.3 | 14.9 | 14.9 | |
| Changes in mandatory programs (CHIMPs)** | -20.2 | -18.6 | NA | |
| Mortgage insurance*** | -9.6 | -8.5 | NA | |
| Funding with OCO, excluding CHIMPs and mortgage insurance | 531.4 | 560.5 | NA | |
End Notes
[1] Robert Greenstein, “Budget Deal, Though Imperfect, Represents Significant Accomplishment and Merits Support,” Center on Budget and Policy Priorities, October 27, 2015, https://www.cbpp.org/press/statements/greenstein-budget-deal-though-imperfect-represents-significant-accomplishment-and.
[2] Subcommittee allocations are key even when Congress combines final appropriations measures into a single omnibus package, as in 2016. Such packages are still fundamentally collections of individual bills, each worked out primarily by the members and staff of the relevant subcommittee based on the total spending amount allocated to the subcommittee.
[3] See Appendix for information on the basis of the numbers in Figure 1, which include all non-defense OCO and exclude certain offsets in order to focus on changes in programmatic spending levels.
[4] Ehren Dohler, “More People in Homeless Shelters Last Year,” Center on Budget and Policy Priorities, November 25, 2015, https://www.cbpp.org/blog/more-people-in-homeless-shelters-last-year; Alicia Mazzara, “New Census Data Show Rising Rents, Weak Income Growth,” Center on Budget and Policy Priorities, September 18, 2015, https://www.cbpp.org/blog/new-census-data-show-rising-rents-weak-income-growth.
[5] Barbara Sard, “Obama Budget Restores Lost Housing Vouchers,” Center on Budget and Policy Priorities, February 2, 2015, https://www.cbpp.org/blog/obama-budget-restores-lost-housing-vouchers.
More from the Authors

Areas of Expertise