Despite Deep Recession and High Unemployment, Government Efforts — Including the Recovery Act — Prevented Poverty from Rising in 2009, New Census Data Show
Despite a deep recession, very high unemployment, and widespread hardship, a combination of existing safety net programs and temporary expansions in them enacted in 2009 all but prevented a rise in the poverty rate that year, according to a Center analysis of new poverty data the U.S. Census Bureau released this week that includes the effects of non-cash benefits and tax credits. This is a remarkable achievement; poverty usually burgeons in major recessions.
These findings come to light at an important time — just as Congress prepares for a major debate on the role of government in addressing economic and social problems.
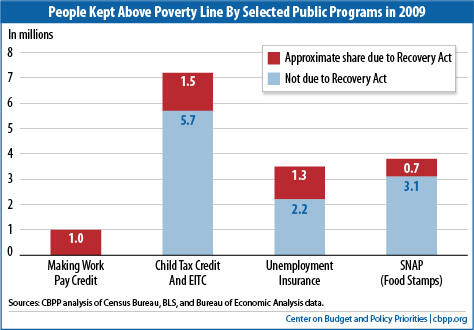
The poverty protection came partly from existing programs — such as unemployment insurance, assistance programs for low-income households, and tax credits for low-income working families. But the bulk of the poverty protection came from improvements that the 2009 Recovery Act (ARRA) made in various programs. Although the Recovery Act was designed chiefly to bolster a collapsing economy, it generated the important side effect of protecting millions of families against poverty and massive income losses. Center analysis of the new Census data shows that the Recovery Act kept more than 4.5 million people out of poverty in 2009: 1.3 million people through extensions and expansions of federal unemployment benefits, 1.5 million people through improvements in the Child Tax Credit and Earned Income Tax Credit, nearly 1 million people through the Making Work Pay tax credit, and another 700,000 people through an increase in benefit levels for the SNAP program (previously called food stamps).
The impact of these programs helps to explain why, under the “alternative” poverty measures that the Census Bureau released yesterday — which count non-cash benefits like food stamps and tax credits and which most analysts consider superior to the official poverty measure — poverty did not rise between 2008 and 2009, even as the economy fell deeper into recession, unemployment increased sharply, and many Americans lost their homes to foreclosure. The official poverty measure misses these effects because it counts only conventional cash income and does not reflect the income that non-cash benefits and tax credits provide.
The Census Bureau’s Findings
Yesterday, the Census Bureau issued eight alternative poverty measures that reflect poverty-measurement recommendations that a blue-ribbon National Academy of Sciences (NAS) panel made in the mid-1990s.[1] Most experts strongly prefer these NAS measures over the Census Bureau’s official poverty measure. All but one of the NAS measures tell the same story: the poverty rate in 2009 was statistically indistinguishable from the rate in 2008.
Under the measure most similar to the NAS panel’s recommendations, for example, 15.7 percent of Americans were poor in 2009, not statistically distinguishable from the 15.8 percent rate in 2008. Under one of the eight NAS measures, the poverty rate did rise a statistically significant amount — by 0.4 percentage points — but even that was far less than the increase shown in the official poverty measure, which rose 1.1 percentage points, from 13.2 percent in 2008 to 14.3 percent in 2009. [2]
Why Are the Alternative Poverty Rates Flat? The Role of the Recovery Act
The Center analyzed the household-level survey files that the Census Bureau released this week to determine the impact on poverty of seven provisions in the Recovery Act: three tax credits (the new Making Work Pay tax credit and improvements to the Child Tax Credit and Earned Income Tax Credit); temporary expansions in SNAP benefits; two unemployment insurance provisions; and a one-time payment for people who are elderly or have serious disabilities and receive benefits through Social Security, the Supplemental Security Income program, veterans’ compensation, or the Railroad Retirement program. The methodology for this analysis is discussed in the appendix.
These seven Recovery Act provisions kept more than 4.5 million people from falling below the poverty line in 2009. In other words, without these provisions, over 4.5 million more people would have been poor.
These findings indicate that the Recovery Act is one of the single most effective pieces of legislation at preventing poverty to be enacted in decades. No program other than Social Security and the EITC kept this many people above the poverty line in 2009. (Social Security kept more than 20 million people out of poverty; the EITC kept 5 million out of poverty.)
Moreover, given that the EITC and most other programs are the result of gradual expansions under several different laws, it is difficult to think of a single piece of legislation since the Social Security Act of 1935 that kept more people above the poverty line in 2009 through direct assistance to households than the Recovery Act.
The flat poverty rate in 2009 does not mean, however, that 2009 was a good year for low-income families or that government assistance staved off all or even most recession-related hardship. To the contrary. Neither the official poverty rate nor the alternative poverty measures capture the financial losses of families whose incomes dropped from comfortable levels to only slightly above the poverty line, or of working-poor families that lost wages and fell deeper into poverty. Nor do these measures capture rising homelessness, foreclosures, or the depletion of retirement savings. But these figures do indicate that government assistance shielded the incomes and buying power of millions of families and individuals enough to keep them above the poverty line, despite the sharpest deterioration in the economy in many years. That is no small accomplishment.
METHODOLOGICAL APPENDIX
To determine the poverty-reducing impact of specific programs, the Center defined persons as poor if their annual family income, counting non-cash benefits and taxes, was below the official Census poverty threshold. Non-cash benefits here are SNAP benefits and housing assistance. Taxes are federal and state income and payroll taxes net of tax credits. Data are from the public use file of the Census Bureau’s Current Population Survey (CPS) 2010 Annual Social and Economic Supplement and refer to income year 2009.
Under this measure, 33.3 million Americans, or 11 percent, were below the poverty line in 2009, counting all assistance from the Recovery Act and other sources. Without the seven Recovery Act provisions we consider, an estimated 37.9 million would be below the poverty line.
| Persons in Families with Income (After Taxes, SNAP Benefits, and Housing Assistance) Below the Poverty Line, 2009 | ||
| Number | Percent | |
| All Ages | 33,355,000 | 11.0% |
| Under 18 Years | 10,195,000 | 13.7 |
| Age 65 and Older | 2,905,000 | 7.5 |
| Source: CBPP analysis of Census data. | ||
This is not necessarily the ideal measure of poverty. In fact, NAS-based measures released by Census are more comprehensive and are preferred by most experts. Federal statistical agencies are developing a further refinement of the NAS measures known as the Supplemental Poverty Measure.) We use it here, however, because it is quick to calculate, easy to explain, and uses a familiar poverty line. [3]
We consider persons to be kept above the poverty line by a program if their family’s income not counting that program was below the poverty line in 2009 but their income counting that program was above the line.
We estimate the poverty-reducing impact of seven temporary components of the Recovery Act. These included three tax credits (the Making Work Pay Tax Credit, which provided up to $800 per worker; an improvement to the Child Tax Credit that provided up to $1,433 more for a working family with near-minimum-wage earnings; and an expansion in the Earned Income Tax Credit for married couples and families with three or more children); two unemployment insurance provisions (an additional $25 per week in of unemployment benefits plus continuation of the temporary federal Emergency Unemployment Compensation program created in 2008 for long-term jobless workers who had exhausted their unemployment benefits); a 13.6 percent increase in maximum benefits in the Supplemental Nutritional Assistance Program (SNAP); and a one-time $250 Economic Recovery Payment for recipients of Social Security, Supplemental Security Income, veterans’ disability compensation and Railroad Retirement benefits.
We estimate the effect of each of these provisions on poverty as follows:
Making Work Pay Tax Credit. Census provides on the CPS public use file an estimate of the value of this credit for each individual, which we use.[4]
Improved Child Tax Credit (CTC) and Earned Income Tax Credit (EITC). Census provides an estimate of the total value of the CTC and EITC in 2009 but does not separately show the portion that represents the Recovery Act’s improvements. Therefore, we use income data available on the public use file to make our own calculation of each person’s taxes and tax credits, both with and without the Recovery Act improvements. The difference between the credit value with and without these improvements constitutes the effect of the Recovery Act. Our estimates closely match the Census estimates of the total value of the credits in terms of their impact on poverty:
- The total Child Tax Credit kept 1.67 million people above the poverty line in 2009 according to Census estimates, and 1.63 million people according to our own. Without the Recovery Act’s CTC improvements, our estimate falls to 0.51 million people, indicating that those improvements kept 1.1 million people above the poverty line.
- The EITC as a whole kept 5.0 million people above the poverty line in 2009 according both to Census estimates and to our own. Without the Recovery Act’s improvements, our estimate falls to 4.7 million people, indicating that those improvements had an anti-poverty effect of 0.3 million.
Additional $25 per week in unemployment benefits. For every person who reports receiving unemployment benefits during the year, we add $25 for each week of unemployment reported (not to exceed the total value of unemployment compensation reported).
Additional weeks of eligibility for unemployment benefits. For most survey participants with unemployment income, the CPS does not provide enough information about the duration and timing of their unemployment spells to identify eligibility for this provision. However, we can identify eligibility among certain long-term unemployed workers in the survey — those whose unemployment spell in 2009 persisted until the following March, when they were interviewed for the CPS.[5] We use information about these unemployed workers to determine that, for every 100 such workers who received long-term unemployment benefits under the Recovery Act, about 24 persons (including family members of the workers) were kept above the poverty line by that income. We
apply this ratio to the 5.38 million workers who, according to Labor Department data, started receiving long-term jobless benefits between April and December of 2009. The result indicates that
| Impact Of Programs As A Whole, Not Limited To Recovery Act Persons with Income Below Poverty by Selected Definitions of Income, 2008 and 2009 | |||
| 2008 | 2009 | ||
| Income After Taxes, SNAP, and Housing Assistance | 32,440,000 | 33,355,000 | |
| All Income Sources in Row 1 Except for: | |||
| Social Security | 52,956,000 | 54,595,000 | |
| SSI | 34,776,000 | 35,998,000 | |
| Unemployment compensation | 33,494,000 | 36,847,000 | |
| SNAP | 35,307,000 | 37,157,000 | |
| Housing assistance | 33,982,000 | 34,819,000 | |
| Taxes and recovery payments | 36,213,000 | 38,571,000 | |
| Impact on Poverty of: | |||
| Social Security | 20,516,000 | 21,240,000 | |
| SSI | 2,336,000 | 2,643,000 | |
| Unemployment compensation | 1,054,000 | 3,492,000 | |
| SNAP | 2,867,000 | 3,802,000 | |
| Housing assistance | 1,542,000 | 1,464,000 | |
| Taxes and recovery payments | 3,773,000 | 5,216,000 | |
| Source: CBPP analysis of Census data. | |||
1.3 million people were kept above the poverty line by these benefits. Before the Recovery Act, they would not have been eligible for this help.
Higher SNAP benefits. For families that report receiving SNAP benefits, we multiply the expected monthly benefit increase specified by the Recovery Act by the number of months of SNAP receipt. (We cap the result so it does not exceed the family’s reported total SNAP income.) The expected monthly benefit increase is $61 for a family of four and varies by family size.[6]
Economic Recovery Payments. These are calculated by the Census Bureau and provided on the CPS public use file. The payments kept 40,000 people above the poverty line, an amount we do not show separately but do include in our total estimated effect of the Recoverty Act.
The resulting estimates are preliminary. They may increase once more accurate data become available regarding participation levels in Recovery Act programs. Census data tend to miss some government assistance as a result of recall difficulties and underreporting by survey respondents, which can sometimes be substantial. An early Center calculation, undertaken before actual 2009 income or participation data were available, projected that about 6 million people would be lifted above an NAS-style poverty line in 2009 by the same seven provisions examined here. [7] That analysis is based on data that correct for underreporting. However, corrections for underreporting in 2009 may not be available for a number of years.
End Notes
[1] These NAS poverty measures differ from the official poverty measure in three significant ways. First, they count more income sources, including tax credits and non-cash benefits such as SNAP assistance; the official measure counts only cash income. Second, they subtract certain expenses such as taxes owed and out-of-pocket medical expenditures and work expenses such as child care. Third, they employ a slightly updated poverty line.
[2] The Census Bureau also released alternative poverty rates from an earlier, non-NAS series. These data similarly show that, when one accounts for taxes and non-cash benefits such as food stamps and housing assistance, the poverty rate was statistically unchanged between 2008 and 2009. In particular, under this measure (known as R&D measure 14a), the poverty rate stood at 10.4 percent in 2009, not significantly different than in 2008 (when it stood at 10.2 percent). Unlike the NAS measures, this measure does not subtract work expenses or out-of-pocket medical expenditures and uses the official poverty line.
[3] The measure used in this analysis differs slightly in a number of ways from the Census Bureau’s Measure 14a, referenced in footnote 2. For example, that measure includes an adjustment for the value of homeownership (the estimated annuity value of home equity). We use a simpler definition to facilitate interpretation of the results.
[4] The Census Bureau counts tax credits as income in the tax year for which they are filed, even if the family receives them in the following year, a practice we also follow.
[5] We identify unemployment compensation recipients whose long-term unemployment spells began between April and December of 2009, based on complete data on the length of the worker’s current unemployment spell, reported in the monthly basic CPS file for March 2010. In general we count the participant’s 27th through 80th weeks of unemployment in 2009 as eligible for Recovery Act assistance because regular state unemployment benefits run out after 26 weeks. (The eligibility period starts later in states that would have provided more than 26 weeks of assistance under Extended Benefit rules in effect in the month before the Act was passed.) We assume that participants received $290 per week of participation, which is about average for participants as reported by the Labor Department.
[6] We calculate the expected monthly increase as one-twelfth of the maximum annual increase. For a family of four, the maximum annual increase for 2009 was $0 per month from January through March (before the Act took effect), $80 per month from April to September, and $85 per month from October to December, yielding an average of $61 per month.
[7] Arloc Sherman, “Stimulus Keeping 6 Million Americans Out of Poverty in 2009, Estimates Show,” Center on Budget and Policy Priorities, September 9, 2009, www.cbpp.org/files/9-9-09pov2.pdf.
More from the Authors
