Poverty and Share of Americans Without Health Insurance Were Higher in 2007 - And Median Income for Working-Age Households Was Lower - Than at the Bottom of Last Recession
For Poverty Rate and Non-Elderly Median Income, Worst Performance on Record For Any Six Years of Economic Growth
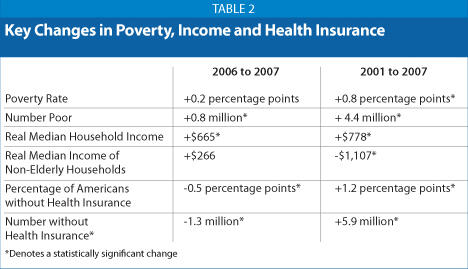
The number of Americans in poverty climbed by 816,000 in 2007, while the poverty rate remained statistically unchanged, overall median income rose modestly, and the number and percentage of Americans without health insurance fell somewhat, according to Census data issued today. But the poverty rate remained higher, median income for working-age households remained lower, and the number and percentage of Americans without health insurance remained much greater than in 2001, when the last recession hit bottom.
This marks the first time on record that poverty and the incomes of typical working-age households have worsened despite six consecutive years of economic growth.[1] The new data show that in terms of poverty and median income, the economic expansion that started at the end of 2001 was the worst on record. The data provide fresh evidence that the gains from the expansion were quite uneven and flowed primarily to high-income households.
Moreover, the weakening of the economy makes it very likely that in 2008, poverty will rise, median income will fall, and the number of uninsured will rise.
The new Census figures show:
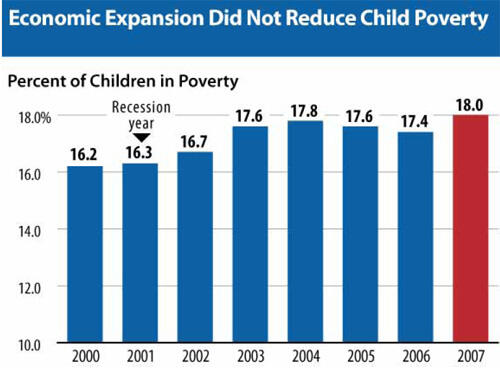
- The poverty rate stood at 12.5 percent in 2007, which was statistically unchanged from the 12.3 percent level for 2006 but well above the 11.7 percent level for 2001. The child poverty rate climbed from 17.4 percent in 2006 to 18.0 percent in 2007.
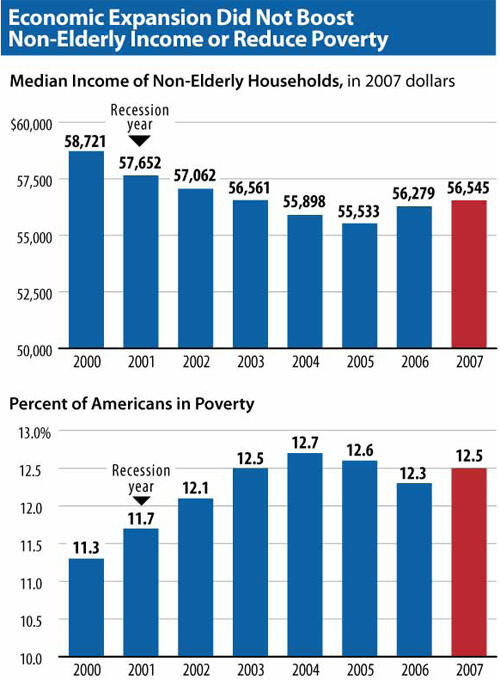
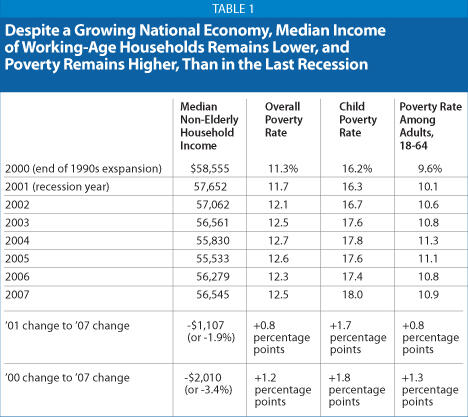
- Overall median income increased from $49,568 in 2006 to $50,233 in 2007, compared to $49,455 in 2001. But median income for working-age households (i.e., those headed by someone under 65) remained statistically unchanged from the 2006 level and was $1,100 below its level in the recession year of 2001 — and $2,000 below its level for 2000 when the previous economic expansion peaked. (All median income figures are adjusted for inflation.)
- The percentage of Americans without health coverage fell from 15.8 percent in 2006 to 15.3 percent in 2007, and the number of uninsured declined by 1.3 million to 45.7 million. The improvement occurred because the increased enrollment in public programs — notably Medicare and Medicaid — more than offset a decline in the portion of the population with employer-sponsored coverage. The number and percentage of Americans without insurance remained, however, well above the figures for 2001. In that year, 39.8 million Americans, or 14.1 percent of the population, were uninsured.
Poverty Rate Unchanged in 2007; Remains Significantly Higher than 2001
The percentage of Americans in poverty remained statistically unchanged in 2007, at 12.5 percent. The poverty rate remained well aboveits 11.3 percent level in 2000 — the year of the previous economic cycle most comparable to 2007 (and the year when poverty reached its lowest point during the 1990s economic expansion).
The poverty rate in 2007 was even well above its 11.7 percent level in 2001, when the last recession occurred. (See Table 1.) This means that if 2007 turns out to be the final year of this economic expansion, the recovery will have produced no gain whatsoever in reducing poverty. In fact, poverty will have been higherat this end of the expansion than during the previous recession.
As noted, the number of people living in poverty climbed by 816,000 between 2006 and 2007. Over the 2001-2007 period, the number of people in poverty grew by 4.4 million. The number of children in poverty grew by 500,000 in 2007 and by 1.6 million over the 2001-2007 period.
The number of Americans who live in “deep poverty” — that is, who have incomes below half of the poverty line — rose even more rapidly, climbing by nearly one-sixth between 2001 and 2007. Some 15.6 million Americans lived below half of the poverty line in 2007. (Half of the poverty line is approximately $8,300 for a family of three in 2007).
Median Income for Working-Age Households Lower in 2007 than in 2001
The economic expansion produced no gain in median income for the group normally most helped by economic growth — non-elderly households. As noted, median income for these households in 2007 was $1,107 below its level in the 2001 recession year. [2]
Median income for elderly households, in contrast, rose between 2001 and 2007. One reason that the elderly fared better than others during the expansion appears to be the continued strength of Social Security retirement benefits, which are designed to keep pace with earlier increases in average wages. (Retirees’ initial Social Security benefits are set by a formula that depends in part on the level of average wages in the economy in the year a retiree turns 60. The population of seniors increasingly consists of workers who turned 60 after the rapid wage growth of the 1990s lifted average wages. For seniors as a group, Social Security benefits are rising now due in part to the wage growth of the 1990s, although these gains have been somewhat offset by the benefit reductions resulting from the gradual increase, starting in 2000, in Social Security’s full retirement age.)
A second reason elderly incomes have increased since 2001 is that more retirees are working. The percentage of people age 65 and older who worked during the year rose from 12.6 percent in 2001 to 15.5 percent in 2007.
Unshared Gains from Economic Growth and Trends in Income Inequality
The fact that poverty was higher, and median income for working-age households lower in 2007 than in 2001, despite six years of economic growth, is the latest evidence that the economic expansion was weak and quite uneven. The income growth that occurred after 2001 appears to have had little effect on middle- and lower-income households of working age.
Recent Commerce Department data illuminate this trend. They show that during the 2001-2007 expansion, a range of economic indicators — including gross domestic product, wages and salaries, employment, consumption, total compensation, and net worth — grew more slowly, on an average annual basis, than they did during the recovery of the 1990s. Growth in every one of these key indicators from 2001 to 2007 also was slower than the average level of growth in the nine previous economic expansions since World War II. Corporate profits, by contrast, grew much more rapidly in the 2001-2007 expansion than in the earlier expansion periods. [3]
How Poor Is “Poor”?
In the poverty data the Census Bureau released today, Americans are considered poor if their annual incomes in 2006 were below $16,530 for a three-person family, equivalent to $1,380 a month. For a family of four, the poverty line was $21,200 a year, or $1,770 a month.
These amounts are modest. For example, the typical rent paid by U.S. renters is $737 a month, or $8,843 on an annualized basis.*
* American Housing Survey data for 2005, www.census.gov/prod/2006pubs/h150-05.pdf, in 2007 dollars.
The Census data released today appear to show a slight decline in inequality between 2006 and 2007. This component of the Census data, however, is not reliable. It is well known among analysts that for methodological reasons, Census data are not a good measure of trends in inequality. The Census data fail to capture a substantial amount of income at the top of the income scale, in part because the Census Bureau records income only up to certain specified levels. For example, Census does not count earnings above $999,999; if an individual has a job paying $5 million, Census records the individual’s earnings as $999,999. If the individual’s earnings climb from $5 million to $10 million, Census records the individual’s income as remaining flat at $999,999. (The Census Bureau does this to insure confidentiality.) The Census data also leave out all capital gains income, which flows disproportionately to the most affluent households.[4]
Largest Poverty Increases Occurred in Midwest and South
Between 2006 and 2007, the growth in the number of people in poverty was concentrated in the Midwest and the South.
Over the course of the 2001-2007 period, the largest increase in the poverty rate occurred in the Midwest, with the rate rising from 9.4 percent in 2001 to 11.1 percent in 2007. This likely reflects weakness in the job market in much of the industrial Midwest. Over the same period, the largest increases in the number of poor people occurred both in the South — with an increase of nearly 2 million people in poverty — and the Midwest, with an increase of almost 1.3 million.
Increase in Poverty Since 2001 Not Driven By Immigrants
Over the 2001-2007 period, the number of people in poverty grew by 4.4 million, with 84 percent of the increase due to an increase in the number of citizens in poverty (and 78 percent due to an increase in the number of poor native-born citizens). The poverty rate for native-born citizens and noncitizens alike increased over the 2001-2007 period.
The increase in the number of poor people just between 2006 and 2007 was more concentrated among immigrants. The number of poor citizens grew by 416,000, while the number of poor non-citizens grew by 400,000. Census data show that the growth in poverty among non-citizens between 2006 and 2007 was due to an increase in the poverty rate among that group, not to an increase in the number non-citizens residing in the United States.
The growth in poverty among non-citizens in 2007 may be due in part to weakness in certain sectors of the labor market that employ a larger share of immigrants than other sectors. More data and research are needed to understand what drove the trends in poverty among non-citizens in 2007.
Economy Has Soured Since 2007
The Census figures released today cover 2007. There are clear signs that the economic situation has deteriorated in 2008. Poverty and the share of Americans without health insurance are almost certainly rising now, and median income is almost certainly falling.
Labor Department data show marked deterioration in employment, unemployment, and weekly earnings in recent months. The unemployment rate reached 5.7 percent in July 2008, up from 4.7 percent 12 months earlier, and the number of jobs in the economy fell by 463,000 over the first seven months of this year. The number of long- term unemployed workers — workers who have not been able to find a job despite looking for 27 weeks or more — rose to 1.7 million in July 2008, up 28 percent from the year before. The average hourly earnings of production workers fell by 2.9 percentin inflation-adjusted terms during the same period, as high food and energy prices contributed to the rising cost of living.
Similarly, the Commerce Department reports that economic growth has slowed to a stall. The size of the economy, as measured by real gross domestic product, declined in late 2007 and, on a per-person basis, remains below the level in the third quarter of 2007. Most forecasters expect the unemployment rate to keep rising toward 6 percent in the second half of the year, because they do not see underlying strength in an economy that continues to fight the headwinds of high food and energy prices, ongoing housing market woes, and credit market jitters.
The downturn in economic indicators, if sustained throughout 2008, bodes poorly for poverty and income. In the past, when the unemployment rate has risen and weekly earnings have declined, median annual income has always fallen and poverty has always increased. Unless the economic situation improves unexpectedly in coming months, the 2008 income and poverty figures will be worse than those for 2007.
This also means that 2007 may represent the final year of the economic expansion that began in late 2001, making it possible to compare that expansion with other periods of economic growth in the past. Such a comparison shows that the period from 2001 to 2007 was unique. In no other six-year period of economic growth on record was the poverty rate higher, and median income of non-elderly families lower, than before the period of growth began.
Percentage and Number of Uninsured Remain High
In 2007, some 45.7 million Americans — 15.3 percent of the population — were uninsured. These figures represent an improvement over the figures for 2006, but marked deterioration since 2001, when nearly 6 million fewer Americans lacked insurance.
The main reason for the increase in the uninsured population over this period is that the percentage of people with employer-sponsored health insurance decreased significantly from 2001 — when 63.2 percent of Americans had employer-sponsored coverage — to 2007, when 59.3 percent did. Employer-sponsored coverage rates are likely to decline further in 2008, in part due to the economic downturn.
Employer-based coverage declined once again between 2006 and 2007, from 59.7 percent to 59.3 percent. The reason that the percentage and number of uninsured people fell in 2007 is that more Americans were able to obtain government-funded health insurance. The percentage of Americans with insurance through a public program increased from 27.0 percent in 2006 to 27.8 percentage in 2007, primarily as a result of gains in coverage through Medicare and Medicaid.
The ability of public programs like Medicaid to offset erosion in employer-sponsored health insurance could disappear in 2008 or 2009. Medicaid programs face a risk of cuts in numerous states, because a growing majority of the states face budget deficits due to the economic slowdown. Since nearly every state is required to balance its budget each year, an increasing number of states may consider scaling back Medicaid benefits and eligibility in the year ahead. Congress could help states to avert or minimize such cuts by temporarily increasing the federal share of Medicaid costs, as it did in response to the last economic downturn.
The data for 2007 show some improvement in children’s health coverage. The percentage of children without coverage dropped from 11.7 percent in 2006 to 11.0 percent, and the number without coverage dropped by 500,000, from 8.66 million to 8.15 million. This erased about half of the increase in the number of uninsured children that occurred between 2004 and 2006, but still left children’s coverage well short of its level in 2004, when the number of uninsured children stood at 7.7 million.
Policy choices have played a strong role in trends in children’s health insurance over the past decade. The number and percentage of children who are uninsured fell consistently from 1998, when the State Children’s Health Insurance Program (SCHIP) started, to 2004, as increasing enrollment of low-income children in SCHIP and Medicaid more than offset declines in employer-based coverage. Between 2004 and 2006, however, progress in covering children largely ceased as SCHIP and Medicaid enrollment slowed while employer-based coverage continued to erode.
States were again able to make some progress in enrolling more children in SCHIP and Medicaid in 2007. However, last year Congress failed to override a presidential veto of SCHIP legislation that the Congressional Budget Office estimated would have led by 2012 to coverage for nearly 4 million children who otherwise will be uninsured; this means many states likely will be unable to sustain or build upon this progress in 2008. Congress may reconsider this legislation in September.
End Notes
[1] The poverty data date back to 1959, while the data on incomes of typical working-age households date back to 1967.
[2] Immigrants saw significant income losses between 2006 and 2007. Overall median income for households headed by a non-citizen fell 7.3 percent in 2007.
[3] Aviva Aron-Dine, Chad Stone, and Richard Kogan, “How Robust is the Current Economic Expansion?” Center on Budget and Policy Priorities, updated April 22, 2008. Some have argued that wages and salaries have grown slowly in the recent recovery only because the cost of other forms of employee compensation, such as employer-provided health care benefits, has grown rapidly. The Commerce Department data show, however, that while total employee compensation has grown somewhat more rapidly than wages and salaries, total compensation itself has grown more slowly than in the average recovery since World War II.
[4] An examination of data for 2006 illustrates how much of the change in inequality is missed in the annual Census income data. The Census Bureau’s Gini index rose by only a statistically insignificant amount in 2006. Yet highly regarded research conducted by economists Thomas Piketty and Emmanuel Saez, using IRS tax-return data that reflect actual incomes at the top of the income scale, shows that income inequality grew markedly in 2006. Piketty and Saez also found that the top 1 percent of households received nearly half (42 percent) of the overall increase in household income that occurred between 2001 and 2006, and that the percentage of national income that goes to the top 1 percent of households was higher in 2006 than in any year since 1928. . (These data are available at http://elsa.berkeley.edu/~saez/; see “Updated Tables and Figures Updated to 2006 in Excel Format, July 2008”. For further details, see Chye-Ching Huang and Chad Stone, “Average Income in 2006 Up $60,000 for Top 1 Percent of Households, Just $430 for Bottom 90 Percent” Center on Budget and Policy Priorities, July 29, 2008.)
In addition to leaving out these income sources for the wealthiest Americans, the basic Census data also miss some sources of income for lower-income households. The Census do not capture all cash welfare payments for the poorest Americans (although the number of dollars missed has declined in recent years as the amount of cash welfare assistance has shrunk.) The Census data also do not count as income such items as Earned Income Tax Credit payments and food stamp benefits.
More from the Authors


Areas of Expertise
