What Do OECD Data Really Show About U.S. Taxes and Reducing Inequality?
Critics of proposals to make the tax system more progressive or to take other steps to help lessen widening income inequality[2] sometimes cite a 2008 Organisation for Economic Co-Operation and Development (OECD) report stating that the United States has the most progressive tax system among developed countries.[3] The implication is that, with a progressive tax system, the United States is already taking very substantial steps to address income inequality.
But to cite the report’s finding on the progressivity of the U.S. tax system while ignoring its other findings amounts to cherry picking and distorts the report’s overall findings. The report also shows that the United States does less to reduce income inequality than every other OECD country examined except Korea, when one considers both various taxes and cash transfer programs such as Social Security, unemployment insurance, and means-tested assistance programs.
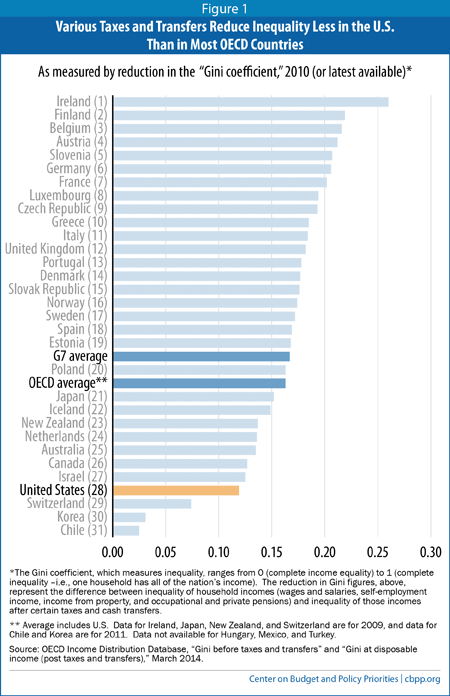
The 2008 OECD report uses data from the mid-2000s. Updated OECD data for 2010 similarly show that the United States does relatively little to reduce inequality compared with other advanced industrial countries, despite having a progressive tax system. In 2010, taxes and cash transfers did less to reduce inequality in the United States than in any other OECD country examined except Korea, Chile (which didn’t join the OECD until 2010), and Switzerland (which didn’t start producing the relevant data until 2009). (See Figure 1.)
There are two main reasons for the United States’ comparatively poor performance in reducing inequality:
- While the taxes that the OECD analysis examined are more progressive in the United States than in other OECD countries, they also are smaller (in terms of the revenue they collect) in the United States than the OECD average. The OECD report notes that the amount of revenue a tax system raises, as well as its progressivity, determines how effectively the tax system reduces income inequality. The taxes that the OECD report examined — federal and state individual income taxes (including refundable credits) and the employee share of payroll taxes — constitute a smaller share of household income in the United States than in the average of OECD countries for which there are data.
- Cash transfers are smaller and less progressive in the United States than in other OECD countries. U.S. cash transfers are about half as large as the OECD average, measured as a share of household disposable income. Further, U.S. cash transfers are less progressive than those of the average OECD country. For these reasons, the OECD report shows that cash transfers do less to reduce household cash income inequality in the United States than in almost any other OECD country. (The OECD measure of cash transfers includes cash payments such as Social Security, unemployment insurance, and Temporary Assistance for Needy Families, as well as “near-cash” supports such as the Supplemental Nutrition Assistance Program, previously known as food stamps, and housing allowances.)[4]
As a result, the latest OECD data show that while the United States has the tenth-highest level of income inequality of the 31 OECD countries examined before considering taxes and transfers, it has the fourth-highest level of inequality after considering them.[5]
It is important to note that the OECD analysis omits some taxes and transfers due to data limitations (see Appendix). It includes state and federal individual income taxes but omits regressive state sales taxes, other consumption taxes (which most other OECD countries have), and corporate income taxes. It also omits some in-kind transfers, such as for health care and education. It is unclear how including all of the missing pieces would affect the findings. But citing only the OECD’s finding about the progressivity of the U.S. tax system while ignoring its other findings, as some have done, provides an incomplete and often misleading picture of the OECD report.
U.S. Has High Income Inequality Both Before and After Taxes and Transfers
OECD data (from the 2008 report, as well as the more recent data from 2010) show that before taxes and cash transfers, the United States has higher inequality in household cash incomes than the OECD average, as measured by the Gini coefficient.[6] (The Gini coefficient measures the share of income held by each percentile of the income distribution: 0 represents perfect equality, while 1 represents perfect inequality, with one household receiving all of the country’s income.)
The United States also has higher inequality in household cash incomes than the average of the wealthy “G-7” countries, which are more affluent as a whole than the 31 OECD countries examined. Figure 2 presents this information using the OECD data from 2010, the most recent available.
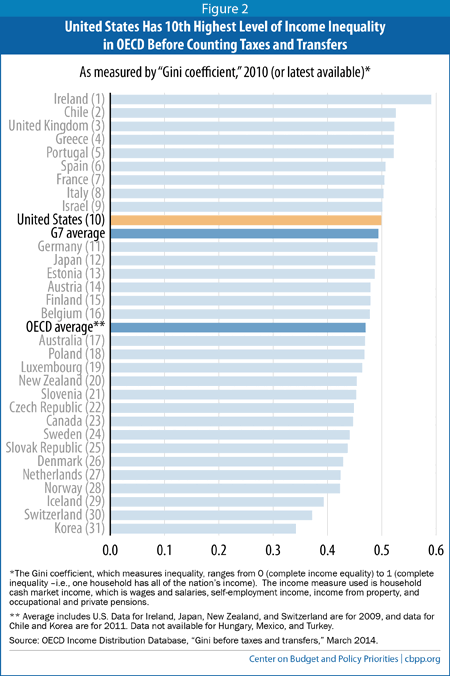
Figure 3 shows income inequality after taking into account various taxes and cash and near-cash transfers, using the OECD data for 2010 or the latest available year. Taking these policies into account, income inequality falls in all OECD countries, which shows that all OECD countries have a tax and cash transfer system that is progressive overall.
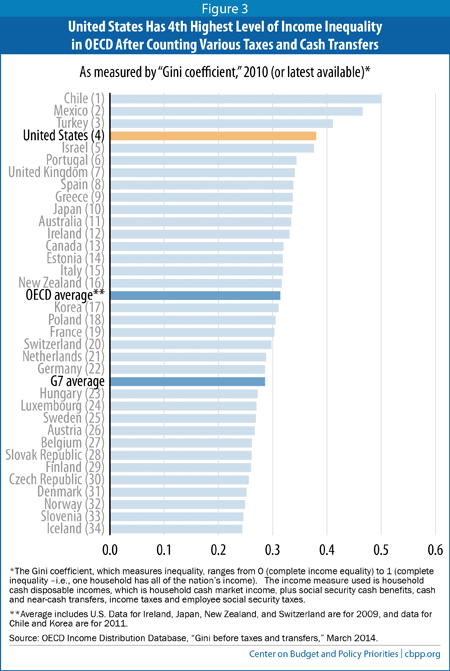
But the degree to which the various OECD countries reduce inequality varies substantially. Relative to the other countries, the United States ranks worse on inequality after accounting for certain taxes and cash transfers than it does before taxes and transfers are taken into account. In 2010, it had the tenth-highest level of inequality before taxes and transfers (see Figure 2), but the fourth-highest level of inequality after taxes and transfers are considered (see Figure 3).
This means that the taxes and cash transfers the OECD studied do less to reduce inequality in the United States than taxes and transfers do in almost all of the other OECD countries examined. The 2008 OECD report shows that in the mid-2000s, the United States did less to reduce inequality than any other OECD country except Korea.[7] In 2010, the most recent year for which these data are available, the United States did less to reduce inequality than any of the 31 OECD countries examined except Korea, Chile (which joined the OECD in 2010), and Switzerland (which only started producing the relevant data in 2009). (See Figure 1.)
Low Taxes, Small Transfer System Limit U.S. Efforts to Reduce Inequality
The 2008 OECD report found that U.S. tax system was the most progressive among the OECD countries studied. This finding mostly reflects the structure of the U.S. tax system — for instance, its graduated rates and refundable tax credits for low- and moderate-income people. But it also reflects this country’s high level of income inequality before taxes. As the OECD report notes, if two countries have identical tax schedules that include graduated marginal rates, the tax system will have a more progressive impact in the country with higher pre-tax inequality, because a larger share of that country’s income will be taxed at the top rates.[8]
Why does the U.S. tax and cash transfer system do relatively little to reduce inequality in household cash incomes, despite the progressivity of the U.S. tax system? The answer is that tax progressivity by itself gives an incomplete picture of how much taxes and cash transfers reduce inequality.
First, even if a tax system is highly progressive, it will do less to reduce inequality if it raises only a relatively modest amount of revenue. Consider an income tax system that levies a tax of $1 on the highest-income individual and nothing on anyone else. The OECD’s main measure of progressivity, the “concentration coefficient,”[9] would rate this as the most progressive tax system possible. But it would do virtually nothing to reduce inequality.
The 2008 OECD report shows that in the mid-2000s, income taxes and employee payroll taxes made up 25.6 percent of household disposable income in the United States, less than the average of 28.3 percent for the 25 OECD countries examined (and 29.3 percent for the 24 OECD countries excluding the United States). As a result, while U.S. income and employee payroll taxes were the most progressive in the OECD, they were only the fourth most effective in reducing income inequality.[10]
Second, any fair evaluation of the degree to which public policies reduce inequality must take into account government transfers as well as taxes. The United States spends relatively little on cash transfers: the 2008 OECD report showed that in the mid-2000s, U.S. cash transfers were 9.4 percent of household cash disposable income, the third lowest in the OECD and far below the OECD average of 21.8 percent.[11] U.S. transfer payments were also below the OECD average for progressivity.[12]
Because of their comparatively small size and below-average progressivity, U.S. cash transfers do less to reduce inequality in household cash incomes than those in any other OECD country except Korea, according to the 2008 OECD report.[13]
In sum, the United States’ combination of a relatively small (though progressive) income and employee payroll tax system and a relatively modest (and comparatively less progressive) cash transfer system reduces income inequality less than in all but a few other OECD countries. As Figure 1 above shows, in 2010, U.S. taxes and cash transfers did less to reduce inequality than all countries for which data are available except Korea, Chile, and Switzerland.
Appendix: Limitations of the OECD Data and Analysis
The 2008 OECD report is careful to note gaps in the data (primarily caused by lack of comparable data between countries) and explains how its methods of analysis affect its results. For example, the OECD data do not include the following:
- U.S. state and local sales taxes, federal and state excise taxes, or national consumption taxes (which are common in OECD countries);
- the employer share of payroll taxes;
- households’ non-cash income, such as unrealized capital gains;
- households’ share of undistributed corporate earnings, or corporate income taxes paid on their shares of corporate income; and
- non-cash government transfers, such as health care and education (i.e., those transfers that are neither made in cash nor are “near-cash” transfers like SNAP and some forms of housing assistance).
It is unclear how including all of these factors would alter the analysis. The 2008 OECD report tried to address the omission of one factor by tentatively analyzing how non-cash transfers affect inequality, while noting the data limitations and methodological challenges of such an analysis (such as how to value and distribute the benefit of non-cash transfers to households). It found that, once non-cash transfers (as well as taxes and cash transfers) are considered, the United States achieved a significantly larger reduction in its Gini coefficient relative to the other OECD countries than if the non-cash transfers were not included.[14] But it also showed that the United States was the most unequal (by the Gini measure) of the 19 countries for which the OECD had this data regardless of whether the non-cash transfers were taken into account.
In addition, when examining data on inequality, it should be noted that different inequality measures can be informative about different things. The OECD report primarily uses the Gini coefficient to measure income inequality, and measures similar to the Gini coefficient to measure the progressivity of tax and transfer systems. The Gini measure is most sensitive to changes in incomes in the middle of the income distribution, while some other measures give more information about inequality at other parts of the income distribution (for example, by comparing changes in incomes at the 20th and 80th percentiles).
Some progressive tax changes have taken effect in the United States in the past few years, particularly the rise in the top marginal income tax rate under the American Taxpayer Relief Act (ATRA) and the taxes under the Affordable Care Act (ACA). But these changes have likely made the U.S. tax system only modestly more effective at reducing income inequality relative to other OECD countries because the U.S. tax system overall remains comparatively small relative to the economy.
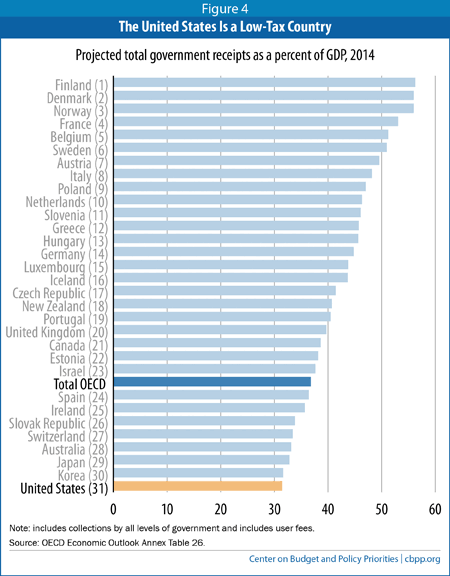
The OECD forecasts that total government receipts in 2014 will be smaller as a share of gross domestic product (GDP) in the United States than in all other OECD countries (see Figure 4).[15] These forecasts are based on a more comprehensive measure of revenues that includes all federal, state, and local government receipts, so they include many of the taxes and non-tax revenues left out of the 2008 OECD analysis. They also include the impact of ATRA and the ACA.
End Notes
[1] Former CBPP Research Associate Krista Ruffini contributed initial research to this report.
[2] See, for example, Veronique de Rugy, “U.S. Already Has a Steeply Progressive Tax System,” Washington Examiner, March 12, 2012, http://washingtonexaminer.com/u.s.-already-has-a-steeply-progressive-tax-system/article/213301; Scott Hodge, “News to Obama: The OECD Says the United States Has the Most Progressive Tax System,” Tax Foundation, October 29, 2008, http://taxfoundation.org/blog/news-obama-oecd-says-united-states-has-most-progressive-tax-system. Also see Katy O’Donnell, “For Poverty, Tax Code Debate Offers Little Consensus,” CQ Roll Call, Jan. 8, 2014.
[3] Organisation for Economic Cooperation and Development (OECD), Growing Unequal? Income Distribution and Poverty in OECD Countries, 2008, http://www.oecd.org/els/soc/growingunequalincomedistributionandpovertyinoecdcountries.htm.
[4] Michael Förster and Marco Mira d’Ercole, “The OECD Approach to Measuring Income Distribution and Poverty,” OECD,
http://umdcipe.org/conferences/oecdumd/conf_papers/Papers/The%2520OECD%2520Approach%2520to%2520Measuring%2520Income%2520Distribution%2520and%2520Poverty.pdf, footnote 21.
[5] Similarly, the 2008 OECD report, using data from the mid-2000s, showed that the United States ranked 20th of 30 OECD members in income equality before considering various taxes and transfers but fell to 27thafter considering them.
[6] Also see Kathy Ruffing, “Gini Index Shows Steady Increase in Inequality Over Time,” Off the Charts blog, September 19, 2013, http://www.offthechartsblog.org/gini-index-from-census-confirms-rising-inequality-over-four-decades/.
[7] The 2008 OECD report also presented an alternative measure of the effectiveness of tax and transfer systems in reducing inequality (OECD, Figure 4.4). On this measure the United States was well below average for the 25 OECD countries examined, ranking sixth and eighth least effective at reducing inequality by percentage and percentage point changes respectively. The OECD has not updated the data for this alternative measure.
[8] OECD, pp. 105-106.
[9] The concentration coefficient is similar in concept to the Gini measure of market income inequality. A value of zero means that all income groups receive an equal share of household transfers or pay an equal share of taxes. The concentration coefficient for income and employee payroll taxes for the mid-2000s was .586 for the United States but averaged .428 for the 24 OECD countries for which there were data. OECD, Table 4.3.
[10] OECD, Table 4.6. These data have not been updated for 2010.
[11] OECD, Table 4.2.
[12] OECD, Table 4.3.
[13] OECD, Figure 4.6. These data have not been updated for 2010.
[14] OECD, Chapter IV.9
[15] The OECD uses the United Nations’ System of National Accounts (SNA), which measures the size of the government sector differently than most U.S. statistics do. Most importantly, the SNA counts the charges that users pay for many public services, like state-university tuition and public-hospital fees, as government receipts. Such adjustments push up the SNA’s measure of both spending and receipts in the United States by roughly 4 percent of GDP compared with the measure tallied by the U.S. Bureau of Economic Analysis.
More from the Authors